BIO-111 Exam 1
1/144
There's no tags or description
Looks like no tags are added yet.
Name | Mastery | Learn | Test | Matching | Spaced | Call with Kai |
|---|
No analytics yet
Send a link to your students to track their progress
145 Terms
step 1 of scientific research
make observations, use prior knowledge and readings
step 2 of scientific research
develop a hypothesis
step 3 of scientific research
design a study (methodology)
step 4 of scientific research
collect and analyze data
create graphs and figures
step 5 of scientific research
form evidence-based conclusions
questions:
what kind of study?
how was it carried out?
what are the treatments, controls, sample size?
what were the main findings?
step 6 of scientific research
publish in peer review and share experiment
research hypothesis (alternative)
plausible + testable general explanation for a phenomena (HA)
null hypothesis
if the study doesn’t support the alternative hypothesis, it must support the null (H0)
prediction
specific outcome for a particular experiment/study designed to test the alternative hypothesis
there are typically multiple predictions per experiment
study type: experiment
manipulating a group and comparing it to the control
study type: observational
no intervention within study
study type: meta-analysis
process of looking at multiple studies and data to come to a conclusion
study type: modeling
create a mathematical expectation
treatment
the independent variable
the subject being manipulated and what is being used to manipulate
control group
group used to test efficacy of treatments
does not recieve treatment co
constant
all parts of study that are not changing
ie. same color, size, predator, temperature, etc.
dependent variable
what we are measuring
__ depends on __
ex: test score depends on amnt of time studying
challenges an organism faces
obtaining nutrients/water/energy
surviving weather and extremes
competition
predation
avoiding pathogens and parasites
produce offspring
Ecology
study of how organisms interact with the environment
biotic
living
predators/prey
parasites
competitors
mutualists
mates
conspecifics
heterospecifics
abiotic
not giving (environment)
sunlight
precipitation
temperature
seasonality
substrate type
conspecifics
same species
heterospecifics
different species
why do we have seasons?
the earth is tilted
Why is the equator hot and the poles are cold?
the planet is round (latitudinal temperature gradient)
characteristics of rainfall
humid, hot air with low pressure
latitudinal bands of wet (low pressure) and dry (high pressure) climates
coriolis effect
deflection of moving object (wind current or projectile) due to earth’s rotation
ocean currents are influenced by
earth’s rotation and temperature gradient
water temp affect surrounding land tempsq
questions to ask to determine ocean currents
which direction is the water going?
how far away is it from the equator?
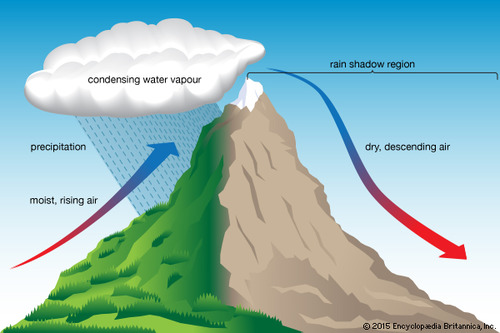
on a mountain, rainfall is greater…
near costs and on the windward side of mountain
true or false: species facing similar environments have evolved similar traits over time
true :)
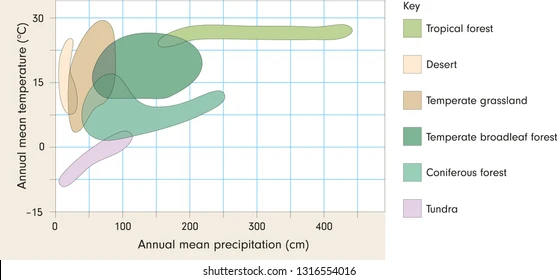
what primarily determines terrestrial biomes?
temperature and percipitation
most critical abiotic factors defining aquatic biomes
salinity
water flow
sunlight
temperature
individual
single living thing
population
all individuals of the same species, in the same area, at the same time
community
populations of all species in the same area
ecosystem
all species in an area including it’s abiotic aspects of their environment
biome
major assemblages of similar oganisms over wide geographical areasb
biosphere
the layer of earth in which organisms live
species requirements
all aspects and conditions necessary for successful life and reproduction of individuals
niche (3 flashcards)
niche
total combined requirements of a species, including its “role” in the ecosystem
based on unique needs, limitations, and interactions
fundamental niche
space in which a species could survive inf there were no other facts or limitations
ideal environment
realized niche
space in which species actually occurs due to its interactions and history
competition, predation, abiotic enviornment, etc.
4 major perspectives of animal behavior
causation
development
function
evolution
causation perspective
how mechanisms within the body cause behavior
internal drivers → physiology
anatomy, neurons, hormones, genetics
static and proximate
development perspective
how the behavior changes in an animal’s lifetime
learned or innate
starts from when behavior is first exhibited
can test with cross-fostering and breading experiments
proximate and dynamic
Function perspective
why is this behavior an adaptation
compare variation between indiviudals of same species or related species
compare unrelated species living in the same environment
ultimate and static
adaptation perspective
trait that increases survival and reproduction
evolution persective
why the behavior exists and how it has changed across different generations
compare specieis→ shared behaviors due to a shared ancestor or independent evolution
dynamic and ultimate
static
one time
proximate
how, zoomed in
dynamic
change in time
ultimate
why, broad
areas of behavioral ecology
foraging strategies
predator defense
resource competition
habitat choice
orientation, immigration, navigation
courtship + mate behaviors
reproduction
play behavior
personality
emotions
parental care
social organization
cooperation
learning + cognition
demography
study of population growth and regulation
immigrations effect on population
+
emigrations effect on population
-
births effect on population
+
deaths effect on population
-
natality
rate of births
mortality
rate of deaths
Per capita
how quickly is the population changing? (per individual)
ΔN
births-deaths+immigration-emigration
(for class purposes, ignore migration)
equation: ΔN= N1-N0
N0
initial population size
ΔN/Δt (bacteria)
x bacteria per y minutes
per capita growth rate equation
r=(ΔN/Δt)/N
in this case, N represents initial population size
which equations would you use for discrete generation problems?
Growth Rate
λ=N1/N0
dN/dt=r((K-N)/K)N
Future population size:
Nt=N0(N1/N0)
which equations would you use for constant and continuous generations?
Growth rate:
dN/dt=rN
ΔN/Δt=rN
future population size
Nt=N0ert
double in size
tdouble=ln(2)/r
e
mathematical constant
2.718
predicting population size
Nt=N0ert
r
intrinsic growth rate (per capita growth at that instant time)
invasive species
initially experience of ideal + unlimited environment (constant growth)
rebounding populations
recovering after a large population crash (ideal environment)
range
geographical area where a species occurs
abundance
number of individuals in a population
density
N/Area
spatial distribution
pattern of how individuals in a population
clumped distribution
resources patchy
defense
seeking mates

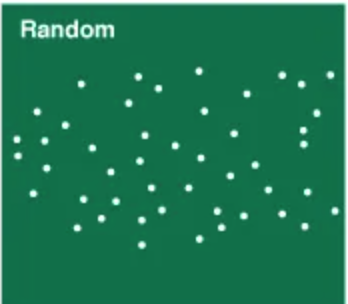
random distribution
resources random
dispersal due to wind or water currents
uniform distribution
resources limited
territorial species

models for estimating population, density, abundance, etc..
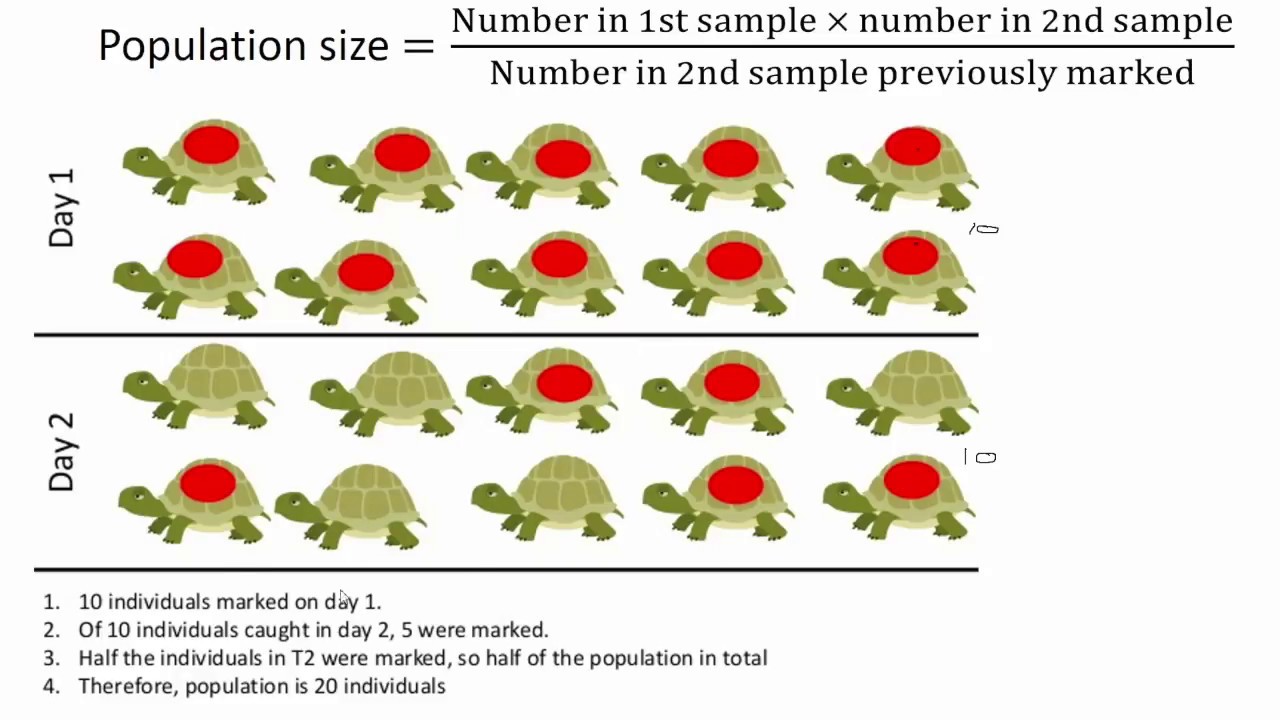
mark-recapture
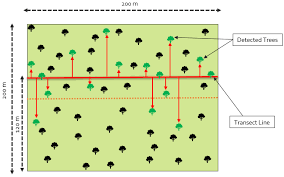
transects
quadrats
mark-recapture
capture as many individuals as you can, then mark them, release them, then capture again the same area. Count how many individuals captured in the second round were already tagged.
transects
Drawing a line across a habitat
quadrat
using net-like sections, could individuals in each area or estimate the coverage of the net.

true or false: growth rate can change as population grows
true
true or false: if growth rate is changing as the population grows, natality and mortality are constant and the exponential growth of the population is never limited
false
density independent change in population
does not depend on how many individuals are present
weather
abiotic environment
density dependent
depends on amount of individuals in an area
pathogens spreading
competition
predators
stress
hormone changes
true or false: density dependent factors slow growth as population size increases
true
carrying capacity equation
dN/dt = r ((K-N)/K) N
predicting “one step” of growth within the above equation when ethe environment is not ideal
carrying capacity definition
(k) maximum population size that a given environment can support over a long term
many generations
growth rate (r) approaches 0 as population (n) approaches ___
carrying capacity (k)
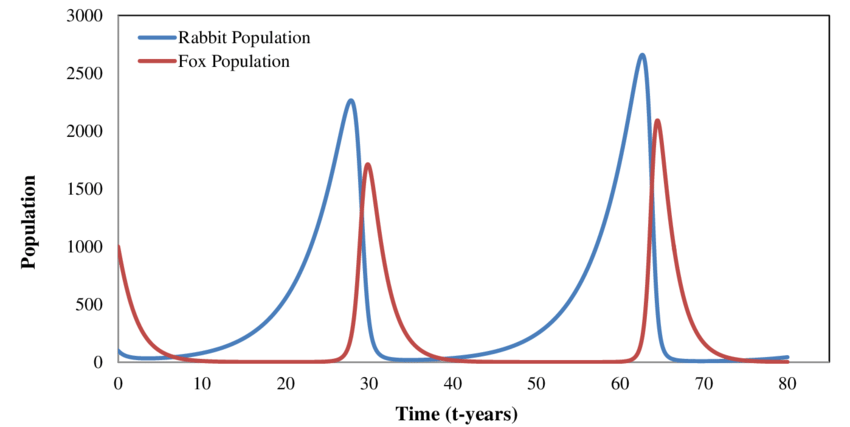
what defines cyclical patterns in the population size of a species?
incredibly rapid growth and sociality
causes of rapid increase in growth rate
dry and cool weather followed by a large amount of rain
if pop. (N) was already high in previous generations
interspecific
relations between different species
close relations regulate populations and can cause cyclic fluxuations (predator v prey)
intraspecific
relations between same species
interspecific competition is (more/same/less) intense than/as intraspecific competition?
less
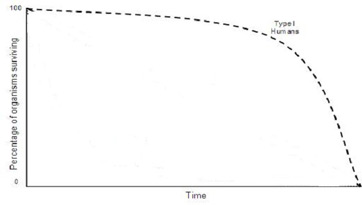
Type I survivorship curve
Population begins high and slowly declines (7 shape)
humans, large mammals, giant turtles, etc.
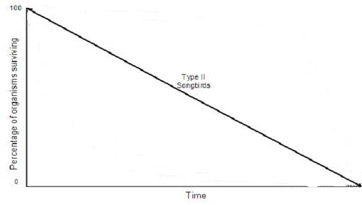
type II survivorship curve
steady rate of decline (linear)
birds, squirrels, rodents, lizards, etc.
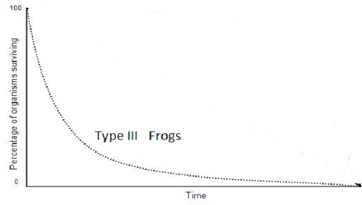
type III survivorship curve
Population begins high and rapidly crashes (L shape)
most insects, fish, sea urchins, some plants, etc.