Genetic Regulation
 Call Kai
 Learn
Learn Practice Test
 Spaced Repetition
 Match
Match Flashcards
 Knowt Play
1/11

There's no tags or description
Looks like no tags are added yet.
Name | Mastery | Learn | Test | Matching | Spaced | Call with Kai | Chat |
|---|
No analytics yet
Send a link to your students to track their progress
12 Terms
DNA contains genetic material that codes for the formation and regulation of protein synthesis within the cell. This can be described as a 2-step process:
mRNA production of DNA sequence (transcription)
mediated by RNA polymerase
Protein synthesis from mRNA (translation) - mediated by Ribosomes
Genetic expression in this context refers to the end product of a section of genetic material.
Genetics Background
Regulation of Transcription
Transcription factor proteins regulate gene transcription by increasing or decreasing its rate:
Activators: Increase transcription rate.
Repressors: Decrease transcription rate.
Autoregulation: Occurs when a gene codes for its own transcription factor:
Positive Autoregulation: Gene codes for its own activator.
Negative Autoregulation: Gene codes for its own repressor.
Overall Balance Equations
Conservation equations track mRNA (R) and protein (P) concentrations over time based on synthesis and degradation rates:
mRNA Balance: dR/dt=vtranscription−vRdeg
Protein Balance: dP/dt=vtranslation−vPdeg
Focus: Transcription Flux
Goal: Derive a constitutive equation for transcription rate (vtranscription) using underlying gene regulatory states.
Kinetic Approach: Uses equilibrium assumptions and detailed state models, analogous to enzyme kinetics, to determine overall transcription flux.
Mechanism: RNA polymerase binds to the DNA sequence and reads it to synthesize mRNA.
Regulation of Transcription
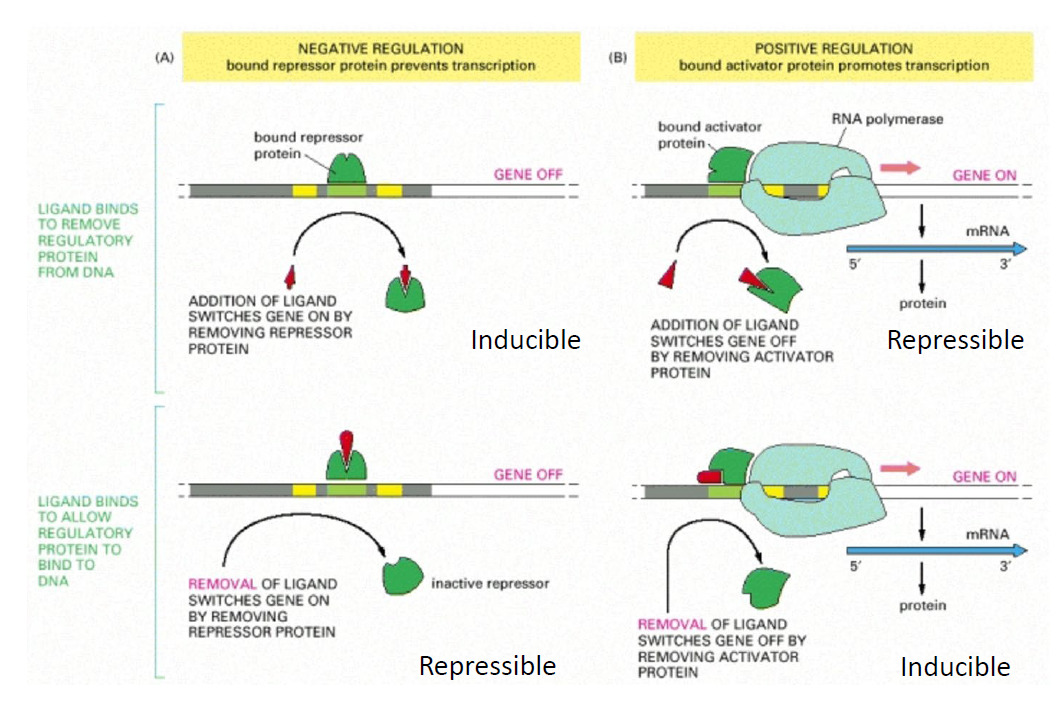
4 Types of Regulation
Transcription factor (TF) activity is modified by control molecules (inducers/corepressors):
Negative Inducible:
Baseline: Repressor TF binds DNA and blocks transcription.
With Control Molecule: Molecule binds repressor → repressor detaches → transcription allowed.
Negative Repressible:
Baseline: Repressor cannot bind DNA on its own → transcription occurs.
With Control Molecule: Molecule binds repressor → repressor binds DNA → transcription prevented.
Positive Inducible:
Baseline: Activator cannot bind DNA on its own.
With Control Molecule: Molecule binds activator → activator binds DNA → transcription allowed.
Positive Repressible:
Baseline: Activator TF binds DNA and allows transcription.
With Control Molecule: Molecule binds activator → activator detaches → transcription prevented.
Types of regulation
Gene Regulatory States & Fluxes
State Notation: Unique combinations of a gene, transcription factors (e.g., A, B), and control molecules are designated by state numbers (x0,x1,x2,x3) representing transitions between states with equilibrium constants (K1,K2,K3,K4).
Normalized Concentrations (Occupancy Probabilities): Concentration of genetic material is normalized as state fractions (xs) that sum to 1:
x0+x1+x2+x3=1
Overall Flux Constitutive Equation
Transcription Rate Equation: The overall constitutive equation sums the rate of each individual state multiplied by its state fraction:
vtranscription=x0v0+x1v1+x2v2+x3v3
General Summation Form:
vtranscription=s=0∑Ns−1xsvs
(where Ns is the total number of states, and the specific kinetic rate vs depends on whether the TFs act as activators or repressors).
Gene States
Lac Operon Regulation
E. Coli Metabolic Switching:
Preference: Prefers glucose for metabolism.
Adaptation: Switches to lactose metabolism when glucose is unavailable by expressing specific enzymes.
Key Concepts:
Genetic Switches: Distinct gene states that switch expression pathways (e.g., "off state" for glucose metabolism; "on state" upregulates lactose metabolism).
Operons: Cluster of genes controlled by a single promoter, allowing coordinated transcription of multiple proteins at once.
Regulatory Mechanisms:
Negative Inducible Pathway (Lactose Control):
Inhibitor (TF) binds Lac operon to block transcription.
Lactose acts as an inducer (control molecule): binds inhibitor → inhibitor detaches → transcription allowed.
Positive Repressible Pathway (Glucose Control):
cAMP-CAP complex acts as an activator promoter to enable transcription.
Glucose acts as a repressor: high glucose reduces cAMP levels → prevents cAMP-CAP formation → transcription prevented.
Dual Requirement: Lac operon transcription requires both the absence of glucose AND the presence of lactose.
Positive Autoregulation: Lac operon proteins transport more lactose into the cell, which further drives its own activation.
Genetic switches
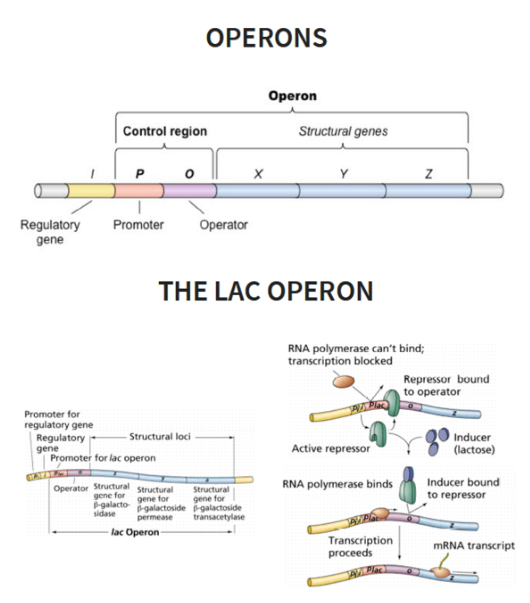
Definition: A section of genetic material containing a cluster of genes under the control of a single promoter.
Key Function: Allows the transcription of multiple related proteins to be regulated and controlled at a single genomic site simultaneously.
Operons
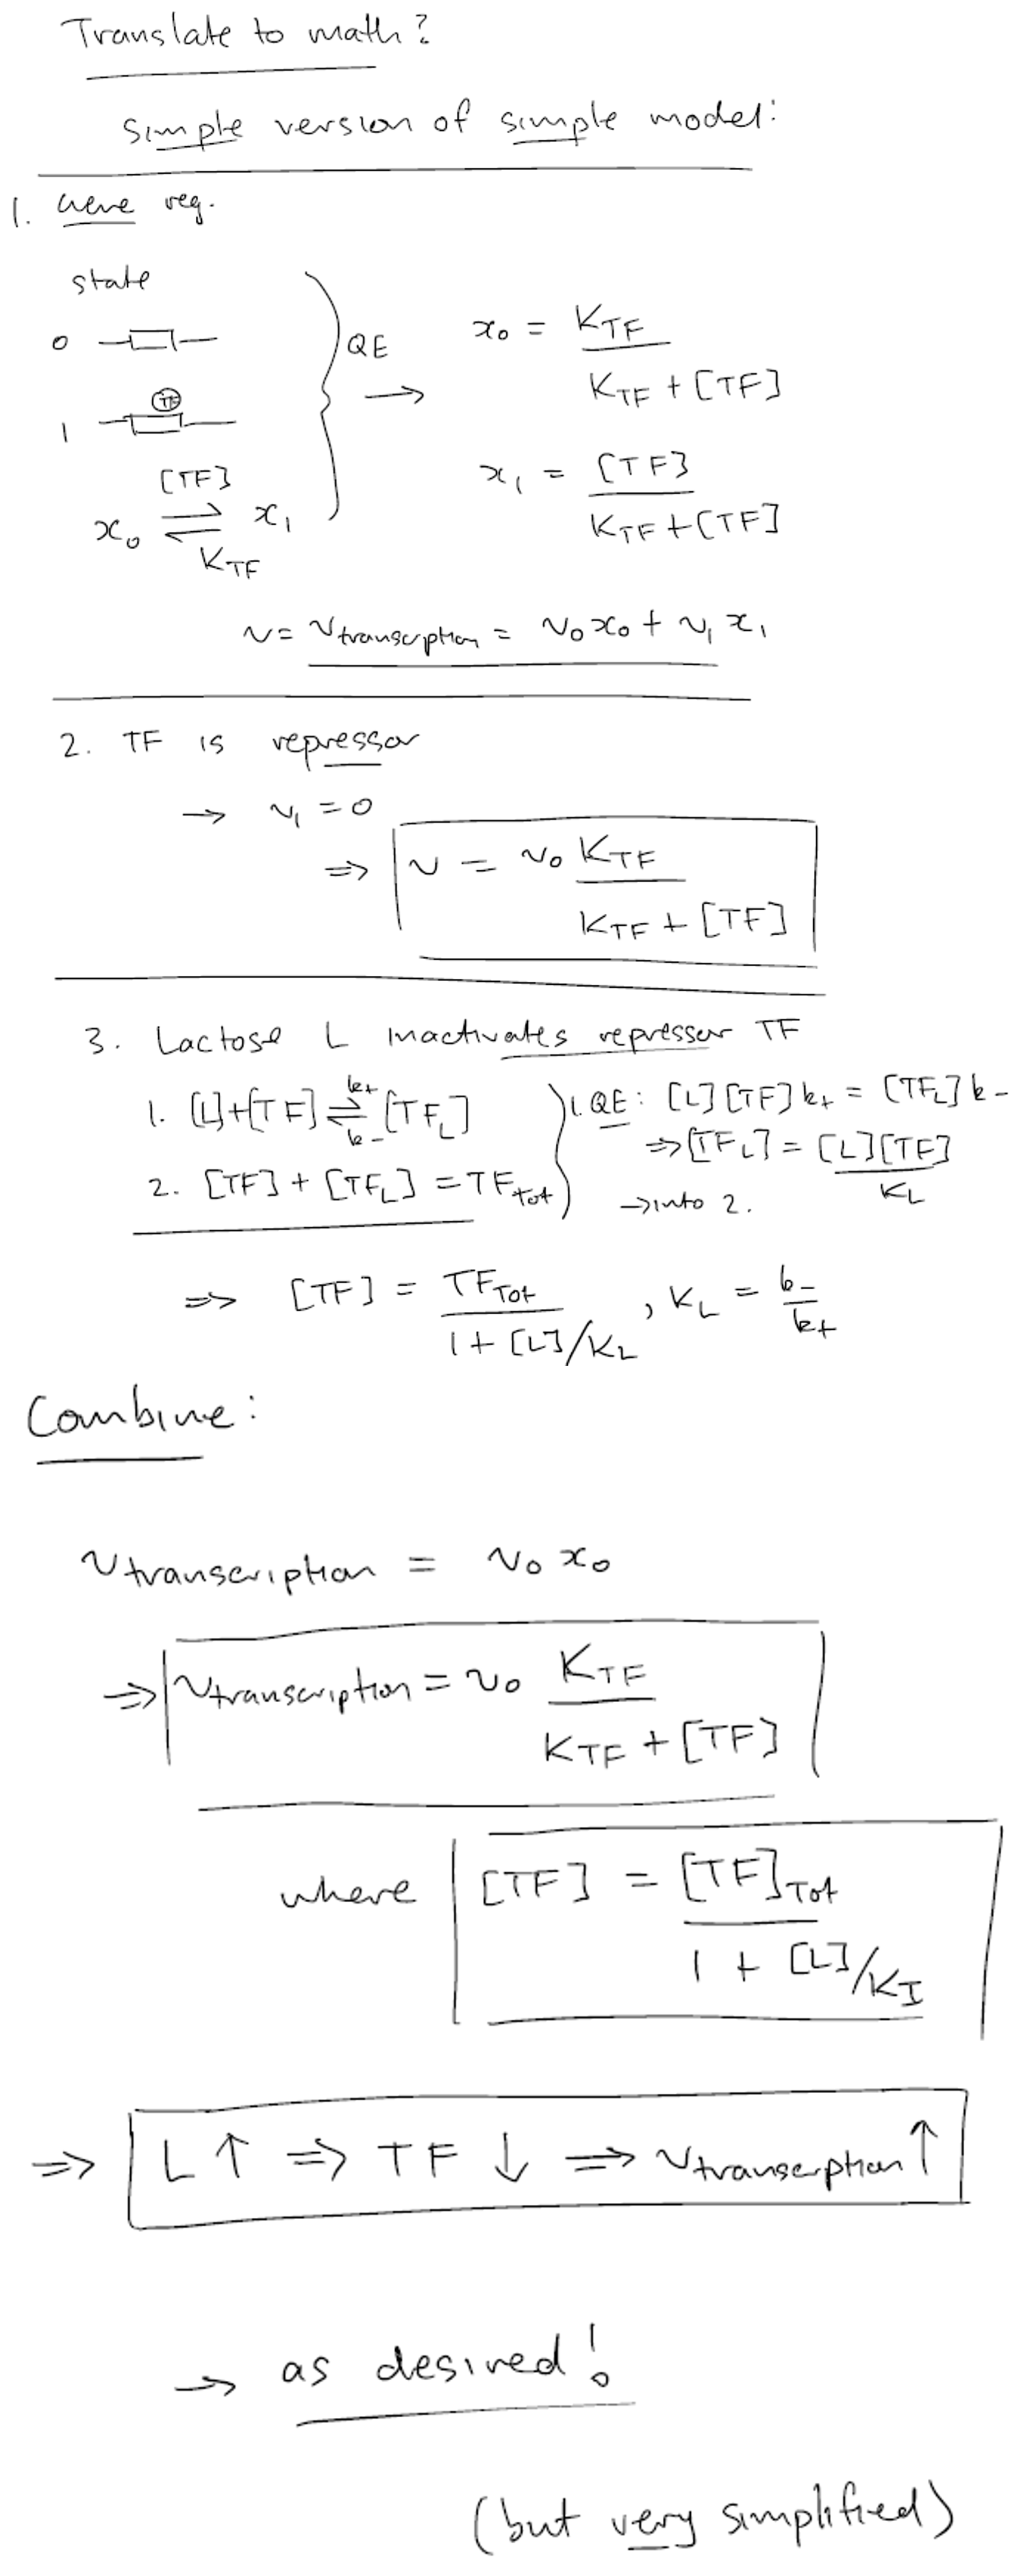
Lac Operon Regulation
Negative Inducible Pathway (Lactose Control):
Repressor/Inhibitor: Binds to the Lac operon in the default state to block transcription.
Lactose (Inducer): Binds to the repressor → repressor detaches → transcription is initiated/increased.
Positive Repressible Pathway (Glucose Control):
cAMP-CAP Complex: Binds to the Lac operon as an activator/promoter to enable transcription.
Glucose (Repressor): Reduces cAMP availability → prevents cAMP-CAP complex formation → prevents transcription.
Dual Requirement:
Full Lac operon transcription requires both the absence of glucose (to allow cAMP-CAP activation) AND the presence of lactose (to remove repressor inhibition).
Positive Autoregulation:
Translational products of the Lac operon transport more lactose into the cell, which further drives its own activation.
Lac Operon Regulation
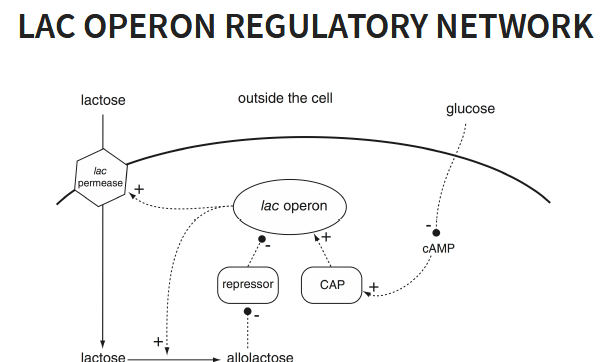
Lac Operon Regulation & Glucose Dependence
Dual Control Requirement: High-level transcription of the Lac operon requires both the absence of glucose and the presence of lactose.
Negative Inducible Regulation (Lactose Sensing):
Off State: A repressor protein remains bound to the Lac operon, preventing transcription.
On State: When present, lactose binds to the repressor, inducing a conformational change that causes it to detach from the operon and permit transcription.
Positive Autoregulation: Products of the Lac operon import additional lactose into the cell, further stimulating transcription.
Positive Repressible Regulation (Glucose Sensing):
CAP Activator: Catabolite Activator Protein (CAP) must form a complex with cAMP (cAMP-CAP) to bind the Lac operon and act as a promoter.
Glucose Suppression: Glucose lowers intracellular cAMP levels, preventing cAMP-CAP complex formation.
Result: Without the cAMP-CAP complex bound to the operon, transcription remains suppressed even if lactose is available.
Lac Operon Regulatory Network
Definition & Core Function: Microarrays are a mature transcriptomics technology featuring a grid of compartments containing cDNA (complementary DNA). They allow simultaneous measurement of thousands of mRNA expression levels.
Mechanism:
mRNA strands hybridize (preferentially bind) to their corresponding cDNA probes as a form of reverse transcription (mRNA→DNA).
Fluorescent tags attached to the samples allow expression levels to be quantified by measuring the fluorescence intensity of the cDNA-mRNA complex.
mRNA product can be amplified using PCR or qPCR prior to measurement.
Microarrays
Perturbation (Comparative): Evaluates the effect of different treatments or tissue responses across different sample types at the same time point.
Competitive Hybridization: Treatment and control samples are tagged with different fluorescent colors and run competitively on the same chip to determine expression direction relative to control.
Time Series: Measures continuous, sequential changes in gene expression within a sample over time.
Combined: Integrates both approaches (e.g., comparing time-series profiles across different treatments).
Data and Experiment types
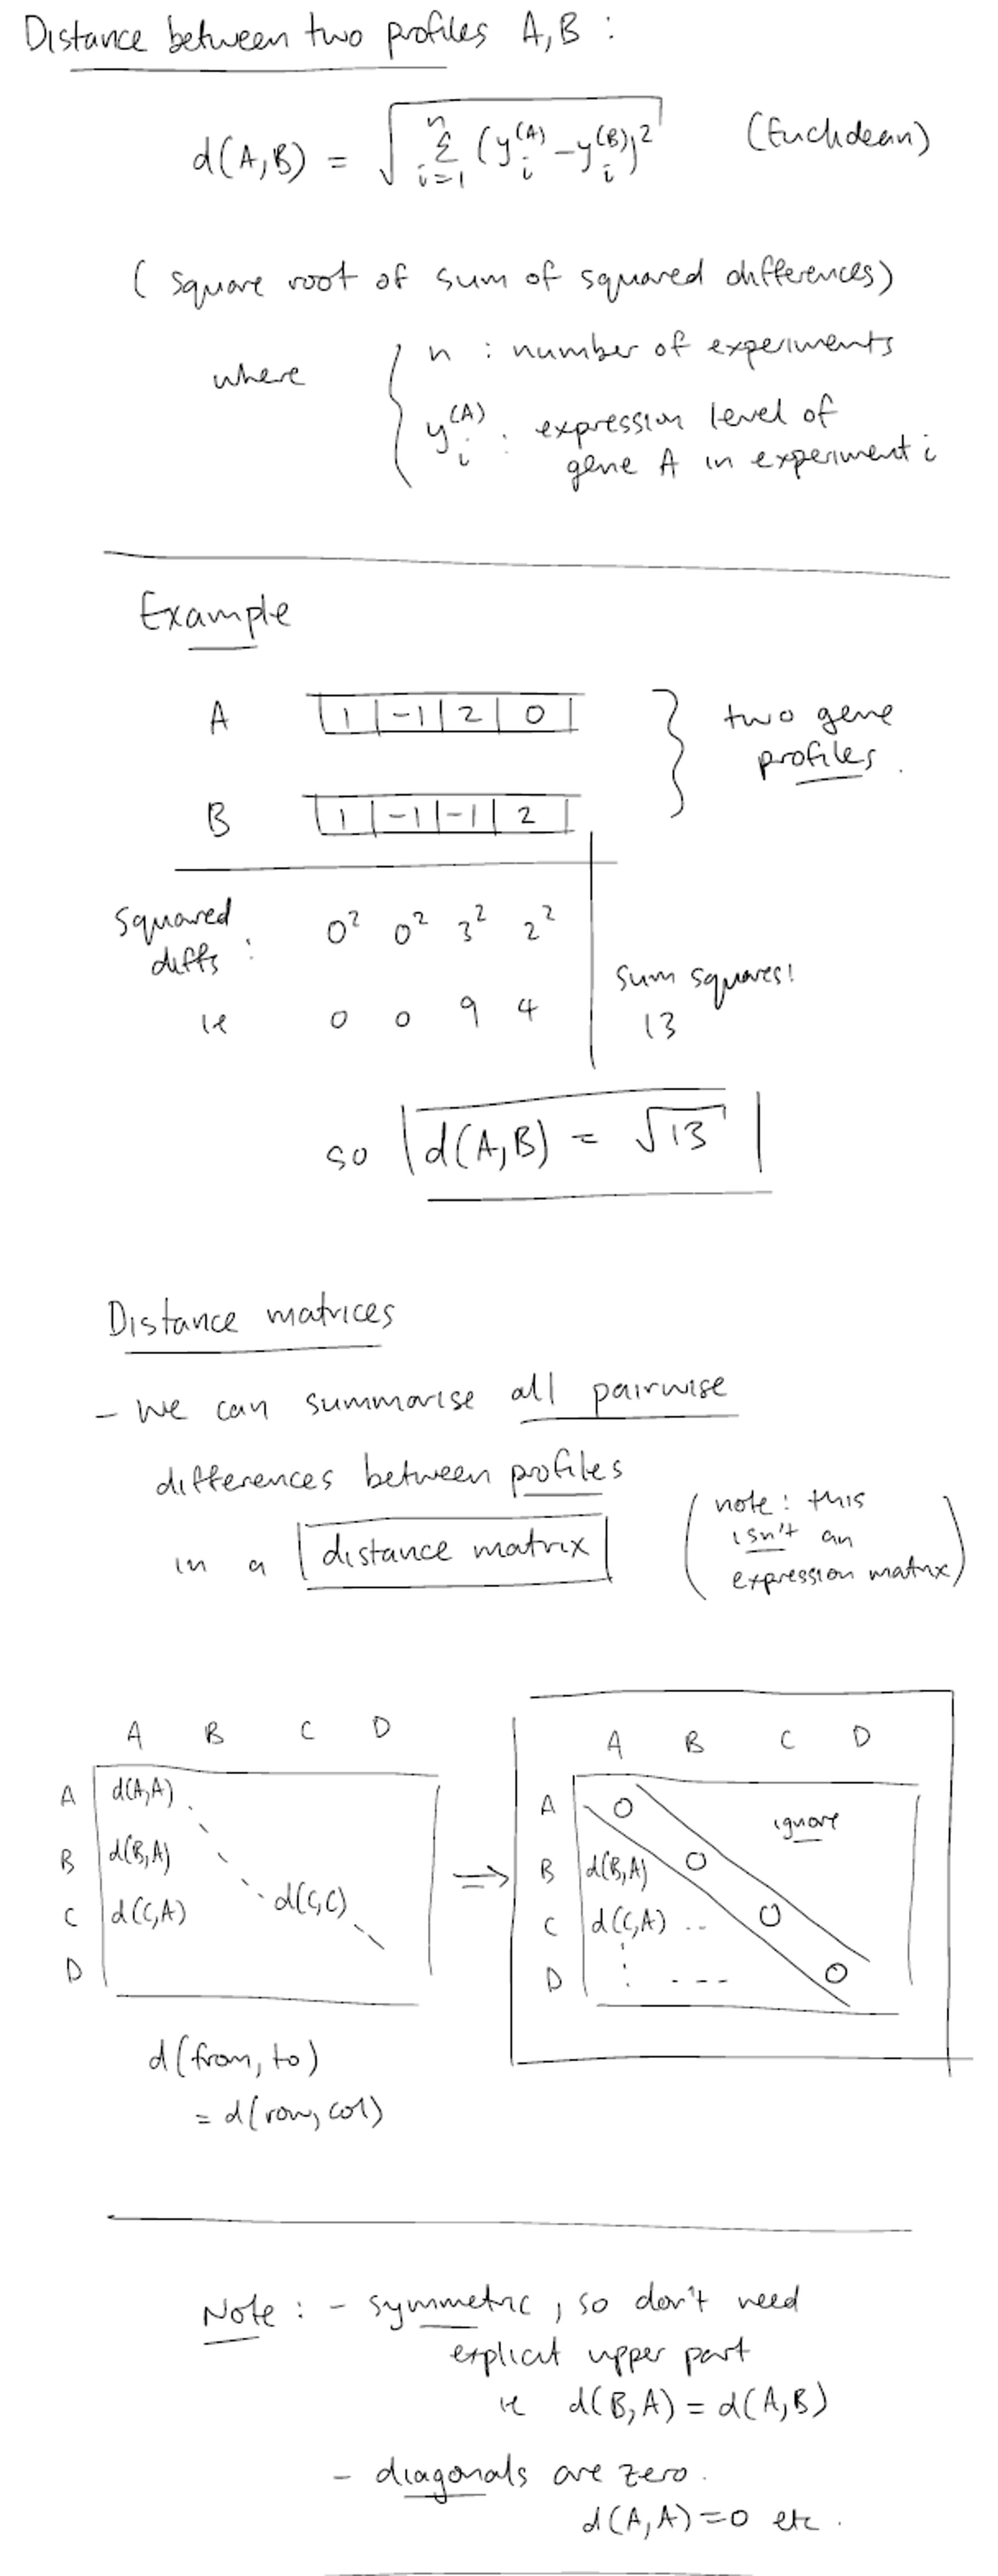
Core Concept: Groups genes based on the similarity of their expression responses to an intervention, identifying genes that are likely functionally related.
Similarity Measurement:
Evaluated numerically by calculating the "distance" between the expression profiles of two genes.
Identical expression profiles yield a distance of zero (d=0).
Shorter distances indicate stronger co-regulation or functional relationships.
Common Algorithms:
k-means Clustering: Partition-based grouping method.
Hierarchical Clustering: Tree-based (dendrogram) grouping method.
Clustering
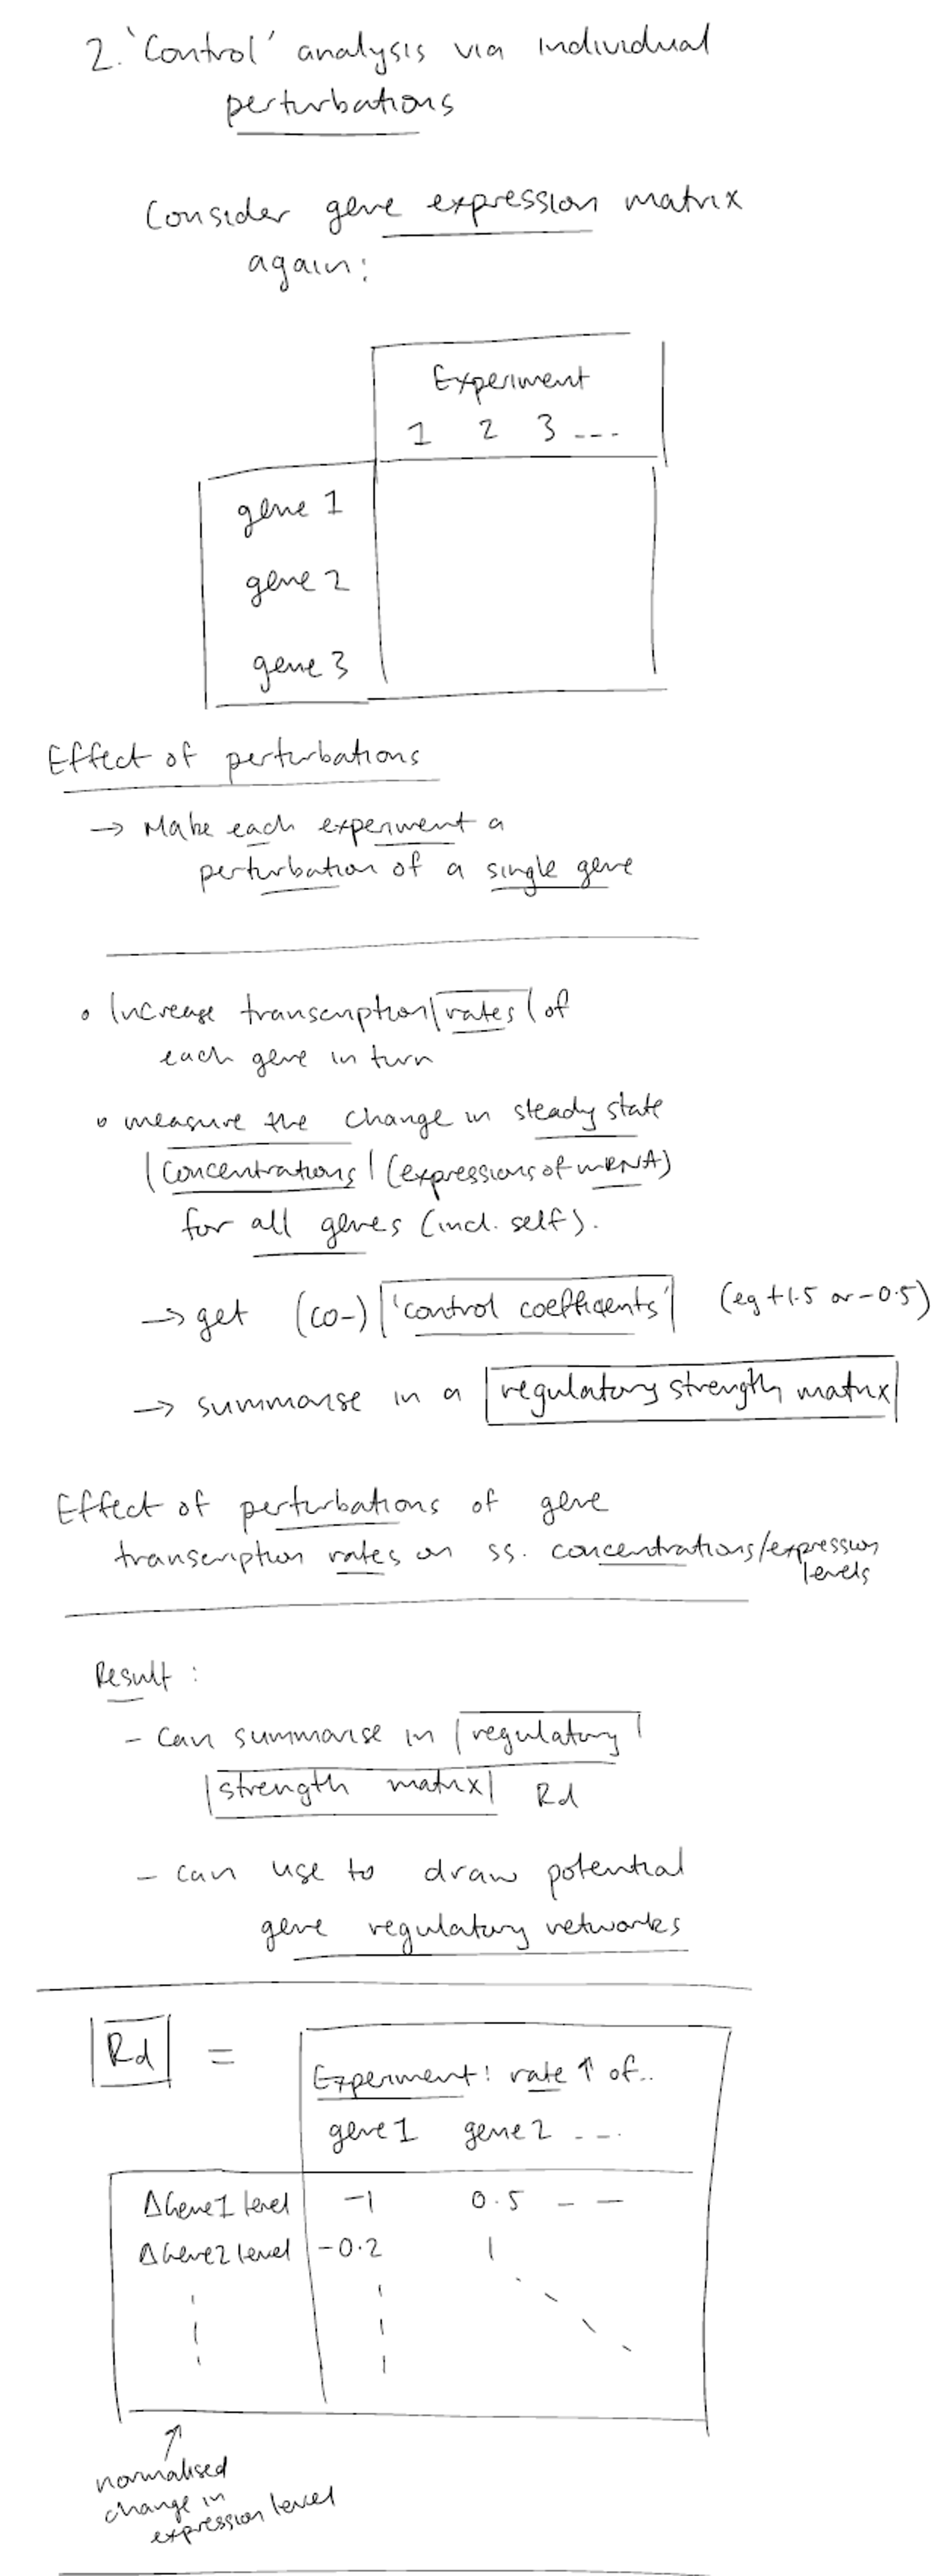
Core Concept: Evaluates regulatory networks by modifying (perturbing) the steady-state transcription rate of a single gene and tracking how other genes respond.
Output Formats: Results are mapped to either a network diagram or a regulatory strength matrix.
Regulatory Strength Matrix Structure:
Rows (Dependent Variables): Represent the gene expression levels of target genes responding to the change.
Columns (Independent Variables): Represent the specific gene that was perturbed (via an increase or decrease in transcription).
Control Analysis