ESS Unit 4 + 5
1/43
There's no tags or description
Looks like no tags are added yet.
Name | Mastery | Learn | Test | Matching | Spaced |
|---|
No study sessions yet.
44 Terms
leaching of soil nutrients is an example of
transfer of materials
which is a renewable resource?
fish in the sea
which is the best explanation of the advantage of contour-plowing?
plowing parallel with the contours prevents erosion of the soil.
which process reduces storages of soil nutrients?
heavy rainfall
what is the maximum sustainable yield of a crop equal to?
natural income
Which of the following most correctly represents characteristics of each type of soil below? Sandy soil / Clay soil
Poor nutrient-holding capacity / Good nutrient-holding capacity
which of the following ways might food systems be changed to meet the increased demand for food in the future?
more intensive techniques in the developing world.
What might the typical diet consist of in an LEDC?
Proteins from pulses____Carbohydrates from grains
from what macronutrient of food to we get the greatest source of calories?
fats
people eat at _________ trophic levels from aquatic food, leading to its _________ efficiency vs terrestrial
higher___lower

for a commercial food production system, which of the following are typical inputs?
II, III, + IV
Using the high inputs of labor but low technology, the rice padis of South-East Asia are good examples of:
intensive subsistence farming
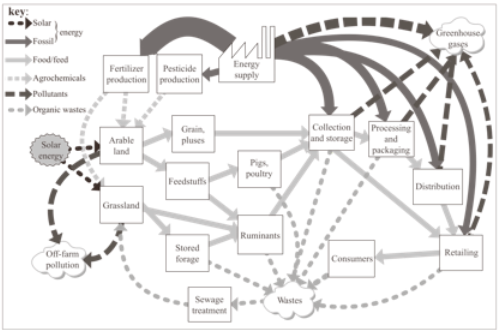
what type of food production system might the diagram indicate?
industrial farming
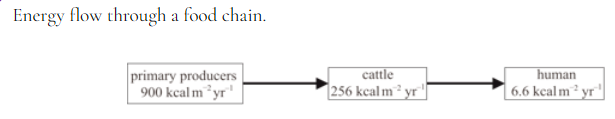
what is the percentage energy loss to humans from the initial input in the diagram above?
0.73%
the ocean current circulation system i.e., the “conveyor belt” is driven by
differences in temperature and salinity.
the percentage of the earth’s surface covered by oceans is about
70%
water’s ability to stick to itself is called ____, whereas its ability to stick to other things is known as ____
cohesion; adhesion
which of the following is most likely to lead to desertification of soil
irrigation
greywater recycling is the recycling of
only waste water from sinks, showers, and bathtubs
the amount of water present in the hydrosphere as fresh is approximately
3%
which of the following contains the greatest proportion of the world’s fresh water?
ice-caps and glaciers
Which of the following is most likely to lead to an overall increase in the Earth’s freshwater storages?
inc in evaporation rates from the oceans causing inc in precipitation
What proportion (by volume) of the Earth’s water is fresh?
2.6%
which of the following is most likely to lead to desertification?
eutrophication
people eat at _________ trophic levels from aquatic food systems, leading to its _________ efficiency (vs terrestrial)
higher; lower
municipal and industrial discharge pipes are examples of
point sources of pollution
what can happen when excess nitrates and sulfates enter into bodies of water?
eutrophication, decreased BOD, sunlight can be blocked.
High fecal coliform counts in water indicate
contamination by animal waste.
all of the following are examples of organic chemical pollutants except
detergents
One indirect method for determining the water quality of a lake would be to measure the ___ in multiple areas over time
BOD-5
What pollution management strategy below would likely be the most effective at making the fish farm more sustainable?
doubling the number of invertebrates
the greatest source of nitrogen and phosphorous entering our waterways occurs from
agriculture
eutrophication is most likely to occur in ____ bodies of water.
which is the correct order of stages in eutrophication?
enrichment of nutrients; algal bloom; BOD decreases; hypoxia
what is most likely to happen as a lake becomes eutrophic?
GPP increases; DO decreases; biodiversity decreases
What would be the effect of removing the algae from this fish farm?
Decrease of DO in the surrounding water.
the eventual fate of a eutrophic lake, whether through natural or human inputs, will eventually be
hydrosere succession
what is aquaculture?
the growing or raising of aquatic animals and plants for human consumption.

the most sustainable fishing practice in the diagram is
long line
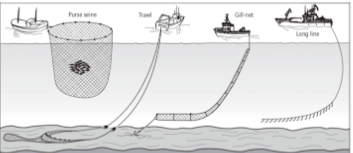
the fishing practice in the diagram above that will yield the most fish for the least fishing effort is
trawling
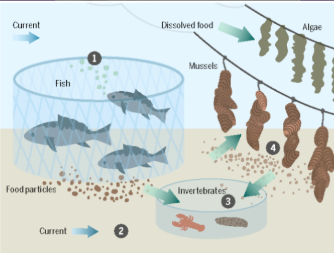
in which stage of the pictured fish farm are aqueous toxins most likely to be in the greatest concentration?
3

in which organism of the pictured fish farm are toxins most likely to enter the food chain?
algae
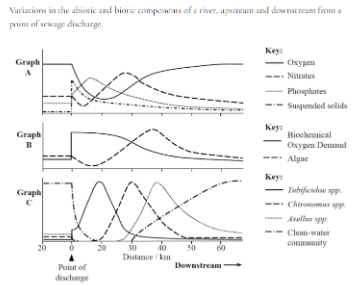
the downstream area from the point of discharge where the above river has the highest turbidity is
15-25 km

the downstream area from the point of discharge where the above river has the highest turbidity is
45-55 km