Chapter 12: Predation
1/99
There's no tags or description
Looks like no tags are added yet.
Name | Mastery | Learn | Test | Matching | Spaced | Call with Kai |
|---|
No analytics yet
Send a link to your students to track their progress
100 Terms
Interspecific Interaction
Between organisms of different species
Intraspecific Interactions
Interactions between organisms of the same species
2 Important aspects to interspecific interactions
There can be more than one type of interaction between two species.
Interactions between species can changeover ecological and evolutionary time

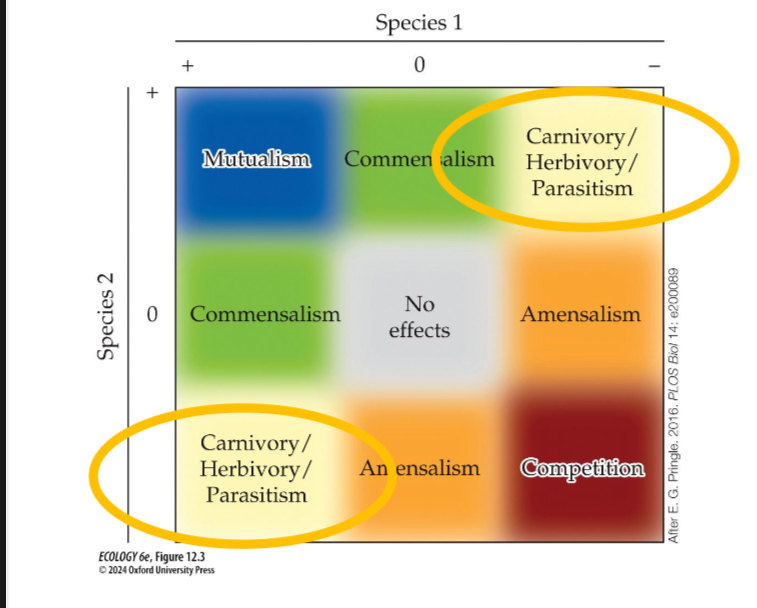
Species 1 (+), Species 2 (+) Interaction
Mutualism

Species 1 (+), Species 2 (0) Interaction
Commensalism
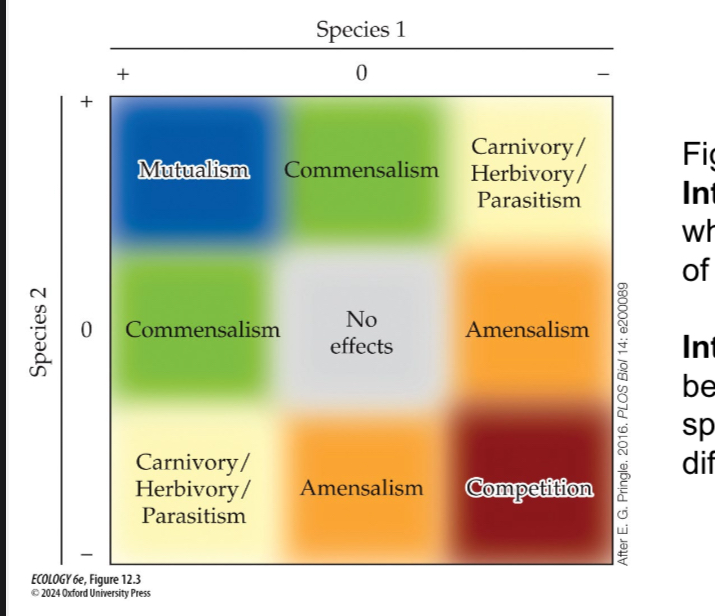
Species 1 (+), Species 2 (-) Interaction
Carnivore/ Herbivory/ Parasitism

Species 1 (0), Species 2 (0) Interaction
No effect
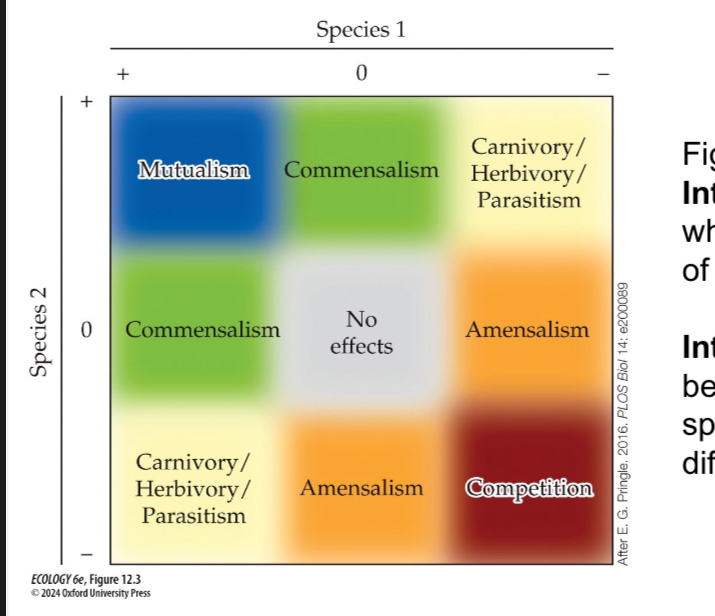
Species 1 (-), Species 2 (0) Interaction
Amensalism

Species 1 (-), Species 2 (-) Interaction
Competition

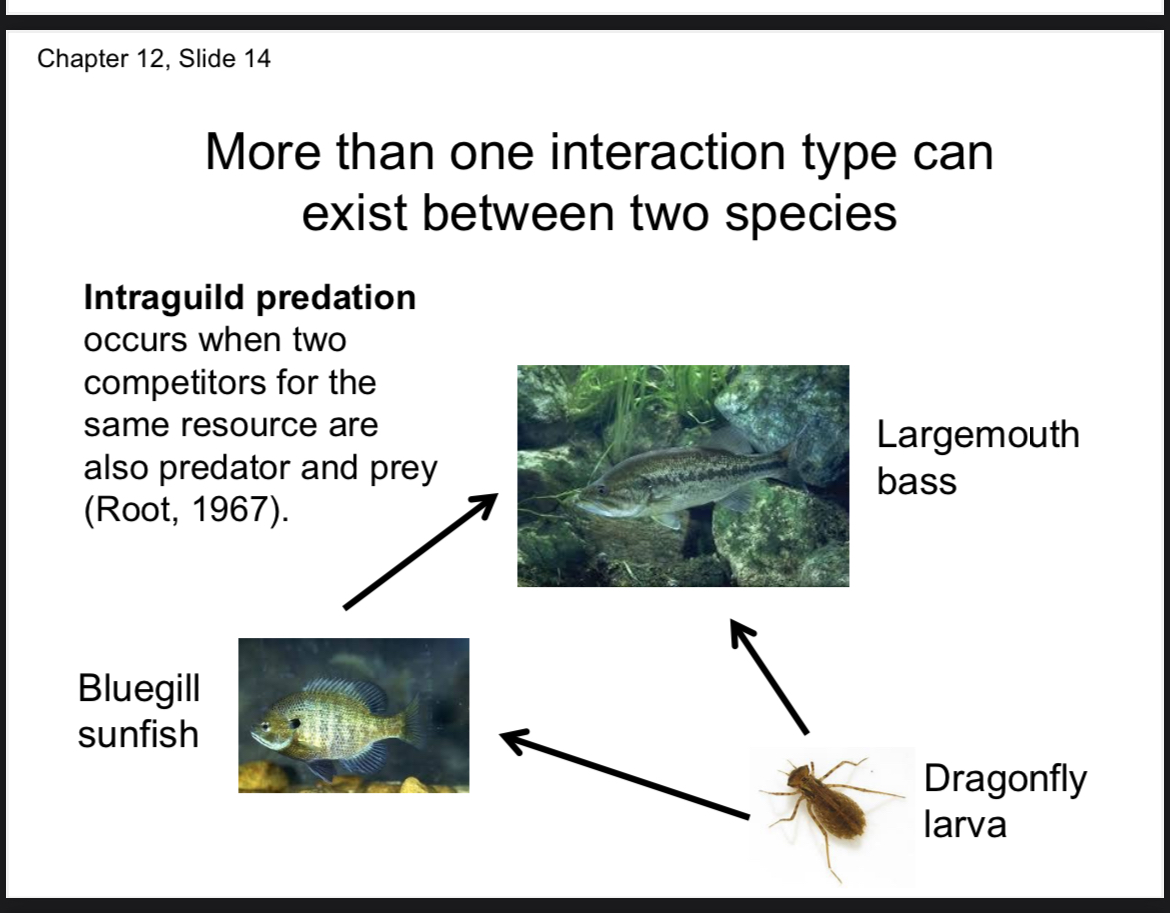
Intraguild Predation
When two competitors for the same resource are also predator and prey

Example of how more than one interaction type can exist between two species
Largemouth bass feed on bluegill
Largemouth bass feed on dragonfly larva
Bluegill sunfish feed on dragonfly larva
Largemouth bass and Bluegill sunfish do intraguild predation
What type of interaction is predation?
+/-
Trophic interaction
Trophic interaction
One organism consumes one or all parts of another organism
Three types of predation
Carnivory
Herbivory
Parasitism
Carnivory
One animal (the carnivore)
consumes another animal (the
prey), removing it from the prey
population.
Herbivory
An animal consumes all or part
of a plant, only sometimes
removing it from the population
Three types of Herbivory
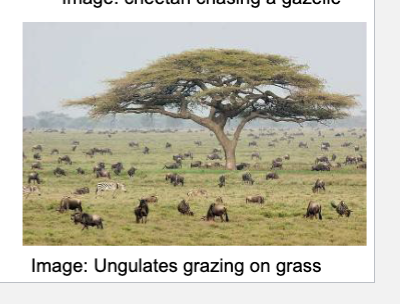
Grazers
Browsers
Parasitism
Grazers
Eat grasses and herbaceous vegetation
Browsers
Eat green parts of woody vegetation
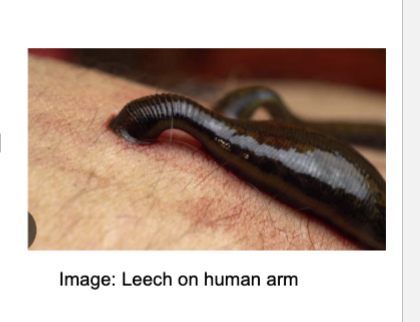
Parasitism
One animal (the parasite) consumes part of another animal (the host)
Host is negatively affected, but not often removed from population
Species that exhibit more than one type of predation
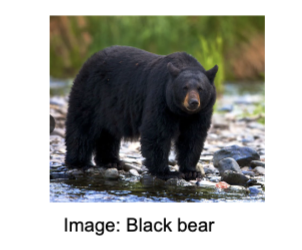
Omnivores- Both carnivores and herbivores (consume both plants and animals)
Examples- Dog, bears, humans
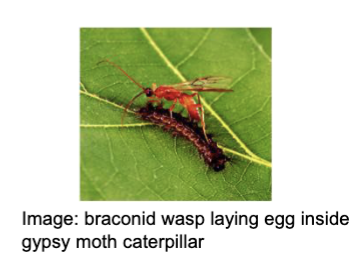
Parasitoids (special case of parasitism)
One animal (the parasitoid) consumes the living tissues of their host eventually killing them
Combines traits of parasites and carnivores
Omnivores
Omnivores- Both carnivores and herbivores (consume both plants and animals)
Examples- Dog, bears, humans
Parasitoids (special case of parasitism)
One animal (the parasitoid) consumes the living tissues of their host eventually killing them
Combines traits of parasites and carnivores
Optimal Foraging Theory
predicts that carnivores should
be generalists and herbivores should be specialists
Carnivore Encounter Rate (Time to find Prey) -Optimal Foraging Theory
Low encounter rate
Animals can run/ hide, so carnivores need to eat whatever they can catch.
Carnivore Handling Time (Consumption Time) -Optimal Foraging Theory
Low consumption time
All animals are a highly nutritious food, so carnivores can eat less regularly and spend less time digesting.
There is no need to focus on a
particular species
Carnivore Prediction- Optimal Foraging Theory
Generalist (broad diet)
Herbivore Encounter Rate (Rate at which Herbivore can find plants to eat) -Optimal Foraging Theory
High encounter rate
Plants are sessile (not
difficult to find)So herbivores
can afford to be selective
regarding what they eat
Herbivore Handling Time (Consumption Time) -Optimal Foraging Theory
High consumption time
Less nutritious plant
food requires herbivores to eat
more and spend more time
digestingSo they focus on
more nutritious plant parts and
species
Herbivore Prediction- Optimal Foraging Theory
Specialist (narrow diet)
Examples of how in real life carnivorous specialists and herbivorous generalists are not uncommon
Carnivorous Snail kites (Rostrhamus sociabilis) eat only aquatic apple snails
Herbivorous white tail deer (Odocoileus virginianus) eat most native plants in northeastern forests.
Two types of Predator Hunting Strategies
Cursorial Predators
Sit-and-wait Predators
Cursorial Predators
Predators that actively move and forage
throughout their habitat in search of prey.These include animals like sharks,
wolves, and hawks
Sit-and-wait Predators
Predators that remain in one place and
attack prey that move within striking
distance.These include animals like web-building
Crocodiles, spiders, snakes, and some
birds
Adaptations to help Predators Locate and Capture Prey (7)
Size
The larger the predator, the larger the potential number of prey.
Speed (rapid capture)
e.g.,cheetahs can run 50-80 mph for short distances
Superior vision, hearing, and smell
Senses are especially developed among cursorial predators.
Teeth, talons, and mandibles
All evolved to help capture, kill, and consume prey
Camouflage/ambush behavior
Common to many types of fish, reptiles, mammals and insects (preying mantis,
trap door spider, etc.
Poison to paralyze or kill prey
e.g., Rattle snake, box jellyfish, scorpion, black widow
Pack (cooperative) hunting
e.g., wolves, orcas, hyenas, lions, and humans
How size helps predators locate and capture prey
The larger the predator, the larger the potential number of prey.
Why are predators generally larger than their prey
Beyond a certain prey size, a
predator cannot successfully
subdue and consume the preyInjuries from prey fighting back
can be fatal.Cooperative hunters are
exception.
10 adaptation that exist to help species avoid becoming prey
Size (the larger the prey, the more difficult it is to kill)
Speed (rapid flight)
Superior vision, hearing, and smell
Physical defenses (shells and spines).
Fighting back (sometimes accompanied by warning sounds)
Camouflage (crypsis)
Chemical defense (Bad taste/smell, poison, and weapon)
Herding behavior (to confuse predator and/or limit probability of capture)
Finding refugia (places the predator can’t hunt and kill)
Batesian mimicry (faking a defense)
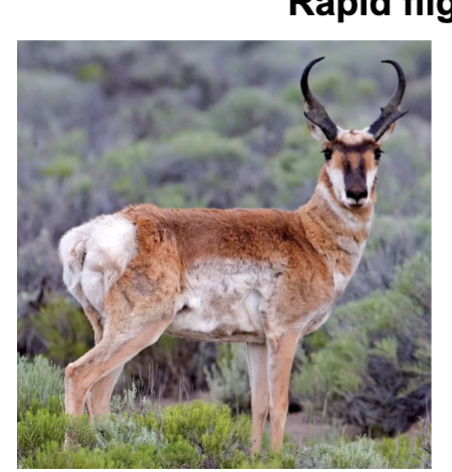
Explain Example Rapid Flight Antipredator strategy
The pronghorn (Antilocapra
americana), also known as
the American Antelope, is
the fastest-distance runner
of the animal kingdom,
maintaining speeds of nearly
35 miles per hour over
several miles to escape
predators (and 55 mph in
short distance sprints).
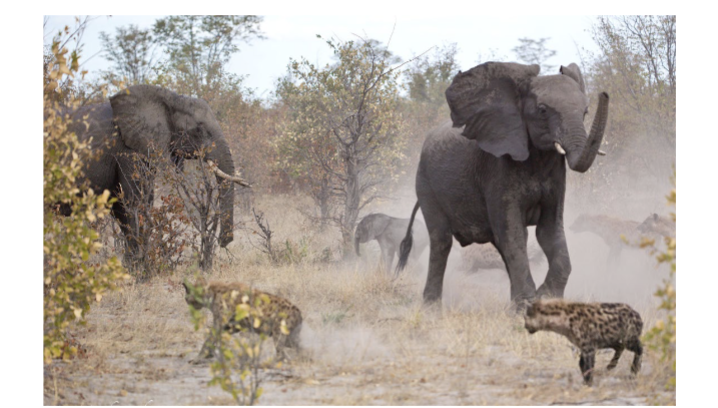
Example Large Size Antipredator Strategy
Image of African Elephants (Loxodonta Africana) defending against pack of hunting Hyenas.
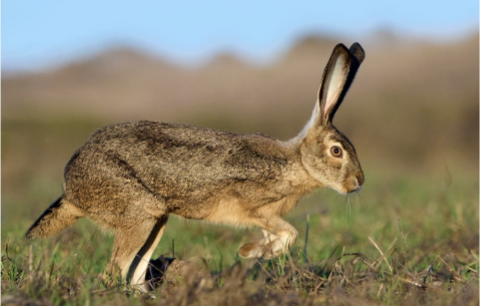
Example: Antipredator strategies
Heightened senses to detect predators
The black tailed
jackrabbit (Lepus
californicus) has
exceptional hearing
capable of detecting
high frequency
sounds miles away.
This helps them
detect and avoid
predators.
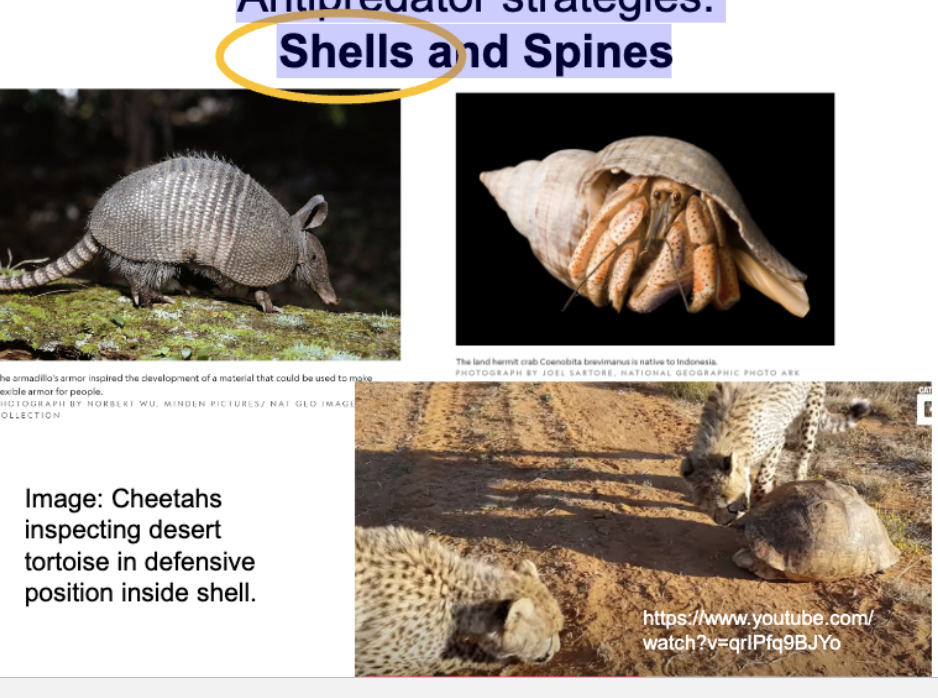
Example: Antipredator strategies:
Shells and Spines
Tortoise
Armadillo
Hedgehog (Spines)
Example: Antipredator strategies- Fighting Back and Warning Sounds
North Pacific Rattlesnake
Example: Antipredator strategies- Herding Behavior
Anchovies cooperate,
forming large, dense
schools near the
ocean surface to
confuse and avoid
predators.A large school of 10-
100 million fish was
spotted off the coast
of California.Starlings Murmuration defense
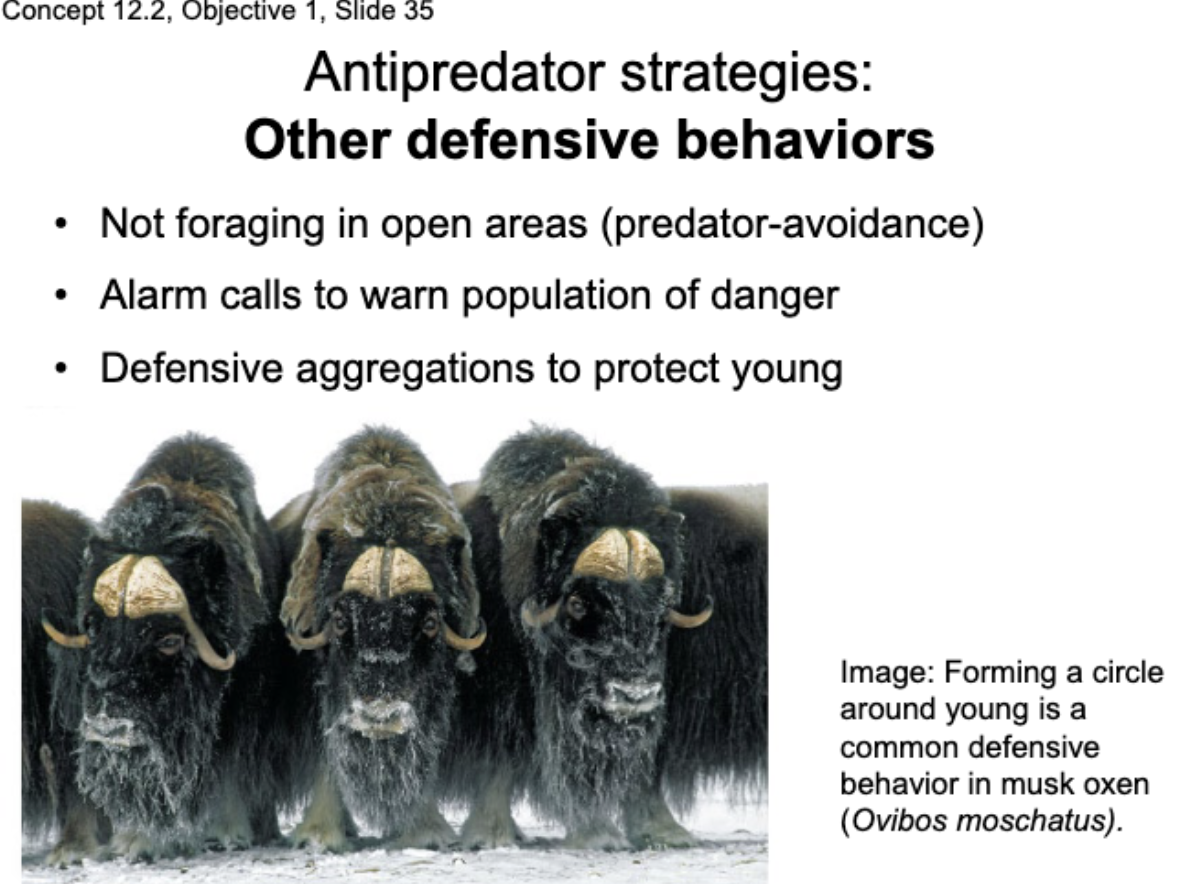
Example: Antipredator strategies- Other Defensive Behaviors (3)
Not foraging in open areas (predator-avoidance)
Alarm calls to warn populations
Defensive aggregations to protect young
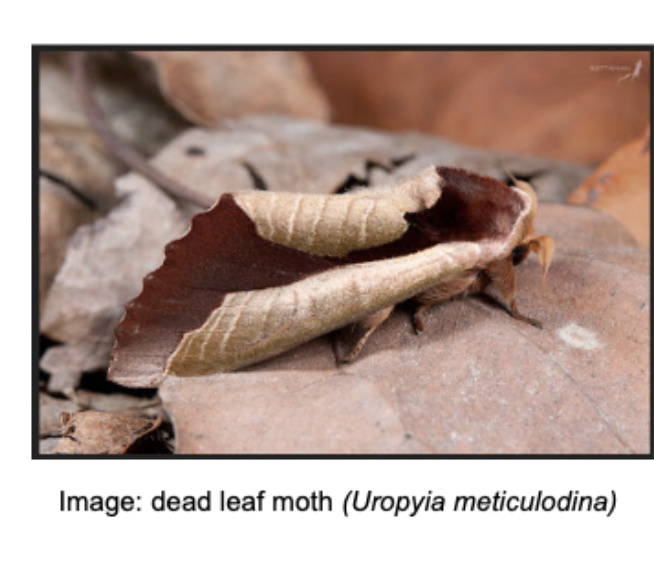
Crypsis Antipredator Strategies
Colors and shape of prey
match color, texture of bark,
twigs, or leaves.Organisms mistaken for
inedible objects by would-be
predators.Behaviors of cryptic
organisms must correspond
to desired appearances.
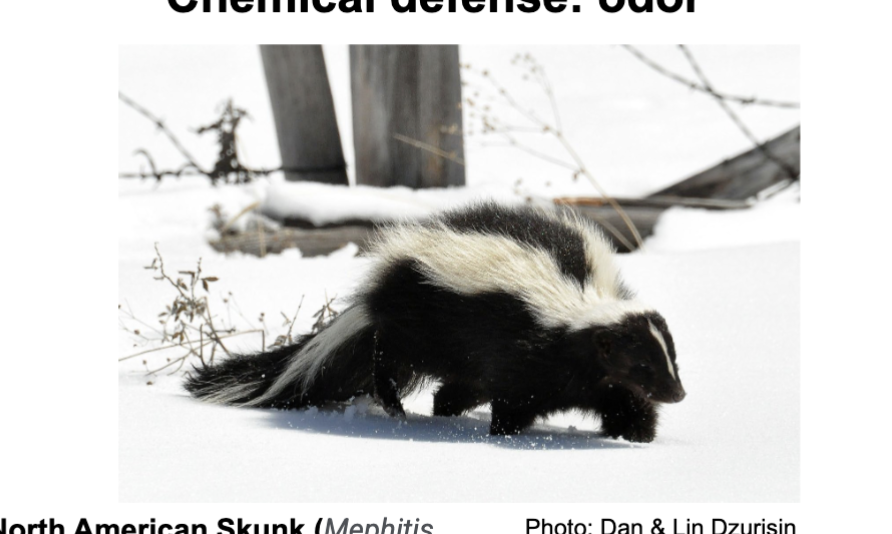
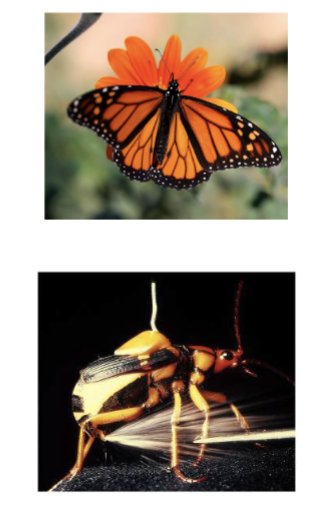
Example: Antipredator strategies- Chemical Defense (odor, bad taste, as weapon)
North American Skunk (Mephitis mephitis) (odor)
musk-filled scent glands
used to ward off predators
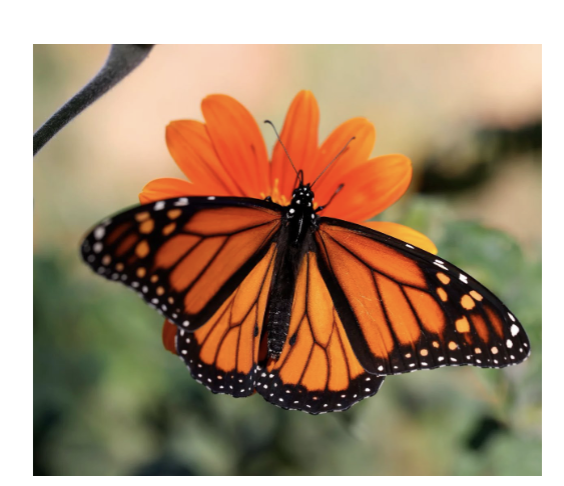
Monarch butterfly (bad taste)
larvae extract chemicals that are toxic (bad taste) to birds and other predators from milkweed plants.
Bombadier Beetle (As weapon)
sprays explosive mix of chemicals (hydrogen peroxide + enzymes at
potential predators
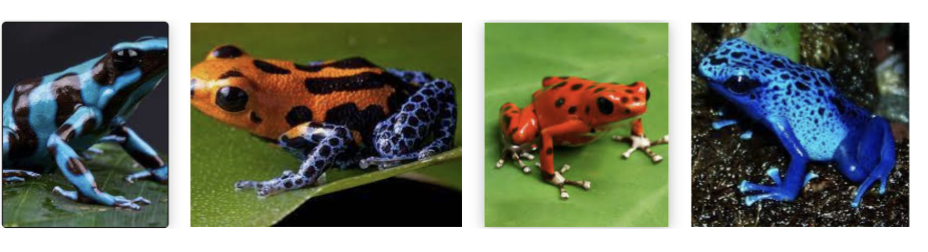
Example: Antipredator strategies- Warning Coloration
Unpalatable and poisonous animals often warn potential predators with aposematic coloration.
Colors are bright, causing organism to stand out in natural environment (opposite of camouflage!)
Predators learn to avoid such animals after unpleasant experiences.
Certain aposematic colorations occur so widely that predators may have
evolved innate aversions.
Explain why more prey aren’t unpalatable?
Chemical defenses may be difficult to evolve.
Some noxious animals rely on consuming
host plants and/or animals for their supply of
defensive chemicals.Not all food plants contain such chemicals.
Animals utilizing such chemicals must
evolve their own means to avoid toxic
effects.
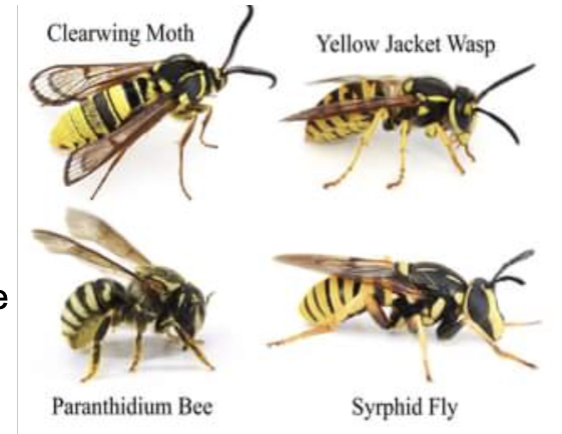
Example: Antipredator strategies- Batesian Mimicry (BIG FAKE)
Certain palatable species
mimic poisonous and
unpalatable species to fool
predators.Experimental studies have
demonstrated benefits to the
mimic in avoiding predators
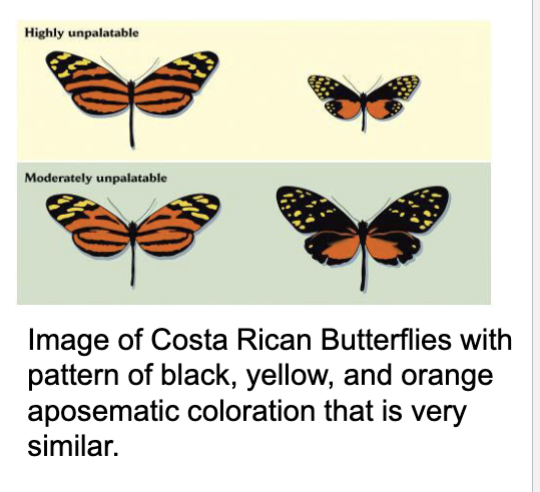
Müllerian Mimicry- MUTUAL (through convergent evolution)
Müllerian mimicry occurs among similarly unpalatable species that come to resemble one another through convergent evolution.
Many species may be involved; each species is both model and mimic (they all have the same real defense, and similar aposematic coloration).
Process is efficient because learning by predator with any model benefits all other members of the mimicry complex.
Tend to find aposematic color patterns widespread within region.
Müllerian Mimicry vs Batesian Mimicry
Müllerian Mimicry (MUTUAL)
Two or more harmful or unpalatable species evolve to resemble each other.
This benefits all species involved because predators learn to avoid the shared warning signals more quickly.
Example: Different species of toxic butterflies (e.g., Heliconius butterflies) evolving similar color patterns.
Batesian Mimicry (BIG FAKE)
A harmless species evolves to resemble a harmful or toxic species.
The mimic gains protection by looking like a dangerous species, but this can break down if too many mimics exist and predators stop associating the warning signal with danger.
Example: The non-venomous king snake mimicking the venomous coral snake.
Batesian = "Big Fake" → A harmless species fakes being dangerous.
Müllerian = "Mutual" → Multiple harmful species share the same warning signals.
Think of Batesian as a con artist (a harmless species pretending to be dangerous), while Müllerian is like a safety team wearing the same uniform (all actually dangerous).
Explain how for most prey defense mechanisms, there is a predator adapted to overcome the defense and its costs - Ex toxins
Example of Evolution of tolerance to toxins
The garter snake Thamnophis sirtalis has adapted to eat toxic newts Tarichia granulosa.
Newts contain the potent neurotoxin, tetrodotoxin
But there can be costs to extreme adaptations
After swallowing a toxic newt, the garter snake may not move for up to 7 hours, making it vulnerable to predation and heat stress.
4 types of herbivore defenses plants have
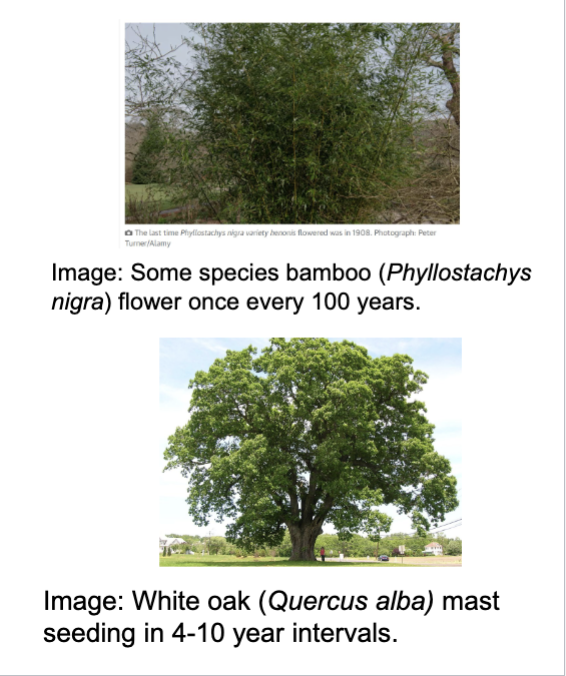
Mast seedlings
Structural defenses
Compensation
Secondary Compounds
Components of Mast Seedling Plant herbivore defense
Occurs when seeds are produced infrequently in very large numbers.
Periodicity of mast seeding can range from every 2 years to 100 years, depending on species.
Mast seeding overwhelms herbivores by satiating them with large numbers of seeds.
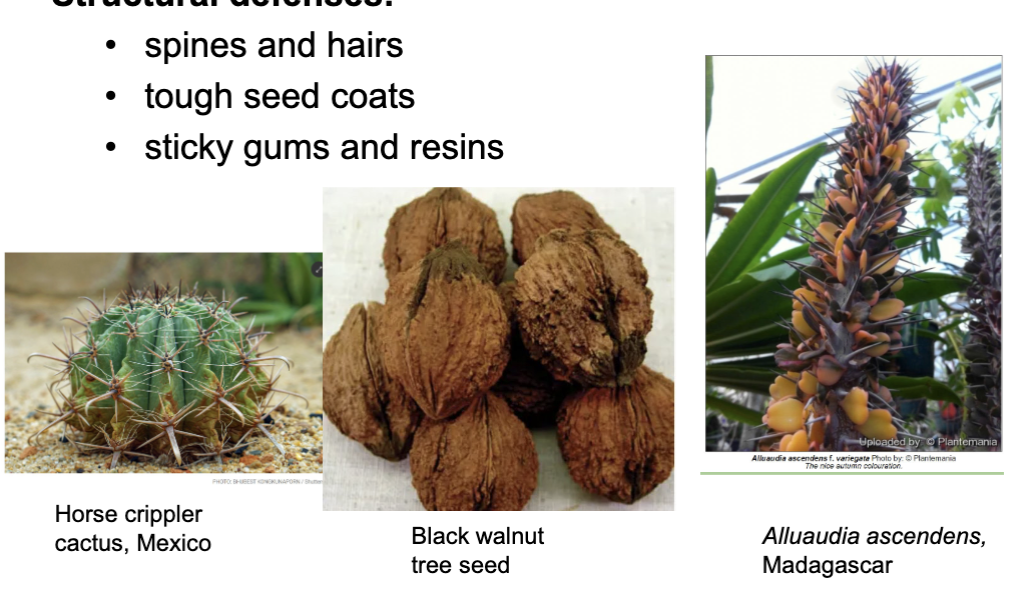
Components of structural defenses Plant herbivore defense
spines and hairs
tough seed coats
sticky gums and resins
Components of compensation Plant herbivore defense
occurs when removal of plant tissue by herbivores stimulates more rapid growth, allowing plant to tolerate effects of herbivory.
Full compensation—no net loss of plant tissue.
Over-compensation – grazed plants produce more biomass and offspring than ungrazed plants.
For any plant, if too much tissue is removed, or there are not enough resources for growth, compensation cannot occur.
Components of secondary compounds Plant herbivore defense
Are produced by plants to make them less digestible (lower energy content), unpalatable, or even poisonous.
Tannins produced by oak, eucalyptus, pine trees, and other plants interfere with the digestion of proteins.
Nitrogen compounds (lignin, alkaloids, nonprotein amino acids, cyanogenic glycosides)
Terpenoids (essential oils, latex, plant resins)
Phenolics (simple phenols
Two types of compensation herbivore defenses
Full compensation
Over- Compensation
Full compensation
No net loss of plant tissue
Over-compensation
Grazed plants produce more biomass and offspring than ungrazed plants
Tannins secondary compounds for herbivore defense
produced by oak, eucalyptus, pine trees, and other plants interfere with the digestion of proteins.
Nitrogen Compounds secondary compounds for herbivore defense
(lignin, alkaloids, nonprotein amino acids, cyanogenic glycosides)
Terpenoids secondary compounds for herbivore defense
(essential oils, latex, plant resins)
Phenolics secondary compounds for herbivore defense
Simple Phenols
How do chemical defenses differ
Can be constitutive chemical defenses or induced chemical defenses
Constitutive chemical defenses
These defenses are always present and offer continuous protection against herbivory
They are maintained at high levels in the plant at all times.are
Induced chemical defenses
This type of chemical defenses increase dramatically only following an attack
This chemical defense suggests chemical are costly to maintain (existence of an evolutionary trade off)
4 Phytochemicals and plant secondary metabolites that humans use, Plants produce hundreds of compounds we use as medicines and drugs
Coffee (Coffea arabica) and tea (Camellia sinensis) are
sources of caffeine (stimulants).Willow (Salix) bark is a source of aspirin (acetylsalicylic acid).
Foxglove (Digitalis purpurea) is source of digitalis (treatment
for cardiac problems).Pacific yew (Taxus brevifolia) is source of taxol (important
cancer treatment).

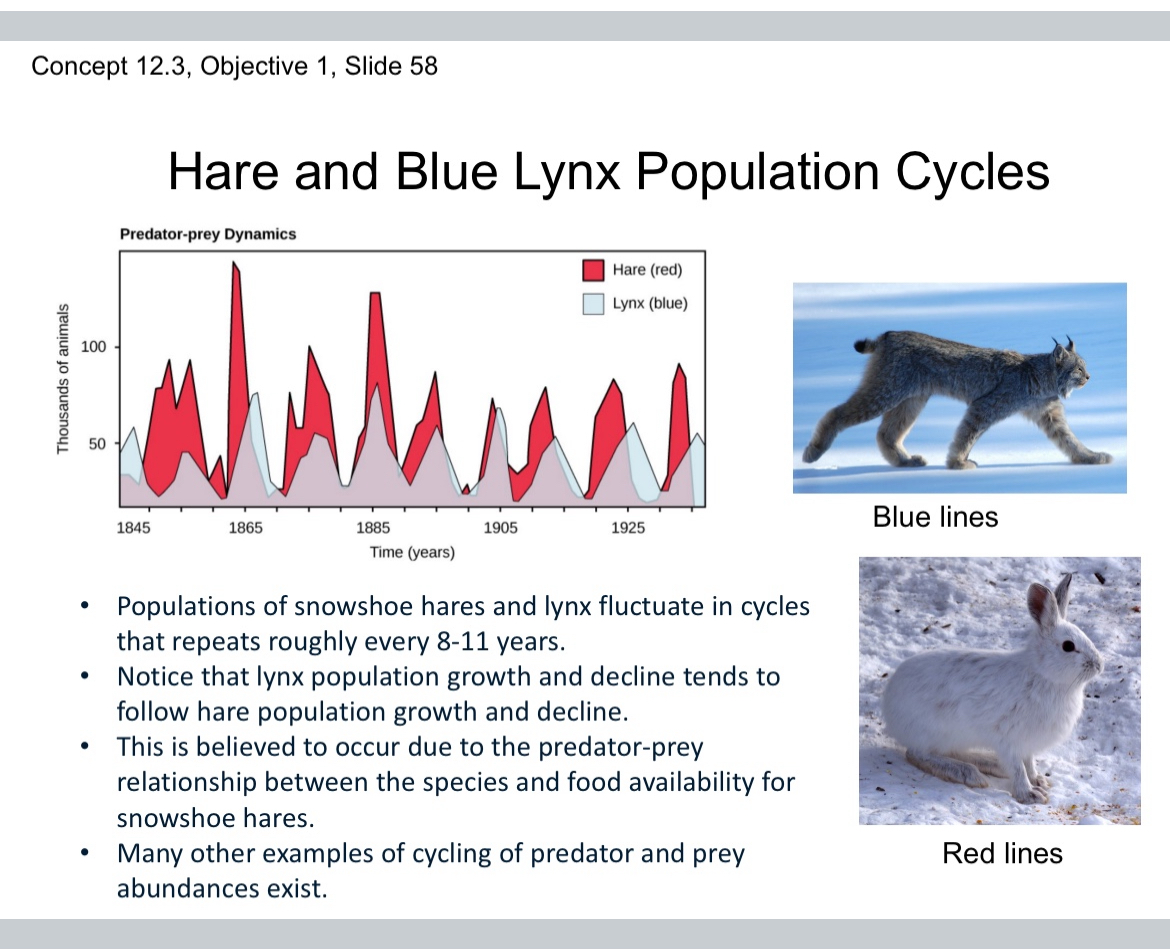
Cc Hare and Lynx Population Cycles
Populations of snowshoe hares and lynx fluctuate in cycles that repeats roughly every 8-11 years.
Notice that lynx population growth and decline tends to follow hare population growth and decline.
This is believed to occur due to the predator-prey relationship between the species and food availability for snowshoe hares.
Many other examples of cycling of predator and prey abundances exist
Explain the The Lotka and Volterra predator–prey model helps explain predator-prey population cycles
Two equations describe the rate of change in population size at time t for the prey and predator
Important: Notice that both dN/dt and dP/dt are a function of the abundance of both prey (N) and predators (P)
Rate of change in prey population (N)
(dN/dt)= rN-aNP
Rate of change in predator populations (P)
(dp/dt)= baNP-mP
CC Components of the Prey Equation
(dN/dt)= rN-aNP
N= number of prey
P= Number of predators
r= exponential growth rate of prey
a= attack rate of predator
(dN/dt)= rate of change in prey population at time t
Note: When predators are absent (P=0), prey abundance (N) grows exponentially at rate (r).
Note: When predators are present (P>0), the rate that prey are killed depends on how frequently the two encounter each other (NP), and the predator attack rate (a)
CC Predator equation and its components
(dp/dt)= baNP-mp
N = number of prey
P = number of predators
m = predator mortality rate
a = predator attack rate
b = Efficiency with which each killed prey is converted into predator offspring
(dp/dt)= rate of change in predator population at time t
When prey are present (N>0), predators are added to the population according to the rate at which prey are killed (aNP) and the efficiency (b) with which prey are converted into predators.
When prey are absent (N=0), predator abundance declines exponentially at mortality rate m
Prey’s zero growth isocline
the condition in which the population size of the prey (N) does not change in size for a given number of predators (P).
Prey abundance (N) does not change when dN/dt = 0, which occurs when predator abundance P = r/a
Prey Isocline formula
P= r/a
Predator abundance
Predator’s zero growth isocline
is the condition in which the population size of the predator (P) does not change in size for a given number of prey (N)
Predator abundance (P) does not change when dP/dt = 0, which occurs when N = m/ba. (Pred isocline)
Predator’s isocline formula
N = m/ba
m= predator mortality rate
b= Efficiency with which each killed prey is converted into predator offspring
a= predator attack rates
Steps for solving for the prey isocline
Set dN/dt= 0:
rN- aPN = 0
Use distributive law to isolate N:
N(r-aP) = 0
To determine the value of P where N(r-aP) = 0 regardless of N, we set r-aP = 0 and solve for P:
r-aP = 0
r = aP
P=r/a
so dN/dt =0 when P = r/a
Steps to solve for predator isocline
Set dP/dt =0:
baPN-mP = 0
Use distributive law to isolate P:
P(baN-m) = 0
To determine the value of N where P(baN-m) = 0
regardless of P, we set baN-m = 0 and solve for N:
baN-m = 0
baN = m
N = m/ba
dP/dt =0 when N = m/ba
What do the two zero growth isoclines tell us about the relationship between predator and prey abundance?
Prey’s zero growth isocline: (P =r/a)
P > r/a prey abundance decreases (predation is high)
P = r/a prey abundance does not change
P < r/a prey abundance increases (predation is low)
Predator’s zero growth isocline: (N=m/ba)
N > m/ba predator abundance increases (food is plentiful)
N = m/ba predator abundance does not change
N < m/ba predator abundance decreases (food is scarce)
Results of prey’s zero growth isocline
Prey’s zero growth isocline: (P =r/a)
P > r/a prey abundance decreases (predation is high)
P = r/a prey abundance does not change
P < r/a prey abundance increases (predation is low)
Results of predator’s zero growth isocline
Predator’s zero growth isocline: (N=m/ba)
N > m/ba predator abundance increases (food is plentiful)
N = m/ba predator abundance does not change
N < m/ba predator abundance decreases (food is scarce)
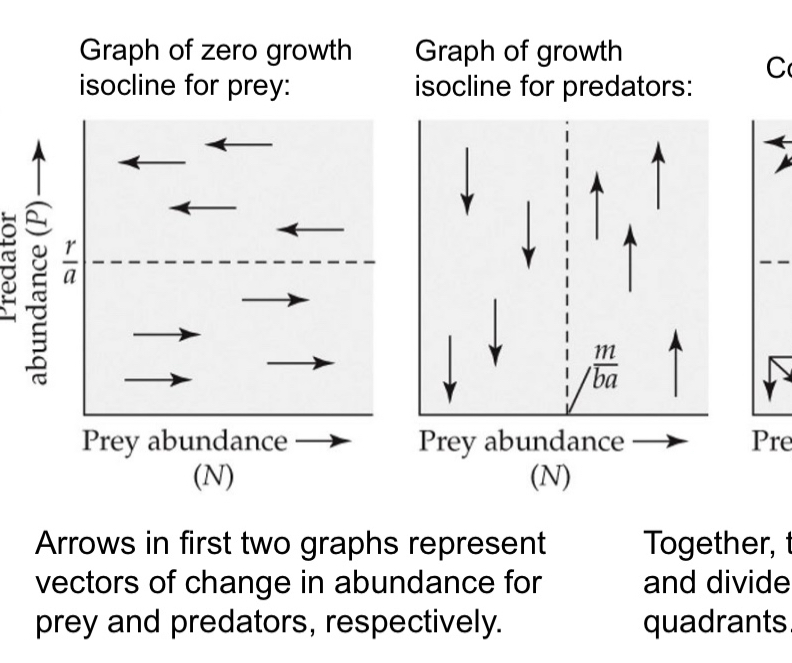
Plotting the isoclines on a graph shows that predator and prey populations tend to cycle: Graph of zero growth isocline for prey
Arrows in first two graphs represent vectors of change in abundance for prey and predators, respectively
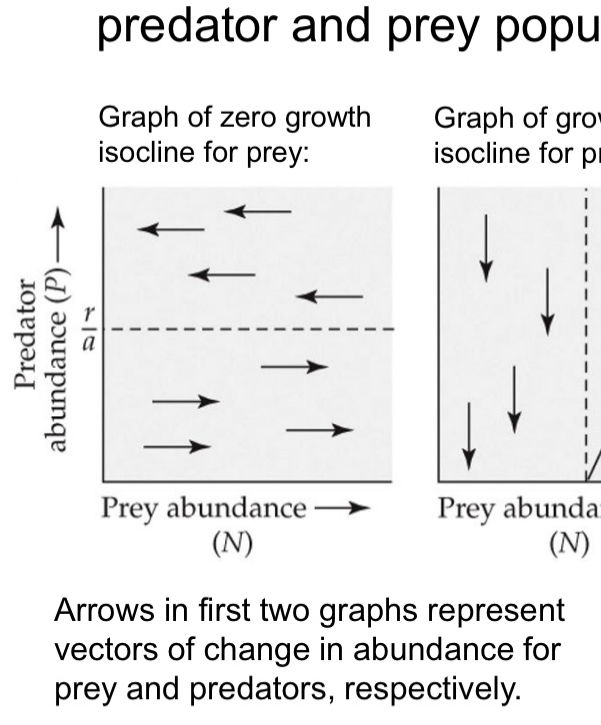
Plotting the isoclines on a graph shows that predator and prey populations tend to cycle: Graph of growth isocline for predators
Arrows in first two graphs represent vectors of change in abundance for prey and predators, respectively
Plotting the isoclines on a graph shows that predator and prey populations tend to cycle: combined graphs
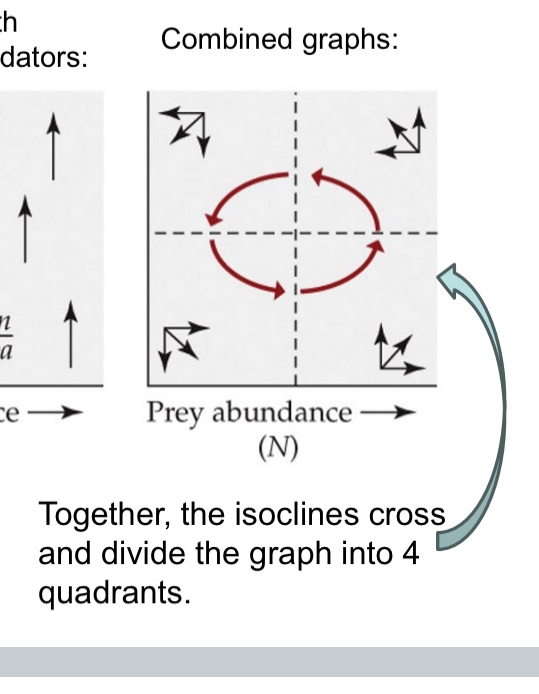
What does the Lotka-Volterra model show?
predator and prey populations have an inherent tendency to cycle.
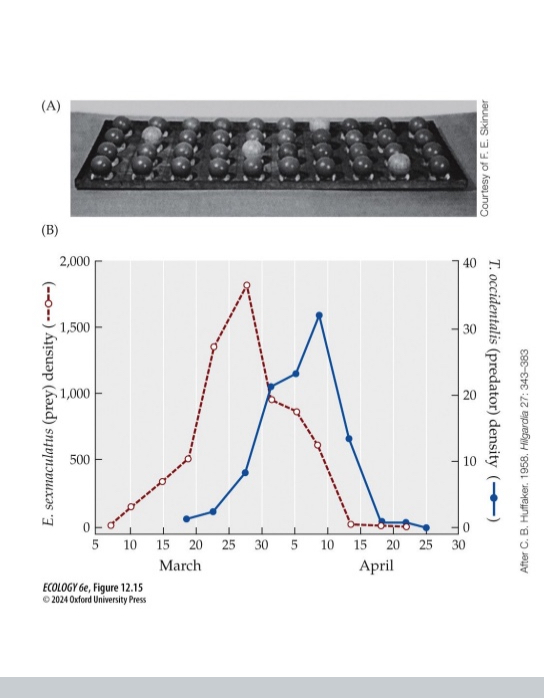
Explain how Controlled experiments showed predators often drive prey to extinction (only one cycle observed)
Huffaker (1958) allowed Herbivorous six-spotted mite (Eotetranychus sexmaculatus) to feed on oranges in a metapopulation structure.
When the predatory mite (Typhlodromus occidentalis) was introduced, it drove the herbivorous mite (prey) to extinction, causing its own extinction as well.
A single predator-prey population cycle followed by collapse is also observed in many natural ecosystems
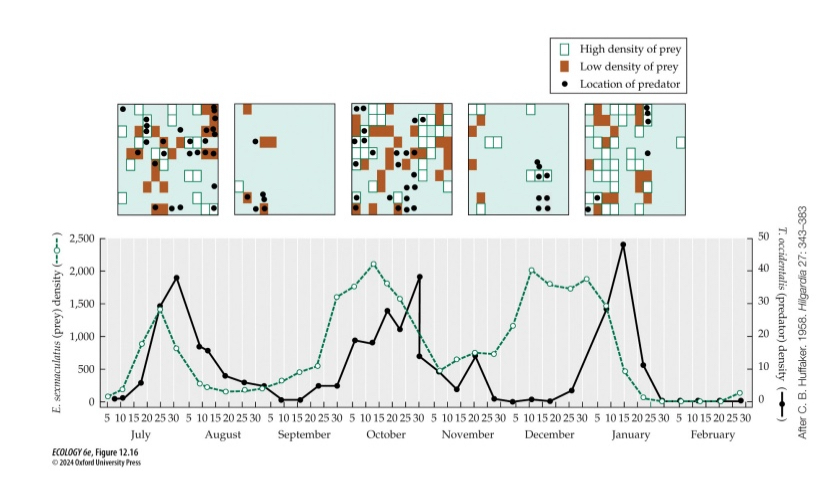
Explain how Subsequent experiments showed the importance of prey dispersal and refuges for maintaining cycling.
modified the spatial design of the experiment to favor dispersal of herbivorous mite (E. sexmaculatus) and impede dispersal of the predatory mite (T.occidentalis).
Under the modified spatial structure, the predator and prey populations demonstrated the population cycling often observed in natural systems.
3 mechanisms that could prevent predators from driving prey to extinction, facilitating maintenance of predator-prey population cycles.
Habitat complexity providing spatial refuges for prey (places where predators cannot hunt).
Limited predator dispersal.
Predators switching to a second source of prey when densities of the first source are low (prey switching)
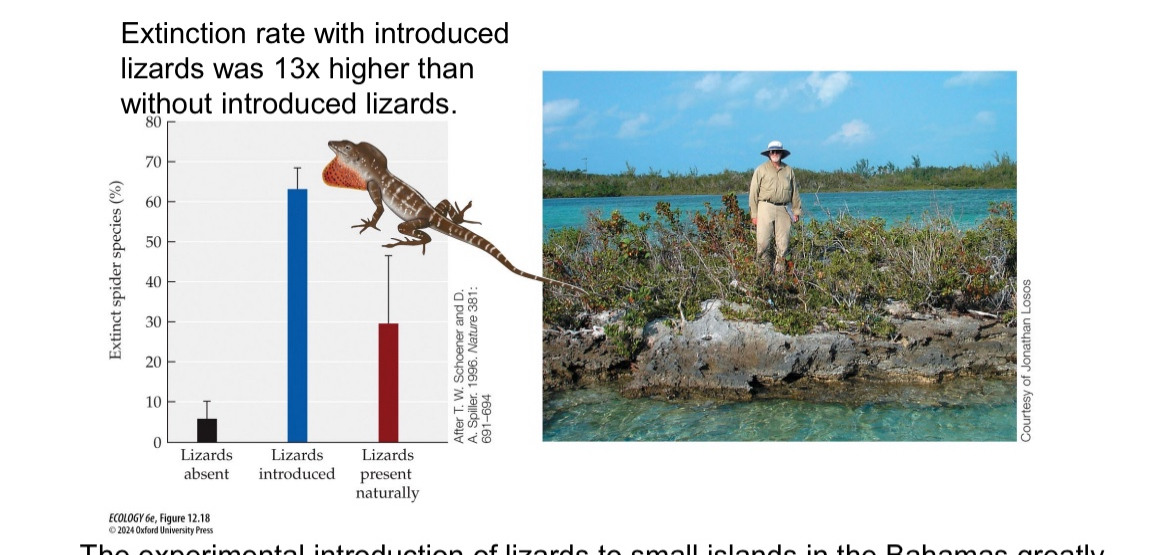
Explain how Lizard predators can drive their spider prey populations to extinction
Extinction rate with introduced lizards was 13x higher than without introduced lizards
The experimental introduction of lizards to small islands in the Bahamas greatly increased the rate at which their spider prey became extinct. Photograph shows Thomas Schoener on one of the study islands
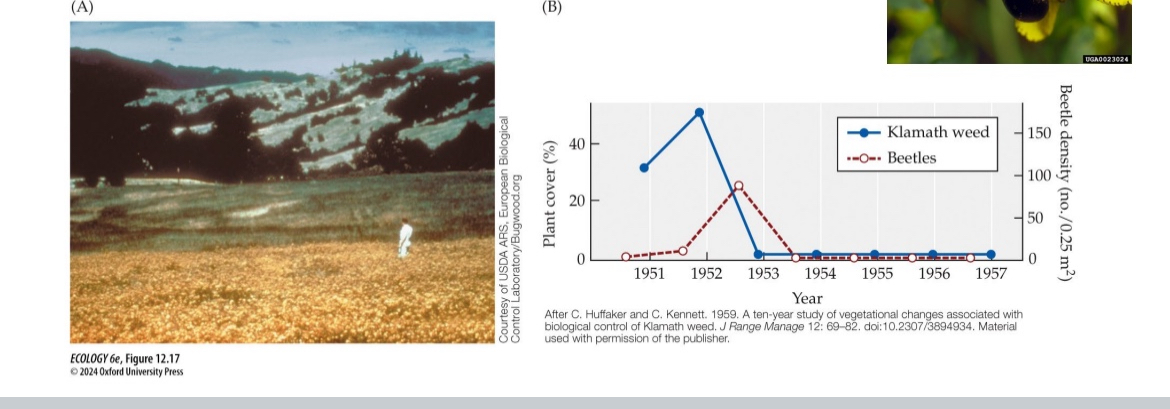
Explain how herbivores can have dramatic effects on plant species that they consume.
Invasive and poisonous Klamath weed (Hypericum perforatum) once covered 4 million acres of Rangeland.
The introduced specialized herbivorous beetle Chrysolina Quadrrigemina decimated the Klamath weed population in only a few years.
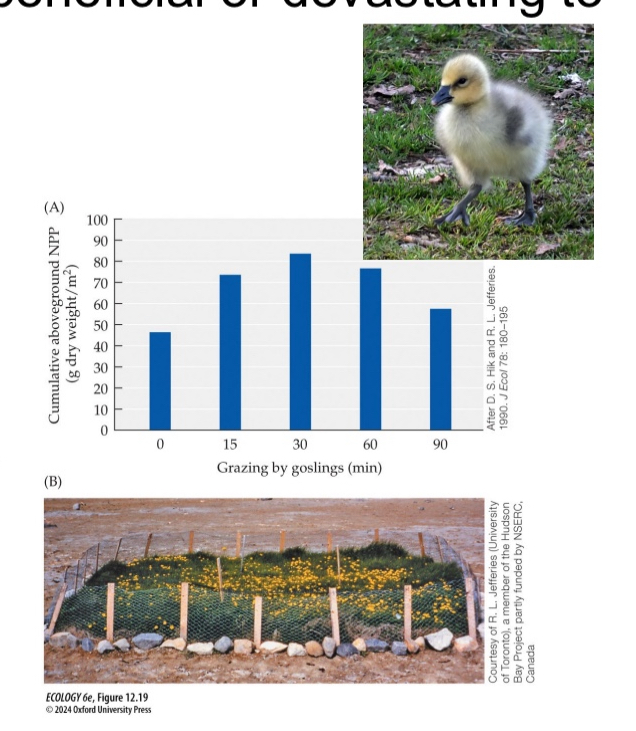
Explain how Snow geese can be beneficial or devastating to marsh community.
When lightly grazed by snow goose goslings (15- to 90-minute episode), salt marsh plants increase their subsequent cumulative production of new biomass compared with no grazing, because of the nitrogen added by the defecating geese.
Heavy grazing by high densities of geese converted salt marshes to mudflats (the small remnant of marsh was protected from goslings, while the surrounding mudflat was not
dN/dt
Rate of change in prey population (N) at t time
dP/dt
Rate of change in predator population (P) at t time
N variable meaning
number of prey
P variable meaning
Number of predators
r variable meaning
exponential growth rate of prey
a variable meaning
predator attack rate
m variable meaning
predator mortality (death) rate
b variable meaning
Efficiency with which each killed prey is converted into predator offspring