URBAN 520 Exam 2
1/13
There's no tags or description
Looks like no tags are added yet.
Name | Mastery | Learn | Test | Matching | Spaced |
|---|
No study sessions yet.
14 Terms
What is sampling error?
A measure of how well a sample approximates the characteristics of a population is called sampling error.
It is the difference between the values of the sampling statistics and the population parameter.
The higher the sampling error, the less precision you have in sampling, and the more difficult it will be to make the case that your findings from the sample reflect what you expected to find in the population
What is a representative sample?
The sample should match as closely as possible the characteristics of the population
A high degree of generalizability is an important quality of good research
“Big” sample size does not equate with “representative” sample size
What is a hypothesis?
A hypothesis is an educated guess
Its most important role is to reflect the general problem statement or question that was the motivation for asking the research question in the first place.
The research question will guide the creation of a hypothesis
While a hypothesis usually describes a population, hypothesis testing deals with a sample, and then the results are generalized to the larger population
What is a null hypothesis?
It is a statement that represents “no relationship” or “difference” between the variables of interest.
It acts as both a starting point and a benchmark against which the actual outcomes of a study can be measured.
Example: Light color has no effect on plant growth.
What is a research or alternative hypothesis?
A research hypothesis is usually a definite statement that a ‘relationship’ or ‘difference’ exists between variables of interest.
There can be more than one research hypothesis for any null hypothesis.
Example: Light color affects plant growth.
What is a non-directional research hypothesis or two-tailed test?
A non-directional research hypothesis (a two-tailed test) reflects a difference between groups, but the direction of the difference is not specified.
Ha : x̄1 ≠ x̄2
What is a directional research hypothesis or a one-tailed test?
A directional research hypothesis (one-tailed test) reflects a difference between groups, and the direction of the difference is specified.
Ha : x̄1 > x̄2
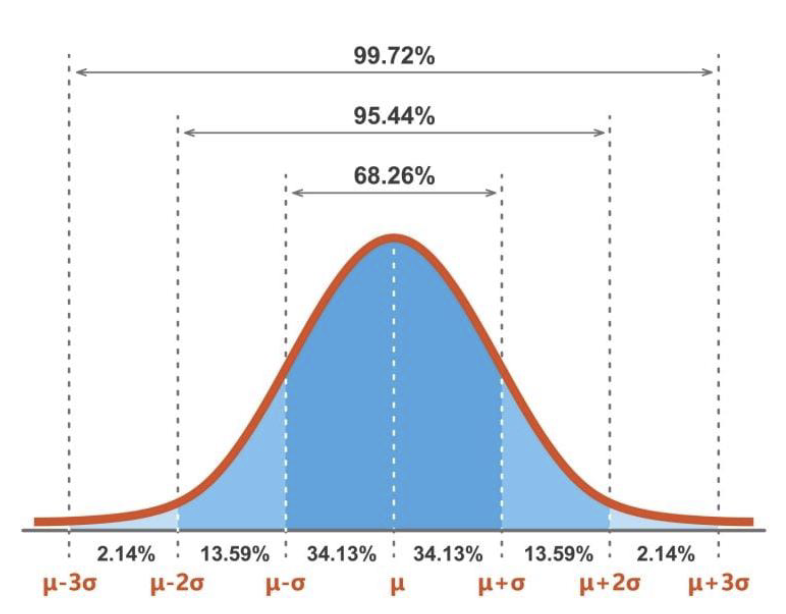
What is the normal curve?
The normal curve is the visual presentation of a distribution of scores that has three characteristics:
Mean, median, and mode are equal to one another
The normal curve is perfectly symmetrical about the mean
The tails of the normal curve are asymptotic
For any distribution of scores (regardless of the values of mean and standard deviation), if scores are distributed normally, almost 100% of the scores will fit between -3 and +3 standard deviations from the mean.
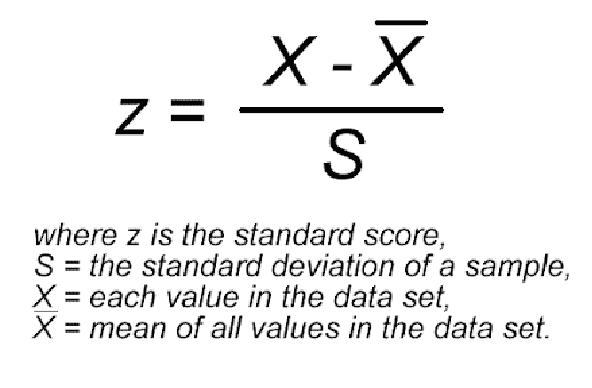
What is a z-score?
The z-score is the result of dividing the amount that a raw score differs from the mean of the sample scores by the standard deviation.
The scores below the mean have negative z-scores.
The scores above the mean have positive z-scores.
Calculating probability using z-scores