255 Final
1/73
Earn XP
Description and Tags
Name | Mastery | Learn | Test | Matching | Spaced | Call with Kai |
|---|
No analytics yet
Send a link to your students to track their progress
74 Terms
Geographical Information Systems
A mix of hardware and software used to generate data, integrate data, perform spatial analysis, and produce a variety of maps and visualization outputs
Geographic Information Science
Spans the theoretical and conceptual basis of GIS software, methods, data acquisition, spatial representation, data quality, semantics, spatial cognition, geovisualization, geovisual analytics, etc.
Cartography
The study and practice of making and using maps
Examples of typical geographic questions that drive spatial analysis/map use
What areas are at risk of natural disasters such as floods or wildfires?
Where should emergency services be strategically located for optimal coverage?
How are land use patterns changing over time?
What are the transportation routes with the least congestion?
Process of mapping
Data Collections
Map Constructions
Map Use
Map Reading
Map Analysis
Map Interpretation
—> CCURAI
MROT
Measure - aspects of geographic phenomena and processes
Represent - these measurements, usually in the form of a computer database, to emphasize spatial themes, entities, and relationships
Operate - upon these representations to produce more measurements and to discover new relationships by integrating disparate sources
Transform - these representations to conform to other frameworks of entities and relationships
Entity definition
The way we conceptualize phenomena and features (point/line/area). It links to real space because we use features in real life to conceptualize data into GIS.
Data models
The way we represent phenomena and features
Field models
When we want to measure continuous phenomena
Object models
When we want to measure discrete phenomena
Topology
Stores the relationships of one spatial element with respect to another.
Topography
Describes the precise physical location and shape of geographic objects.
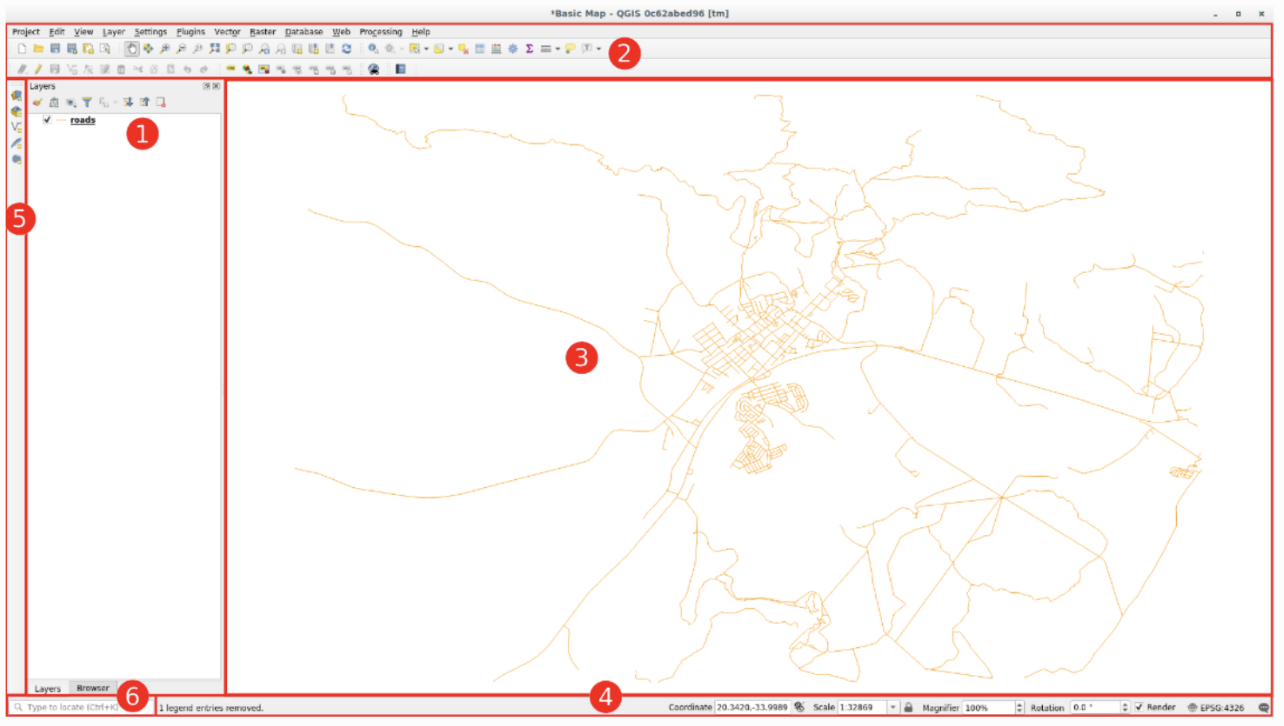
The elements of a GIS interface
Layers list/browser panel
Toolbars
Map canvas
Status bar
Side toolbar
Locator bar
Transformational view of GIScience
A Transformational view of GIScience involves every single component of GIS science. As we pursue the various steps in GIS work, we make choices that have implications for the ultimate representation of geographic reality and the phenomena in it. Some of these choices and implications we are aware of, some of them may be less obvious! The transformational view of GIScience refers to our understanding that the choices, strategies, methods and actions we choose in each phase of GIS work - all the potential to incrementally modify the way in which we record, represent, analyze, communicate and interpret spatial phenomena in the real world. It can mean building stuff, creating, performing spatial analysis and more. It is not just looking at GIS as it is a tool or technology, but instead how we may reshape, perceive and analyze the world around us.
Key differences between vector and raster data models
In Vector, Geographic entities are stored as nodes, line segments and polygons.
In Raster, real-world data is expressed as a matrix of cells or pixels and given a value.
Vector data model pros
Useful for unique geographic phenomena with complex geometry and is efficient in that it does not represent empty space. Easy to edit as well, good with topology.
Vector data model cons
Can not represent continuous surface phenomena like elevation or temperature. Spatial analysis may take lots of time and Data can take up lots of storage for big data sets.
Raster data model pros
Raster structures store each cell in the matrix regardless of whether it is a feature or simply 'empty' space. Often used for continuous spatial phenomena and is efficient, good with interpolation.
Raster data model cons
Resolution may not be precise enough to represent complex geometries or small-scale features accurately like river bends. Hard to edit big data sets and high-resolution data takes up lots of storage. Hard to maintain topological relationship with raster data.
Raster resolution
Refers to the linear dimension of each cell and the relative density of cells per unit area (The scale of data and size of cell). The characterizations of features will either be more accurate (more cells) or less accurate (fewer cells) as we change the resolution of the vector.
Raster reclassification
The process of reassigning one or more values in a raster dataset to new output values.
High-pass filters
Filters that are used to isolate edges (or water bodies or crop extents) or linear features (like mountains).
Low-pass filters
Filters that are used to smooth out exceptional features, to eliminate pockets of unusual values, like a small town in the midst of thousands of acres of corn.
Boolean logic
Means that variables, expressions, and operations are binary, meaning they can only have one of two possible values: true or false.
Is used to perform spatial analysis. It allows users to combine multiple spatial data layers and apply logical operations to determine the spatial relationships between features.
Boolean operations
Form a critical part of vector overlay. The expressions AND, OR, NOT, XOR allow us to build many different query combinations for 2 or more layers.
The combined area is A.OR.B (union)
The area of overlap of A and B (A.AND.B) (intersection)
The area remaining when you trim/crop A using the portion of B that overlaps it (A.NOT.B) (CLIP)
The area remaining when you trim/crop B using the portion of A that overlaps it (B.NOT.A) (CLIP)
The area of overlap of A and B and C (A.AND.B.AND.C) (intersection)
Intersection
When you compare two data sets, and show on the map, only the parts where they overlap.
Union
When two data set layers are combined to make a larger data set.
Interpolation
When we take two values and make an assumption of the values in between. So if we have a data set of elevation, we can do some math and interpolate the slope for that area. Aspect can also be interpreted this way, after we have access to the slope, to see how the land falls and can assume what direction it faces based on the slope.
Vector GRID and Vector TIN
Data models used to represent continuous surfaces.
Vector GRID
Where the surface is represented as of squares/rectangular cells.
Vector TIN
Where sample points often located at peaks, pits, along ridges and valleys and the world is divided into triangles.
Advantages of GRID
Regular and uniform structure. Easy interpolation operations nad efficient raster operations.
Disadvantages of GRID
Fixed Resolution and Loss of details. Can have big data sets too.
Advantages of TIN
Flexible Structure and a very efficient way of representing topography.
Disadvantages of TIN
Sampling can be varied depending on the ruggedness of the surface, can have complex data structure. Limited capability for certain analysis tools and GIS tools with TIN datasets.
Vector TIN
= Triangulated irregular network
Data models used to represent continuous surfaces. Where the world is divided into triangles, and variation is approximated by a plane within each triangle. TIN is composed of nodes, lines and triangular faces.
Data set can come from LiDAR photogrammetry, or existing digital elevation models.
The data then is triangulated by connecting nearby sample points with edges to form triangles.
Result is TIN.
Visibility analysis
Identifies areas that can or cannot be seen from a single (or a set of) viewpoint(s).
Viewshed (or visible area)
The portions of terrain that you can see from a certain vantage point. Identifies the cells in an input raster that can be seen from one or more observation locations. Each cell in the output raster receives a value that indicates how many observer points can be seen from each location.
Intellectual hierarchy
Refers to the organization and categorization of spatial data and information according to various levels of detail, abstraction, and complexity. For example, ranking your map features in order of their importance.
Visual hierarchy
Visual hierarchy refers to the arrangement or presentation of visual elements in a design in a way that establishes a clear order of importance and guides the viewer's attention.
Why did it take a while for data quality/error to become subfields of GIScience?
It took a while because GIScinece was a new field and it took a while to start it up and use it, for there to then be a subfield on its quality/errors.
Wasn’t a place to look at quality/errors before while they were starting it.
Researchers were too busy building systems, software and algorithms to worry about quality/error
What is data quality in GIScience? What does it refer to?
Refers to the relative accuracy and precision of a particular GIS database.
Accuracy
When the data is similar to the accepted value for that measurement
Eg. close to standard pressure
Precision
When all the data you collect is close in value, or you can measure the data down to a certain number of decimal places
Eg. 15.99999cm
Difference between accuracy and precision
You can have a very precise value, but it might not be accurate to what you are recording.
Eg. measuring the elevation, you could get 5.6789m, but the elevation of that area is 8m
Types of error in GIS
Positional Error
Attribute Error
Conceptual Error
Positional error
This applies to both horizontal and vertical positions.
Accuracy and precision are a function of the scale at which a map (paper or digital) was created.
The mapping standards employed by the United States Geological Survey (USGS) specify that:
“Requirements for meeting horizontal accuracy as 90% of all measurable points must be within 1/30th of an inch for maps at a scale of 1:20,000 or larger, and 1/50th of an inch for maps at scales smaller than 1:20,000.
Attribute error
The non-spatial data linked to location may also be inaccurate or imprecise.
Inaccuracies may result from many mistakes.
Non-spatial data can also vary greatly in precision.
Precise attribute information describes phenomena in great detail.
Eg. a precise description of a person living at a particular address might include gender, age, income, occupation, level of education, etc.
An imprecise description might include just income, or just gender.
Conceptual error
GIS depend upon the abstraction and classification of real-world phenomena.
The user determines what amount of information is used and how it is classified into appropriate categories. (discretization)
Sometimes users may use inappropriate categories or misclassify information.
THIS IS A CRITICAL COMPONENT OF GIS PROJECT WORK
Sources of error in GIS
Obvious sources of error.
Errors resulting from natural variations or from original measurements.
Errors arising through processing.
Obvious sources of error
Age of data.
Areal cover.
Map scale.
Density of observations. - Sufficient number of observations to perform spatial analysis?
Relevance. - Valid relationship must exist between data and the phenomenon?
Format. - Formatting for transmission, storage, and processing may introduce error.
Accessibility. - What is readily available in one place may be unobtainable elsewhere
Cost. - Extensive and reliable data is often quite expensive to obtain or convert.
Errors resulting from natural variations or from original measurements.
2a. Errors resulting from natural variation
Sources of variation in data.
Variations in data may be due to measurement error introduced by faulty observation, biassed observers, or by mis-calibrated or inappropriate equipment.
For example, one cannot expect sub-metre accuracy with a hand-held, non-differential GPS receiver.
Likewise, an incorrectly calibrated dissolved oxygen meter would produce incorrect values of oxygen concentration in a stream.
Errors resulting from natural variations or from original measurements
Positional accuracy.
A measurement of the variance of map features and the true position of the attribute, Dependent on the type of data being used or observed, nature of the real-world object (discrete or fuzzy, faulty field work, map digitising errors and conversion, and scanning errors.)
Accuracy of content.
A phenomenon may be incorrectly labelled.
Certain features may be omitted from maps or spatial databases, perhaps by design.
Faulty instrument calibration used to measure specific features.
Mistakes undetectable unless they can be corroborated with other information.
Sources of variation in data.
Are natural variations accounted for in data capture? Water temperature change?
Error propagation
When you make a small error at the start of the mapping process, or an error goes unnoticed in the data set. This means as you progress through the project, the errors get larger.
Eg. Use error as an input, that makes the output have an error
Strategies to accommodate error/uncertainty in GIS work
Data Quality Assessment
Error Propagation Analysis
Uncertainty Modeling:
Error Correction Techniques
Metadata and Documentation
Error Reporting and Visualization
Continual Improvement
The key is to engage with error/uncertainly and trying to understand where it came from, how to prevent it, work with it and make improvements.
3 perspectives on ethics in GIS/GIScience work
Pragmatic perspectives (Responsibilities to do good work, with high ethical standards, E.g. URISA*’s Code of Ethics)
Critical/theoretical perspectives (Critical exploration of power/control/marginalization, etc. E.g. John Pickles’ (1995) ‘cybernetic grids of control’)
Legal perspectives (How are spatial data gathered, How should they be gathered? Who should have permission? What are you spatial data rights?
Informed consent
Obtaining informed consent from individuals or communities.
Privacy protection
Safeguarding individuals' privacy rights.
Data ownership
Respecting the rights of data creators and owners and ensuring fair and transparent data-sharing practices.
Fucntion of geovisualizations and spatial interfaces
Provide new ways to perceive and communicate spatial science to citizens, students and other stakeholders in everyday spaces.
Geovisualization
Refers to techniques and tools designed to interactively "visualize" spatial phenomena.
Visual analytics
The science of analytical reasoning facilitated by interactive visual interfaces.
Geovisual analytics
Aims to provide the ability to explore and understand complex spatial and temporal data spaces through the use of interactive geovisual information visualization tools and interfaces.
New forms of data collection
LiDAR
Virtual and mixed reality of data
3D Space time Visualization
Mobile sensing
Flowmesh
3D topology and 3D Physics
Fluid Simulation
LiDAR
= Light Detection And Ranging
A remote sensing technology that uses a laser. It works by emitting rapid laser pulses towards the ground and measuring the time it takes for the light to return to the sensor
Structure-from-motion photogrammetry
A photogrammetric range imaging technique for estimating three-dimensional structures from two-dimensional image sequences.
Implications of virtual and mixed reality visualization for GIScience
Mobile Augmented Reality - a hybrid reality environment where physical and digital objects coexist and interact in real-time
Real-Time GIS Data
Seeing hidden spatial phenomena
Citizen Risk
Examples of persistent challenges we always face in GIS and GIScience, despite new methods
What to measure, where, how, data quality, error, uncertainty, different levels of knowledge between users GIS scientist and users
Simple QGIS workflow question examples
Describe the issue and problem you want to answer/tackle
Collect and add data
Arrange layers, projection, analysis (QGIS work)
Create Map ( add title, legend, scale, north bar, authorship
Export Map
Resolution in vector representation
In order to resolve more detail with vector representation of features, we need to increase the granularity of the line segments/polygons that form this representation. We can do this by increasing the number of points that form the basis of these higher-order representations. So to increase the resolution (detail) of vector representation of, say, a coastline, you need a greater number of points(nodes) placed a key locations along the coastline, as a basis to create more (and smaller) line segments, which will together enable more detail and geometric complexity to be resolved!
Connecting field sampling, spatial sampling, and the optimization of surface representation
The whole idea of... in order to resolve more detail of real world spatial features through data, you clearly need to have recorded them in adequate detail in the field!
And the specific location, density and frequency of sampling in the field (such as, elevation value sampled with GPS), will dictate the degree to which you are able to resolve and reconstruct the same phenomenon through data, in a GIS.
Real surfaces versus ‘abstract’ surfaces
Real: topography? Urban Landscape? Seafloor?
Abstract: isorhythmic pressure map; a house price surface map.
Ethics in the acquisition and sharing of spatial data
Who is allowed to gather data, and how. Are they allowed to share or sell data about you? US approach vs EU approach as discussed in lecture? Census data?
Ethics in the gathering and use of spatial data in everyday settings
Gathering data with peoples knowledge or their consent?
Official recording such as census?
Indirect recording such as point of sale "postcode" or inference from CC transaction.
What about being captured in Streeet View? Or drone footage?