Human fieldwork
1/40
There's no tags or description
Looks like no tags are added yet.
Name | Mastery | Learn | Test | Matching | Spaced |
|---|
No study sessions yet.
41 Terms
what is Accurate data
data that is as close as possible to the true value
what is reliable data
being able to be repeated and getting a similar result every time
what is Qualitative data
Data that involves words, pictures etc
e.g. some’s answer to a questionnaire
what is quantitative data
data that involves numbers, usually measurements of something in the field
e.g. the height of a tree
what does subjective mean
something that is based on someones opinion
what is our human fieldwork question?
to investigate differences in quality of life in LLandudno between the town centre + inner city versus the suburbs
Explain why this was a suitable location to sample (3)
The inner city area and suburban areas were accessible on foot
both areas had distinct housing types such as the inner city had terraced housing and the suburban area had semi-detached and detached housing and this would mean we could decide if quality of life was higher in one location.
The size of Llandudno (a small coastal town) meant that we could investigate two different areas without the risk of getting lost.
Explain why your key question for the investigation was appropriate. (2 marks)
The Burgess model states that the suburbs should have a better quality of life than the inner city.
Llandudno's population is 20 000 and as a result it has distinct inner city and suburban areas.
To investigate the quality of life in each of these areas would show that the suburbs should have a higher quality of life as residents in these areas have bigger houses, more open space and often have higher salaries.
To what extent was your primary data collection successful? (8+3 Spag) (questionnaire)
Questionnaire –
each group asked 4 –5 people in each of the areas and these results were added together. This allowed for a greater data set to be analysed.
Not all age groups were represented as many people were at lunch or maybe at the beach with their families (it was a sunday).
And in the inner city areas the majority of people were tourists and so did not reflect the views of residents. This means that we could not reach a reliable and strong conclusion.
Questionnaires are also subjective and we only got responses from people who were prepared to stop to talk to us. They may have been more positive people and this is shown in our data as 72% of people in the suburbs answered very positively about their quality of life.
What challenges do urban areas face?
Poverty in areas that have experienced deindustrialisation.
Seasonal unemployment in coastal towns like Llandudno.
High crime rate in some towns/cities.
Urbanisation = impermeable surfaces = surface water = flooding
Overpopulation if cities grow = less space = demand for housing = house price increase (also since covid more pressure in smaller towns)
Traffic = air pollution + congestion (see London)
how can some urban problems be managed?
Build more houses? Build upwards?
Relocate people?
Public transport improvements?
Encouraging businesses to set up in more deprived areas eg Northern Powerhouse, HS2 to create job opportunities.
Creating sponge cities – designed for flood management.
Vertical forests eg green walls to absorb CO2 and create oxygen + allow biodiversity.
The 20 minute neighbourhood – so you can get where you need to go without having to use your car.
what sort of town is llandudno?
a coastal town
how many people live in llandudno?
20,000
how has LLadudno developed?
it was originally a fishing village then with the introduction of the railway, it became a coastal town
How many in LLandudno are employed
84% are employed (in line with UK average)
what are the most common jobs
Lots of people work in hospitality and retail.
What is our Hypothesis?
Our hypothesis is that the quality of life will be better in the SUBURBAN AREAS than in the TOWN CENTRE plus INNER CITY.
what is the justification of the hypothesis
We thought this because the air quality will be better as there will be less traffic, there will be less noise pollution, lower crime rates, houses will be bigger with more green space.
what are some hazards
Traffic/cars = injury = take care when crossing roads,listen to teachers, take care.
Getting lost = being left behind in Llandudno = stay in a 3, plus have staff phone numbers.
Weather = may be too cold/wet = hypothermia/sun burn= dress appropriately, bring layers + sun cream
what were our two methods
Environmental quality assessment
Questionnaires
what type of data was the environmental quality assessment
some was qualitative data as it is subjective
some was quantitative data, e.g. counting the number of trees in an area
what type of data were the questionnaires
qualitative as they were peoples opinions
what sampling strategy did we use?
STRATIFIED – this is where areas are pre-selected based on desired criteria to ensure that there is an even number of samples from both areas.
What sampling strategy was used for the questionnaire?
The questionnaire sampling was stratified to ensure repsondents were asked in both locations but within each location we used opportunity sampling.
What is the problem with doing opportunity sampling?
the sample won't be very representative of the population.
this is because some members of the population are more likely to be willing and available to be participants on the day
What data presentation should you use for the questionnaire?
a bar chart
what are the advantages of using a bar chart to represent the data in a questionnaire?
Shows the different categories clearly and easily and allows us to compare the two study areas.
It is easy to get precise figures from the bar chart.
what are the disadvantages of using a bar chart to represent the data in a questionnaire?
This does not give locational context
What data presentation should you use for the environmental quality assessment?
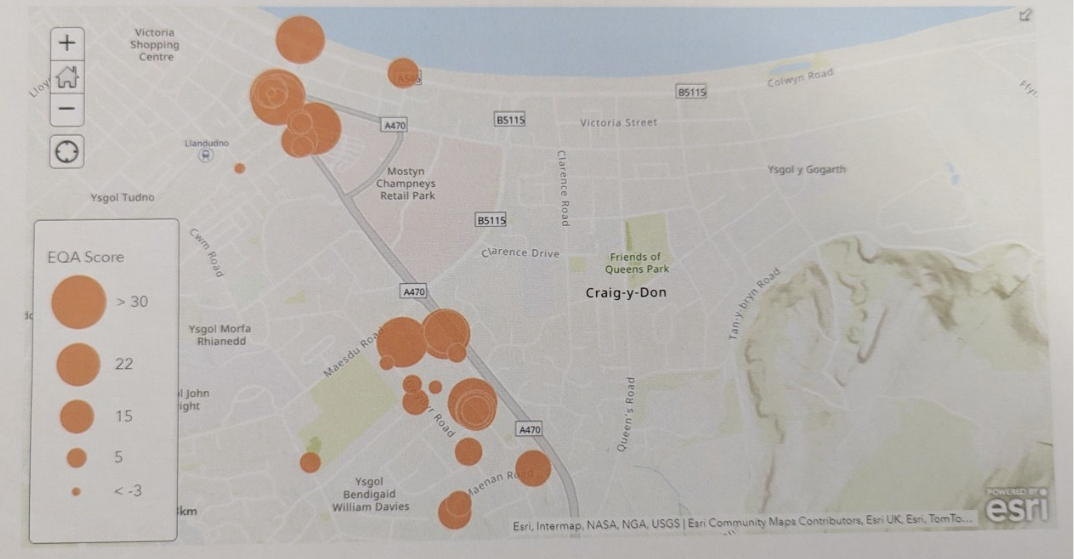
LOCATED PROPORTIONAL CIRCLES using GIS
what are the advantages of using proportionate circles to represent the data in a environmental quality assessment?
This method allows a very visual comparison of the OVERALL environmental quality of each survey point and also gives us excellent locational context to help explain the maps.
what are the disadvantages of using proportionate circles to represent the data in a environmental quality assessment?
It does not show how much each individual aspect of environmental quality that made up the overall score achieved eg, building quality or or noise.
Additionally it can be difficult to get the exact figures from proportional circles.
Finally, some of the circles when plotted on the map overlapped each other making them hard to read.
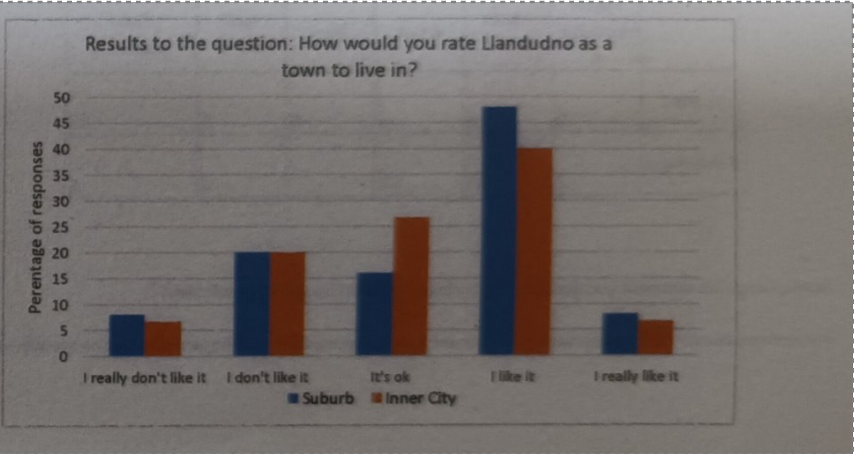
questionnaire data - how many people in the inner city liked or really liked living in the inner city
Only 36%
questionnaire data - how many people liked or really liked living in the suburbs.
a huge 56%
questionnaire data - how many people really DID NOT like living in the suburbs
Interestingly 1% more people really DID NOT like living in the suburbs
questionnaire data - overall what were most peoples views about the two areas
people were more positive about the suburbs. (72% versus 63%)
Questionnaire description and conclusion
My hypothesis was that people would have a better quality of life in the suburbs than in the inner city. Only 36% of the people in the inner city liked or really liked living in the inner city but a huge 56% liked or really liked living in the suburbs. Interestingly 1% more people really DID NOT like living in the suburbs but on balance people were more positive about the suburbs. (72% versus 63%)
EQA data
The average score for Tudno 1 was 34 and the average score for Tudno 3 was 41.
EQA description and conclusion
The EQA results do support this hypothesis. The average score for Tudno 1 was 34 and the average score for Tudno 3 was 41. Larger circles indicating higher values tended to be found along the main roads near the shopping hubs which have benefitted from regeneration and investment and lower in more residential side streets.
continued conclusion- Why might people have a better quality of life in the suburbs?
lower population density - less traffic and noise
Access to nature - promoting outdoor activities and a healthier lifestyle
Affordability - larger homes for less money than in the city
these factors can contribute to a more enjoyable and fulfifling lifestyle for many individuals and families living in suburban areas
EVALUATION - pros and cons of EQA
Our EQA data was just based on looking around a small number of streets and was SUBJECTIVE based on our opinions. We did take an average to reduce anomalies but it may have been affected by the fact our group was all female and teenagers.
Stratified sampling to ensure we had examples from both areas was a good idea as if we had just done random sampling we may have ended up with all or most sample points in the suburbs which would not have given a good comparison.
EVALUATION - pros and cons of Questionnaire
The sample size was small and may not be representative of the whole population, although a strength is that the data was collected on a Sunday where fewer people would be at work. The small sample size may affect the reliability as we may not have had a representative sample of the population.
Also we may have felt more comfortable approaching some people than others meaning our sample may not be representative.
Ideally we would like to have a stratified sample that matched the demographic profile of Llandudno but a high rejection rate makes this very difficult.