Lecture 3: Probability and Distribution of Sample Means
 Call Kai
 Learn
Learn Practice Test
 Spaced Repetition
 Match
Match Flashcards
 Knowt Play
1/15

There's no tags or description
Looks like no tags are added yet.
Name | Mastery | Learn | Test | Matching | Spaced | Call with Kai | Chat |
|---|
No analytics yet
Send a link to your students to track their progress
16 Terms
Probability (p)
main def
Equation
give example of flipping coins and example of 6-sided die
Purpose of using probability
def: the relative likelihood of an outcome
Equation: p (of A) = # of outcomes classified as A/total # of possible outcomes
e.g.
Flipping coin, p (heads) = ½
Rolling 6 -sided die, p(any #) = 1/6
getting a king out of 52 cards, p (king) = 4/52 = 1/13
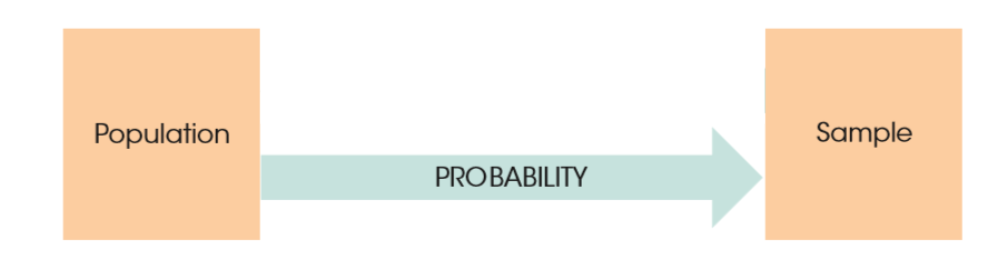
Purpose: to determine the type of sample likely to be obtained from the population
Inferential statistics: Often times however, the sample results are used to infer and draw conclusions about the population
Random sampling def
what is the sample called
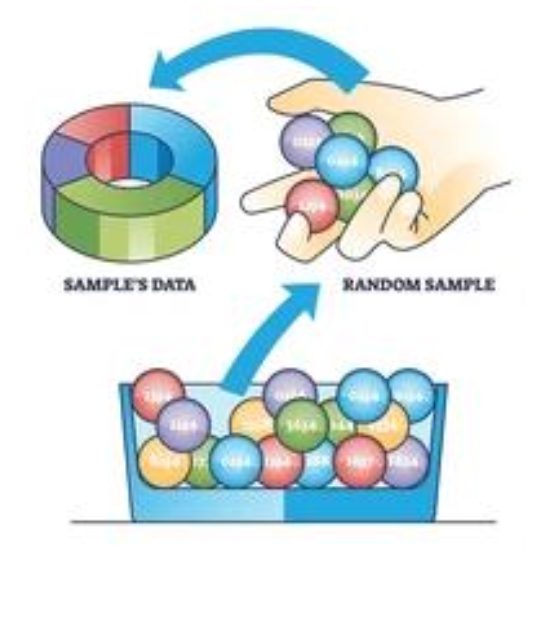
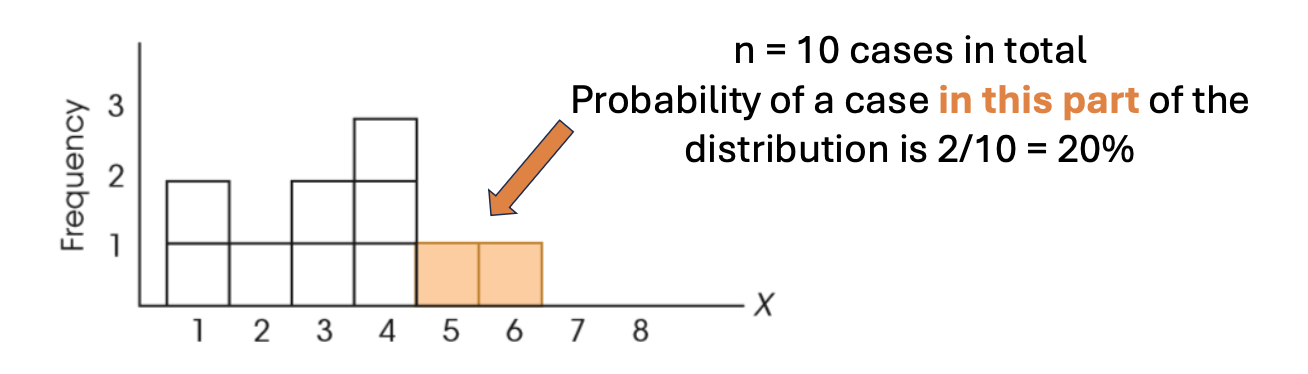
equal opportunity of each person being selected (descriptive statistics)
sample called simple random samples
Independent random sampling
main def
what does it require for the sample to be called independent random sampling
the selection of one person does not influence the selection of others
requires sampling with replacement
e.g. ball gets put back into the pool (cannot remove the individual after sampling)
What type of data is probability (in what type of data representation)
what does probability represent in it
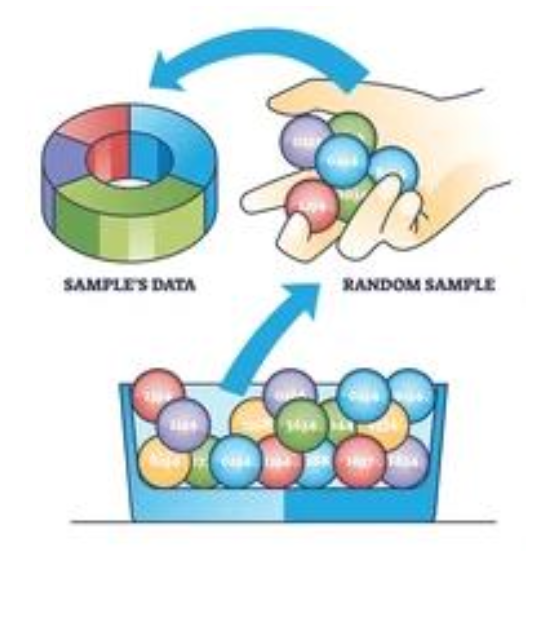
type of data that goes in a frequency distribution
Probabilities are proportions of the distribution
e.g. in the image (probability of a score being 5 or higher is 2/10 = 20%)
If a probability is unlikely or unusual is important (results in finding treatments etc)
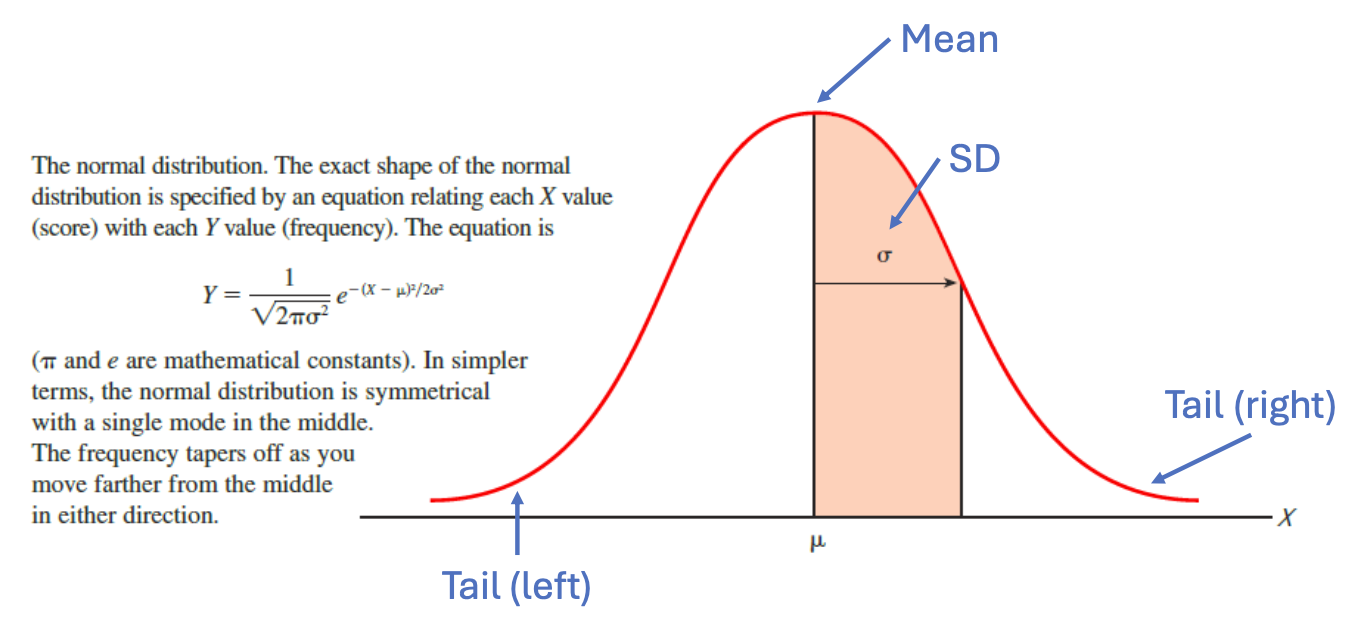
The normal distribution
is the image showing a sample or population results?
scores closer to the mean more common (scores near the mean is more probable), extreme values less common (improbable)
image shows population
tail: focus on the smaller parts of the distributions (often extreme values)
Z-transform
for the z-score
mean = 0, SD scale = 1
Symmetrical, mean = median = mode (normal distribution
Link between score and SD units
e.g. the difference between -1 and +1 = 34.13 + 34.13 = 68.26
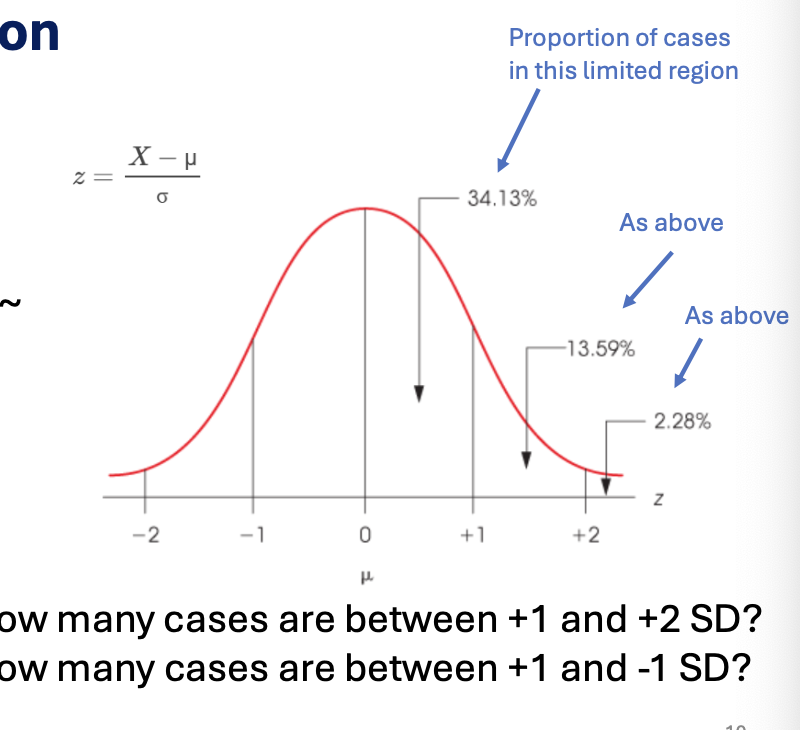
The Unit Normal Table
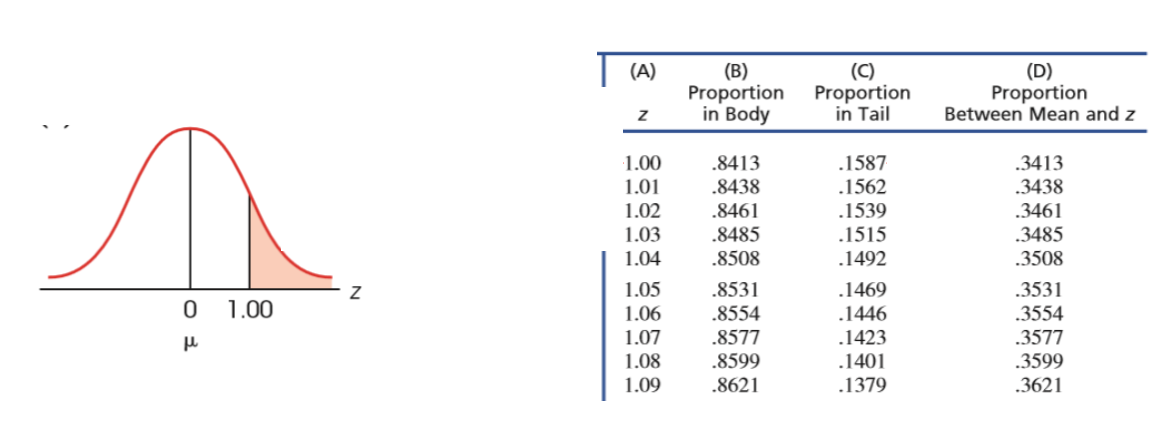
the body
the tail
relationship of body and tail
the in between
gives a proportion of cases in a part of a distribution in relationship to a particular Z score
To find on the table (don’t need to solve)
Body = all cases below z value
Tail - all cases after z
Tail + body = 1
Z score in relation to mean
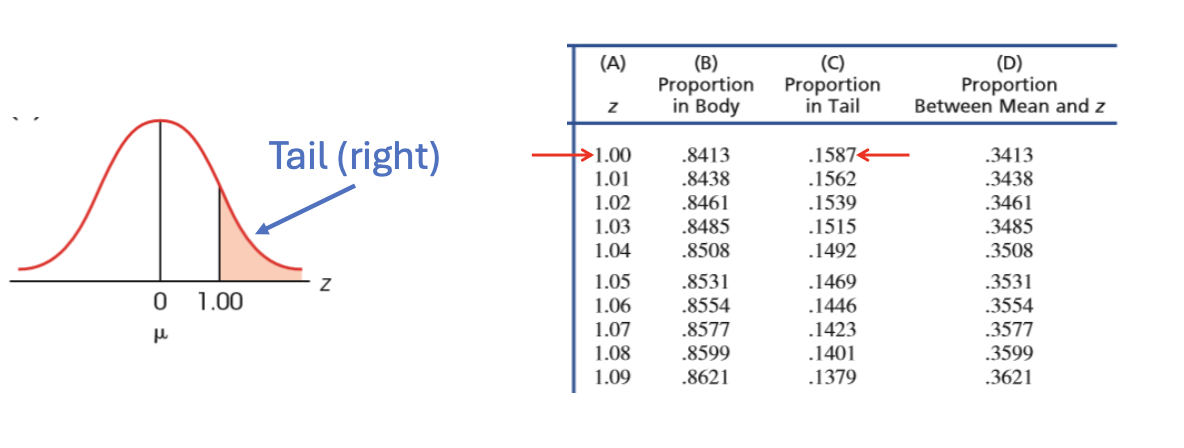
Using the Unit Normal table
What proportion of cases corresponds to a Z value of greater than 1?
What proportion of cases are between z = 0.34 and z = 0?
What proportion of cases are between the mean and z = 0.21?
What Z score corresponds to a point equal to, or greater, than 60% of all cases?
What proportion of cases are between z = 0.34 and z = 0?
Look at tail
What proportion of cases are between the mean and z = 0.21?
Look at D (between mean and z-score)
What Z score corresponds to a point equal to, or greater, than 60% of all cases?
find body with 60% or 0.6
Sometimes not exactly on the table: estimate to a reasonable amount
There is a relationship between body and percentile rank (will be the same)
Binomial distributions
number of outcomes
equation
What happens as n increases
only two outcomes
therefore p(A) + p(B) = 1 or p + q = 1, respectively
As n increase, distribution approaches to normality
mean = pq, SD = sqrt(npq)
Separate bar for discrete values or nominal type of data
Treatment and comparisons (L02)
how to determine the treatment has an effect through z-scores
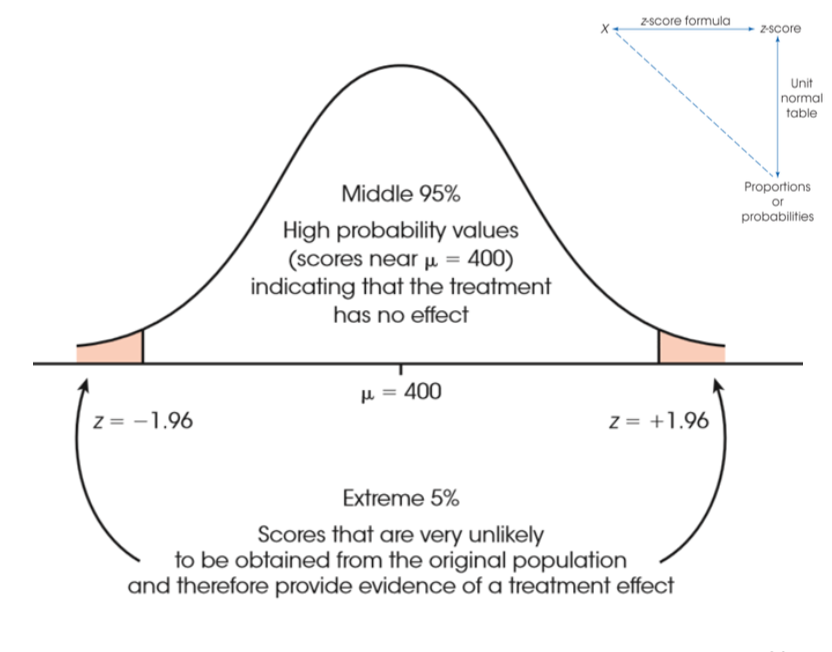
is treatment of group different noticeably compared to the population: then effect is possible
do z-score distributions
if the score is found in the tails (extremes) (e.g. Z=1.96), it is unlikely to be found through random sampling and are more likely to be a result of a treatment effect and outliers
How can outliers be defined through statistics- what do you deal with outliers
How is it defined by z scores
what value of SD is considered an outlier
Three ways to deal with outliers
Outliers are defined by very high or very low Z-score (or SD standard deviation)
Criteria is 2 or 3 SD units to be considered as an outlier
Never less than 2
What to do with outliers
Remove outliers (some may become outliers - where you draw the line of removing outliers)
Must still explain why you did it, and the rational
check errors
Outliers may be due to how you deal with the data
Issue about using population for comparing z-scores and SD
what do we do instead, what do we use to prevent confounding variables
impractical, confounding variables in the population
Therefore, use control groups instead to control the confounding variables
Use of random selection
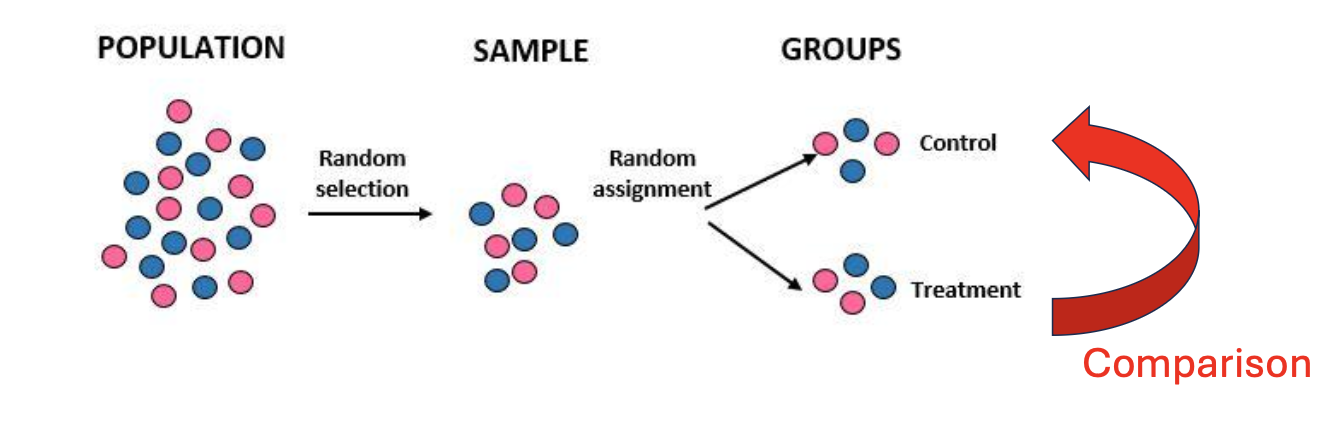
Sampling distribution
multiple samples
tracking the mean of all samples to create a frequency distribution of all those different sample
Sampling distribution: the distribution of all possible sample means of a particular size (n) that can be drawn from the population
e.g. flip number is 10 for each sample (see the number of heads/tails that come up for each sample)
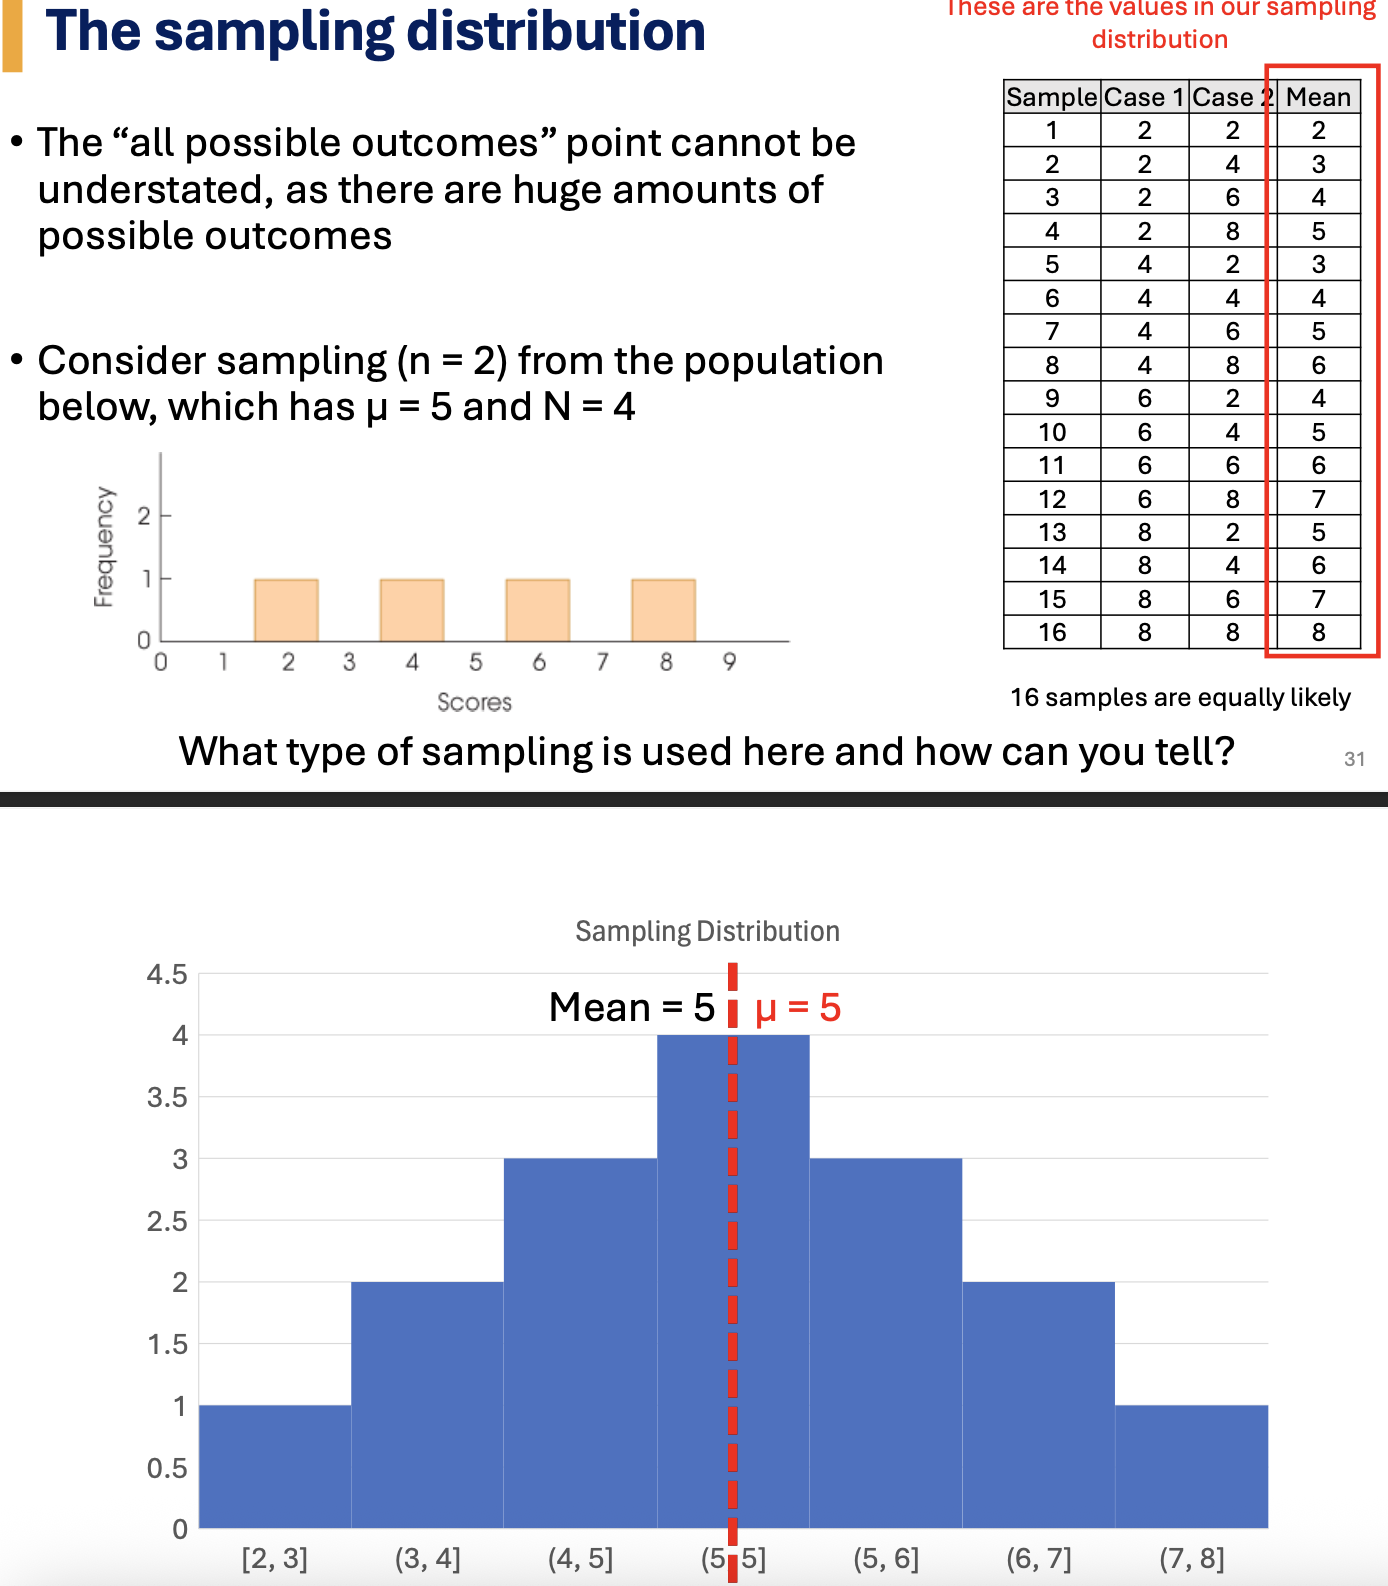
Central Limit Theorem
hint: central = middle to the graph, limit = size
as n approaches infinity (all samples are considered)
mean approaches mu synbol
SD approaches = signma/sqrt(n)
Approaching normality
N doesn’t have to approach infinity, normal if
Data based are normal
Samples are very large (or large enough)
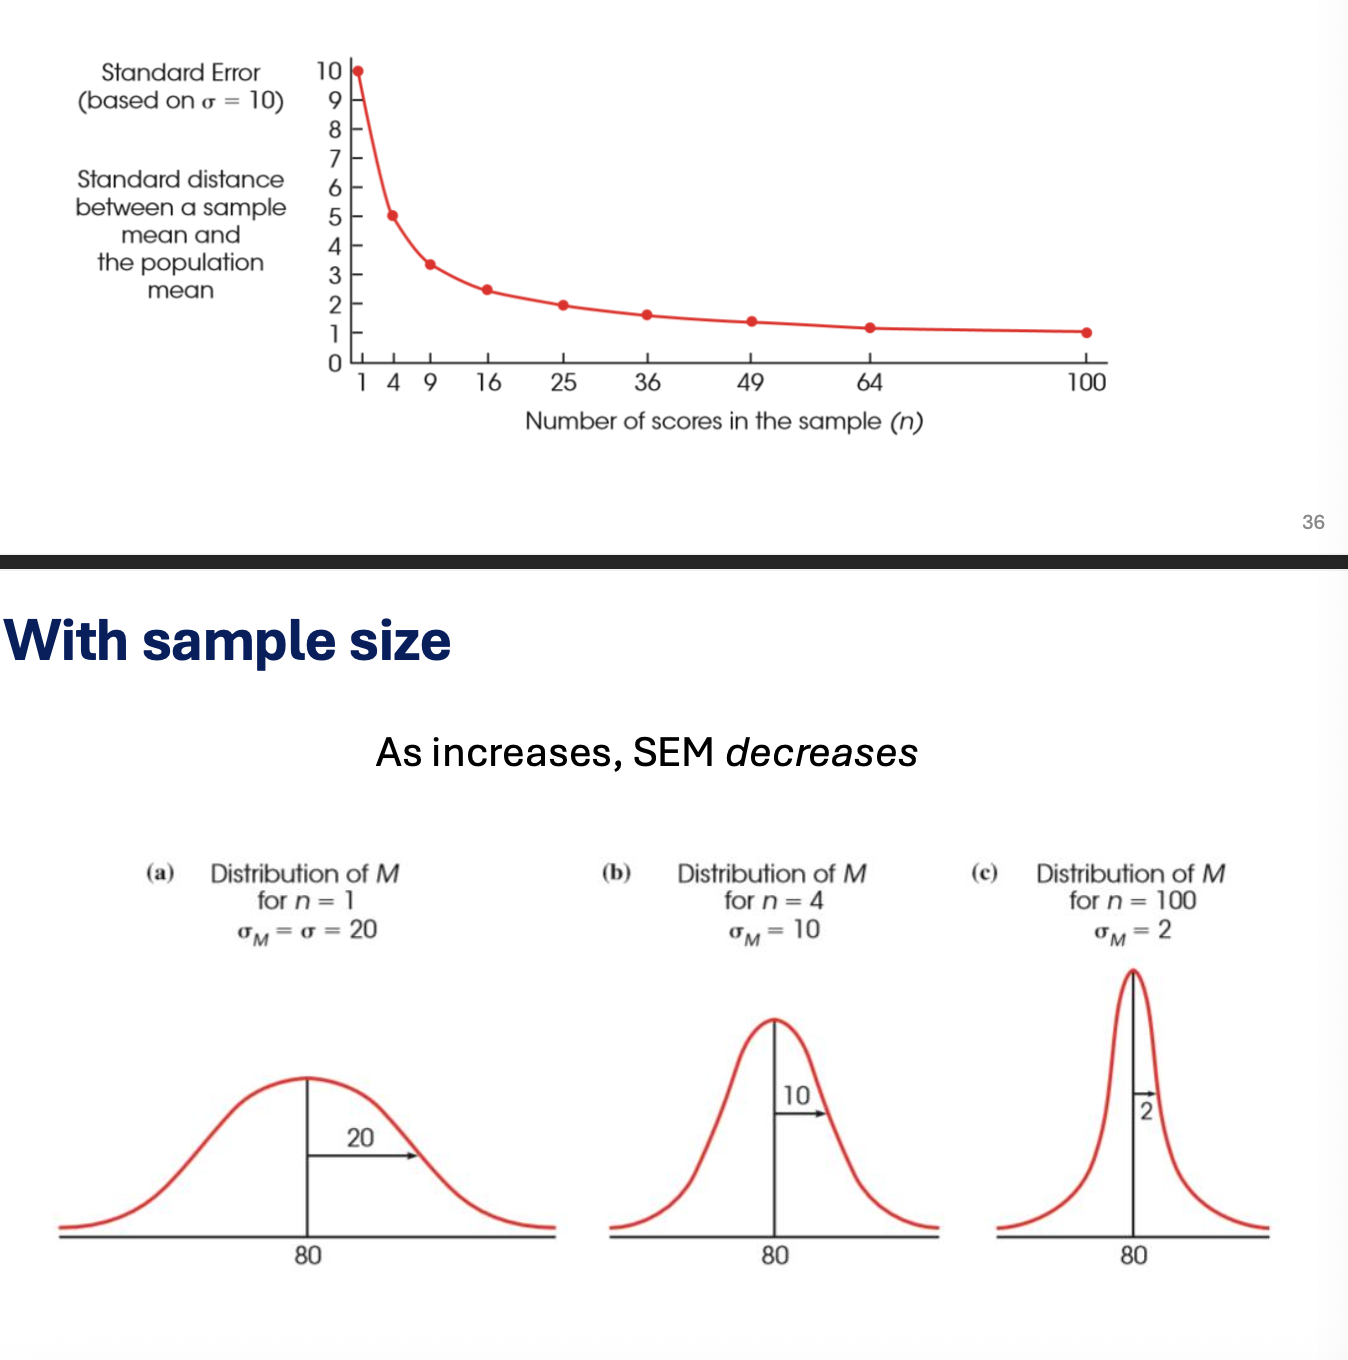
Standard Error of the Mean
Law of large numbers
SEM = sigma/(sqrt(n))
law of large numbers: as n increases, and the sample mean represents the population mean
Or basically SEM decreases
cannot change n size or anything in the experiment halfway through the experiment (questionable)
The population of scores on the SAT forms a normal distribution with μ = 500 and σ = 100
If you take a random sample of n = 16 from the population, what is the probability that the sample mean ≥ 525?
Rephrase with proportion: Of all possible sample means (i.e. in the sampling distribution), what proportion has values greater than 525?