BioStats Exam 1
1/149
There's no tags or description
Looks like no tags are added yet.
Name | Mastery | Learn | Test | Matching | Spaced | Call with Kai | Chat |
|---|
No analytics yet
Send a link to your students to track their progress
150 Terms
population
the entire group of objects in our study
parameters
measurements on populations
sample
represents part of a population
statistics
measurements on samples
(experimental) unit
an object about which we collect data or measurements
person, thing, events, etc.
variable
a property of a unit which we wish to measure
height, eye color, etc.
qualitative and quantitative
types of variables
qualitative variable (categorical)
classifies the units into categories, which may or may not have a natural ordering to them
no math possible
quantitative variable
has numerical values that are measurements (height, weight, etc.) or counts
math can be applied to this
continuous or discrete
a quantitative variable can be…
continuous
a quantitative variable is _____ if it can take any value in an interval (has decimals)
discrete
a quantitative variable is _____ if it can take on a limited or countable number of values (whole numbers)
collect data and then make decisions
the goal of every statistical study is to…
observational study, perform an experiment, use a simulation, and administer a survey
types of sampling techniques
observational study
researcher observes and measures characteristics of interest of part of a population but doesn’t change existing conditions
perform an experiment
a treatment is applied to part of a population and responses are observed
use a simulation
the use of a mathematical model to reproduce the conditions of a situation or process
administer a survey
an investigation of one or more characteristics of a population
census
a count or measure of an entire population
sampling
a count or measure of part of a population and is more commonly used in statistical studies
simple random, stratefied, cluster, and systematic
types of samples
simple random sample
one in which every sample of the same size has the same chance of being selected
stratefied sample
when it’s important for the sample to have members from each segment of the population
strata
subsets that members of the population that share a common characteristic in stratefied sample
cluster sample
used when the population falls into naturally occurring subgroups, each having similar characteristics
clusters
groups that population is divided into in cluster sample
systematic sample
each population member is assigned a number
a starting number is randomly selected, and then sample members are selected at regular intervals from the starting number
bias
a sample should be selected from a population randomly, otherwise it’s prone to…
representative sample
when sampled properly, we obtain a _____ of the population
representative sample
a subset of the population from which data are collected that accurately reflects the population
bias
the systematic favoring of certain outcomes
sample/systematic bias
systematic favoring of certain outcomes due to the methods employed to obtain the sample
non-response and response
types of sampling bias
non-response bias
a type of sampling bias where certain outcomes are favored when the individuals who choose to participate in a study differ from the individuals who choose to not participate
response bias
a type of sampling bias where certain outcomes are favored when participants do not respond truthfully
stem-and-leaf, dot plot, histogram, bar chart, pie chart, and time series graph
types of graphical representations of data (graphs)
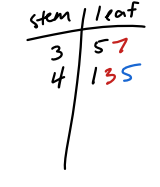
stem-and-leaf
a diagram in which each observation is separated into two parts
stem
in a stem-and-leaf plot, ____ consists of all but the rightmost digit
leaf
in a stem-and-leaf plot, ____ is the rightmost digit
increasing order
to make a stem-and-leaf plot, sort the stems in _____ and draw a vertical line to the right of this list
key
every stem-and-leaf plot should be accompanied by a ____
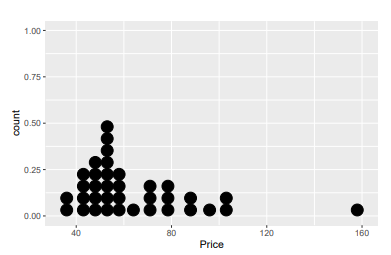
dot plot
a graph where each observation is plotted as a dot at an appropriate place above the horizontal axis
stem-and-leaf plot
dot plot
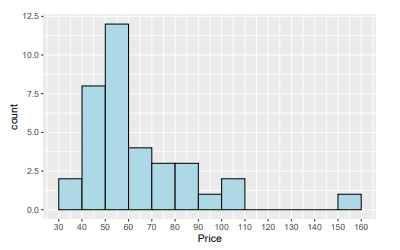
classes, frequency
histogram is a graph where data has been grouped into intervals or _____ and the _____ of measurements in each class is noted
Rf = frequency / total number
relative frequency formula
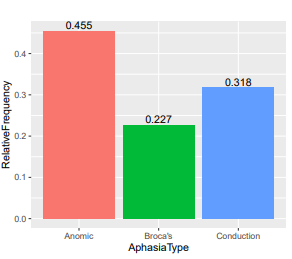
qualitative data
bar chart similar to a histogram but uses…
touch, do not touch
in a histogram, the bars ___ each but, in a bar chart, the bars ____ each other
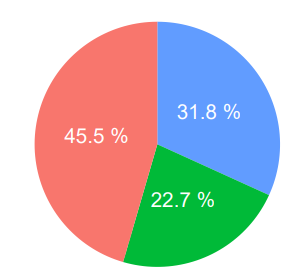
pie chart
a disk divided into wedge-shaped pie pieces proportional to the relative frequencies of the qualitative data
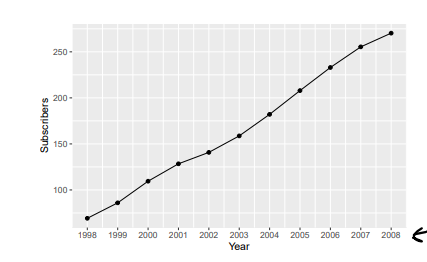
time series graph
a line graph of repeated measurements taken over regular time intervals
trends or patterns
time series graphs are good for identifying _____
bar graph
histogram
time series graph
pie chart
mean
the sum of the numbers divided by n
sample and population
types of mean
mean()
R function for mean
closer
when there’s a high value in a set of numbers, the mean moves ____ to the higher value
median
the middle number when numbers are arranged from smallest to largest
odd
if the amount of numbers is ____, the median is the middle number
even
if the amount of numbers is _____, the median is the average between the two middle numbers
sort() or median()
R function to help you find median
resistant
the median is ____ to outliers or extreme values
mode
the most frequently occurring value
more than one, no mode, symmetric
there can be ____ mode
if the frequency of each number is one, there is ____
the mode is not often used for quantitative data unless the data is ______
mode
between mean, median, and mode, ____ is the only measure which can be used for qualitative data
range
the difference between the largest value and the smallest value
range = maximum - minimum
range formula
max() - min()
using R to find range
standard deviation
a measure of the spread of the observations from the mean
variance
a measure of the squared spread of the observations from the mean
mean
standard deviation shares the same units as the…
positive
standard deviation (and variance) is typically ____
larger
the more spread out the numbers are about the mean, the ____ the standard deviation (or variance)
zero
if the observations are the same, the standard deviation (or variance) is equal to ___
square units
variance is measured in…
sd()
using R to compute standard deviation
put the numbers in the list then stat + calc + 1
TI calculator shortcut to find 1 variable statistics
interquartile range
measures the spread of the middle 50% of data
Q2
the median = ___
Q1
the median of the lower half of the data
Q3
the median of the upper half of the data
Q1
the 25th percentile and separates the lower 25% of the data and upper 75%
Q2
the 50th percentile and separates 50% of the data
Q3
the 75th percentile and separates the lower 75% of data from the upper 25%
left skewed
Q1 is further from the median than Q3, then the data is ______
symmetric
Q1 and Q3 are the same distance from the median, then the data is approximately ____
right skewed
Q3 is further from the median than Q1, then the data is ____
IQR()
using R to find interquartile range
five-number summary
the minimum, Q1, median, Q3, and maximum (in this order)
fivenum()
using R to find the five-number summary
standard score(z-score)
tells us how many standard deviations the observed value is from the mean
z > 0
if ____, then x > mean
z < 0
if ____, then x < mean
z = 0
if ____, then x = mean
modified boxplots and z-score
two methods to detect probable outliers
potential outliers, solid dot
for a modified boxplot, observations that fall outside of the fences are ____ and are marked with a ____
absolute value of z > 3
if the _____, then x is a probable outlier
random variable
an uncertain number whose value depends on the random outcome of an experiment