GB307 Linear Regression
1/26
There's no tags or description
Looks like no tags are added yet.
Name | Mastery | Learn | Test | Matching | Spaced |
|---|
No study sessions yet.
27 Terms
Supervised Learning P(Y|X) = P(y1, y2, … | x1, x2, …)
regroups methods that attempt to learn about the conditional distribution
Y Variables
outcomes, response variables, or labels
dependent variables
X Values
explanatory variables, predictors, or regressors
independent variables
Ordinary Least Square (OLS) Regression
the relationship between the expected value of Y and Xs is assumed to be linear

How are estimations and predictions denoted?
with a hat
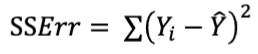
How are coefficients obtained?
by minimizing the Sum of Squared Residuals (errors)
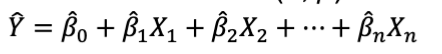
What is the regression equation?

How to interpret an intercept when zero makes sense for both variables?
“On average, when a (x1 variable = 0) and (x2 variable = 0), we expect their grade to be (intercept), everything else being equal.
How to interpret an intercept when zero doesn’t make sense?
“(x variable = 0) is unrealistic or out of range, so we shouldn’t extrapolate”
How to interpret the slope?
“On average, an (increase/decrease) in (x variable) is associated with an
(increase/decrease) in (y variable) by (slope), everything else being equal.”
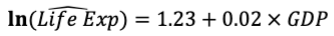
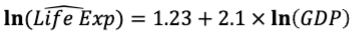
Change in Units: logs
change will be in percentage
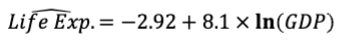
interpret the equation
“On average, an increase of GDP by 1% is associated with an increase in Life Expectancy by 0.081 years, everything else being equal.”
interpret the equation
On average, an increase of GDP by 1 Million USD is associated with an increase in Life Expectancy by 2 %, everything else being equal.
interpret the equation
On average, an increase of GDP by 1 % is associated with an increase in
Life Expectancy by 2.1 %, everything else being equal
Change of Units: standardized
change is represented in standard deviations
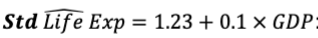
interpret the equation
On average, an increase of GDP by 1 Million USD is associated with an increase in Life Expectancy by 0.1 Standard Deviations, everything else being equal.
R-Squared
the share of variations in Y that we can explain with the model, when we know the value of every single explanatory variable
Interpret: R2 = 0.245
With this model, we can explain 24.5% of the variations in grades by looking at the variations in both the number of hours of study and in the number of class skipped”
p-Values
The probability that we find an estimated coefficient (x value) at least that far from the population value, if the population value were the one in H0 (usually 0)
How to interpret p-values?
If the true population coefficient (x value), there is a probability of less than (p-value) that the estimated coefficient for the (x-value) is that far from 0.
Statistical Significance
A result is statically significant at a confidence level a if p-value < a
How to calculate fitted (predicted) values?
decide whether the question is asking something realistic
then just replace x values

What is the expected revenue for a film produced in 1970 with a $10MM budget?

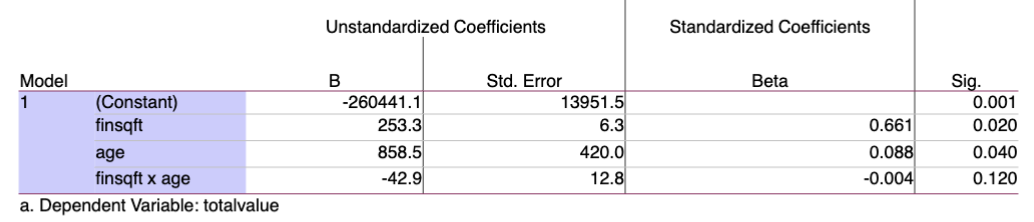
How to calculate incremental values?
multiply the coefficient of the variable by the change in the variable

What is the expected difference in revenues for a film released in 1990 versus one listed in 1980, all else held constant?


What is the expected change in revenues associated with a film that is delayed a year, but given an additional $10MM of budget?

How to recognize a violation of the 4 assumptions (L.I.N.E.)
linearity
independence
normality (or error)
equal variance