quality control intro + quality chart for variable data
1/31
There's no tags or description
Looks like no tags are added yet.
Name | Mastery | Learn | Test | Matching | Spaced |
|---|
No study sessions yet.
32 Terms
statistical process control (SPC)
verify that business processes are meeting the specifications
identifies special cause variation
signals the need to take corrective action when appropriate
control charts
what is the main graphical tool that statistical process control (SPC) relies on?
types of variation in a system
common causes
special causes
common causes
what type of variation is described as natural or random and is inherent in any process?
common causes alone
a process is considered in statistical control only if the variation is present due to _____
special causes
non-random (assignable) variation due to identifiable factors
out of control
when special causes of variation are present in a process, the process is deemed to be ______
it is expensive
testing can be destructive
it should be unnecessary for a controlled process
what are three key disadvantages of inspecting every single item (100% inspection?)
statistical sampling
in quality control, what is the more economic alternative to examining an entire lot?
lots
in sampling, the flow of products is broken down into discrete batches called ____
random sample
a sample in which each unit in the lot has an equal chance of being included
subject it to 100% inspection
all defective items are repaired or replaced
return the entire quantity to the supplier
if a random sample from a lot fails a quality test, what are three potential actions for the entire lot?
variable data (quantitative data)
product or service characteristics that can be measured on a continuous scale
EX] length, weight, time
expressed with statistics such as averages and standard deviations
SPC metrics
variable data (quantitative data)
attribute data (qualitative data)
attribute data (qualitative data)
product or service characteristics evaluated with discrete choice
EX] either in or out of tolerance, error/defect present or absent, yes or no, good or bad
expressed as proportions or rates
Control charts
a specialized run chart that helps an organization track changes in key measures over time
under control
if a sample falls inside the control limits, the process is considered…
mean
upper control limit (UCL)
lower control limit (LCL)
what are the three fundamental lines calculated and plotted on every control chart?
histograms vs control charts
histograms do not take into account changes over time
control charts can tell us when a process changes
developing control charts
prepare
collect data
determine control limits
analyze and interpret results
use a problem-solving tool
compute process capability
controlled process
most points near the center line
no points are outside control limits
points fall randomly aboce and below the center line
out-of-control
instability → points outside control limits
sudden shift in process average
cycles
trends
nelson rules
nelson rules
the set of guidelines developed by llyod nelson in 1984 for detecting out-of-contol conditions are known as ______
the average value (central tendency) of a variable
what aspect of a process do x-bar charts specifically monitor?
the variation or dispersion among items within each sample
what aspect of a process do R-charts specifically monitor?
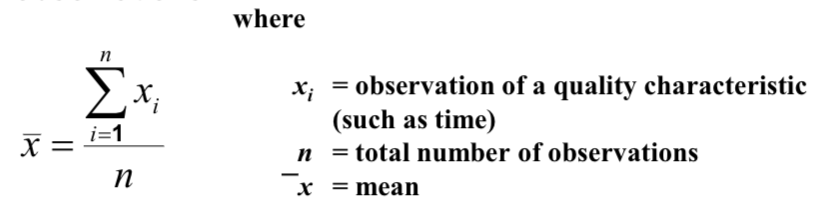
X-bar
sum of observations divided by the total number of observations
R-bar
the difference between the largest observation in a sample and the smallest observation
the overall mean which is the average of all the individual sample means
when constructing control charts, what does the x-double bar symbol represent?
the average range which is the average of the ranges from all the individual samples
when constructing control charts, what does the R-bar symbol represent?
the size of the sample (n)
the values for the control chart factors A2, D3, and D4 are determined by what parameter?
R-chart
when constructing and analyzing control charts for variables, which chart must always be analyzed first?
on a daily basis to monitor performance and identify any new special causes that might arise
once a process is confirmed to be in a state of statistical control, how should control charts be used?