ap hug summative review (all vocab, models, and theories)
1/344
There's no tags or description
Looks like no tags are added yet.
Name | Mastery | Learn | Test | Matching | Spaced |
|---|
No study sessions yet.
345 Terms
what projection is this
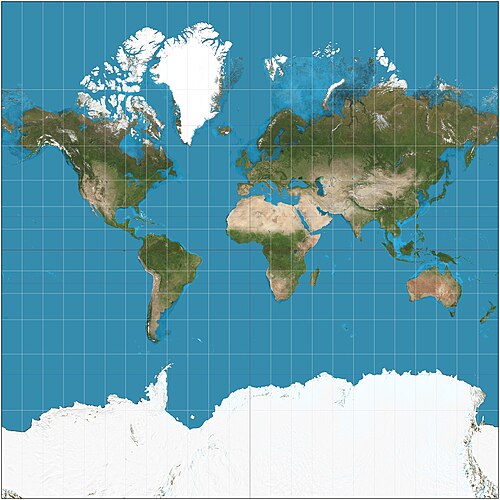
mercator projection
what is the mercator projection used for
direction
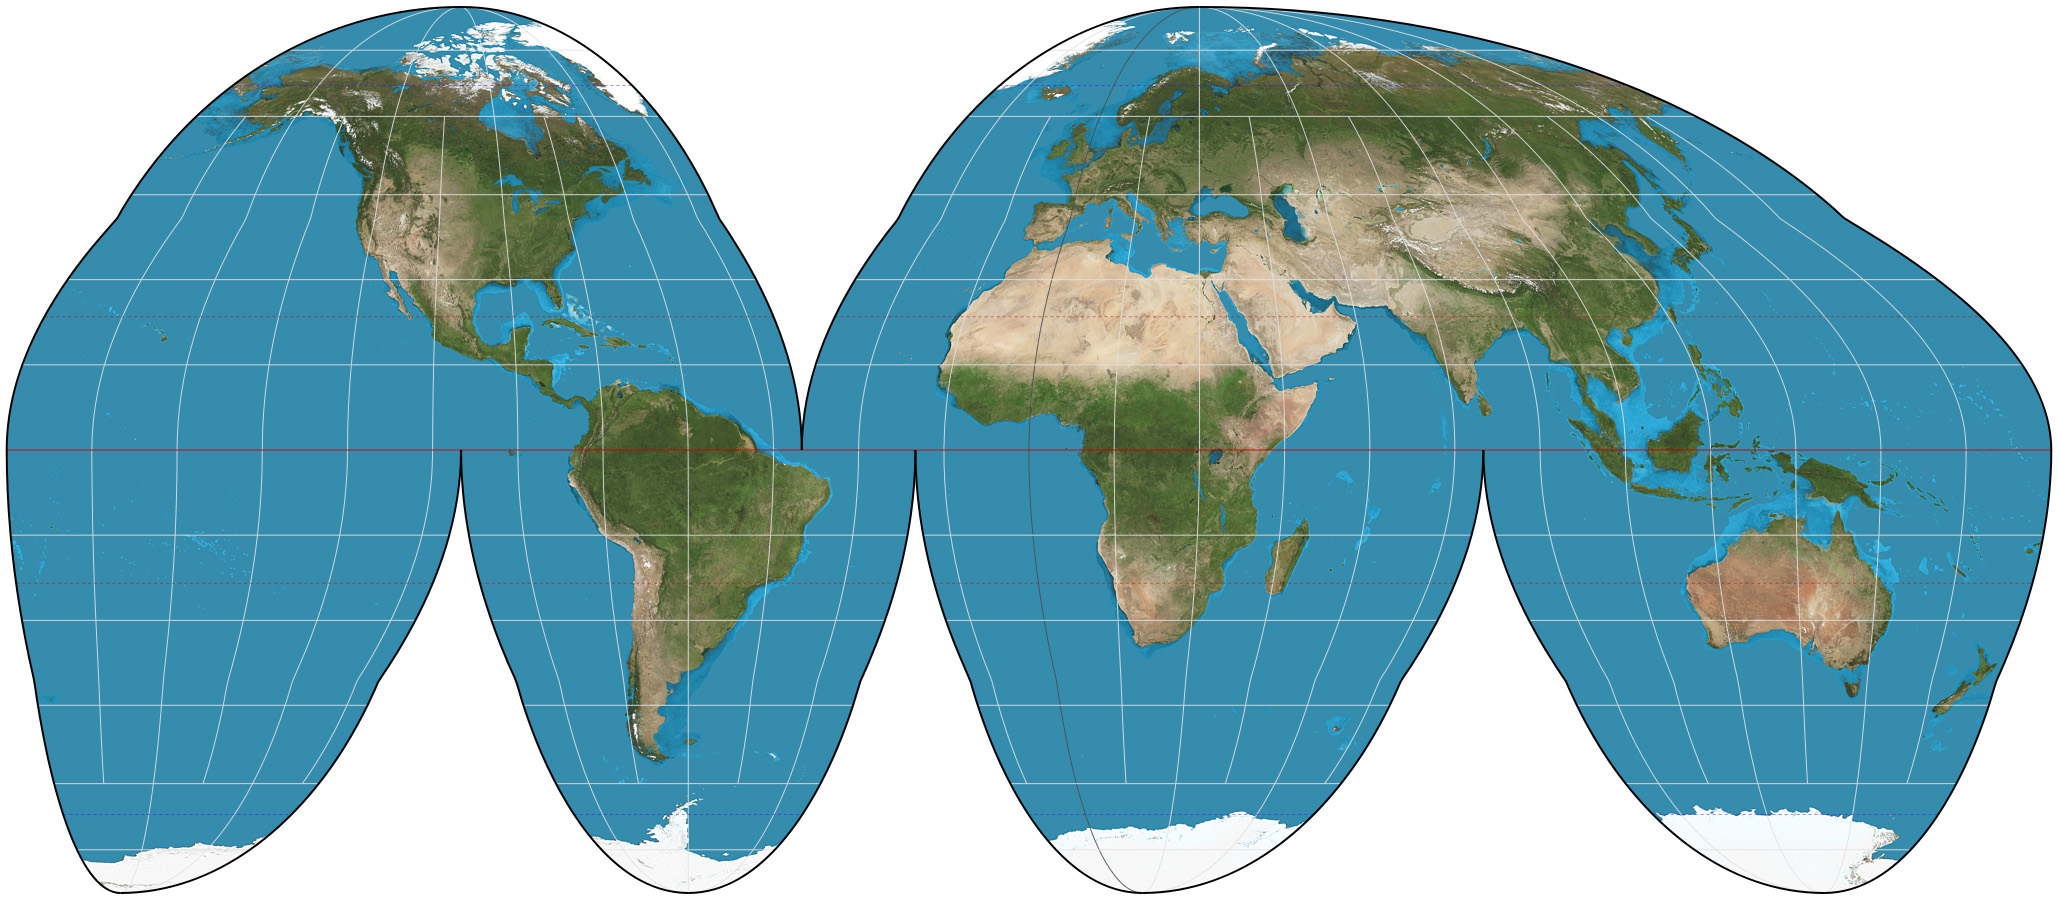
what projection is this
goode homolosine projection
benefits of goode homolosine projeciton
equal area of landmasses
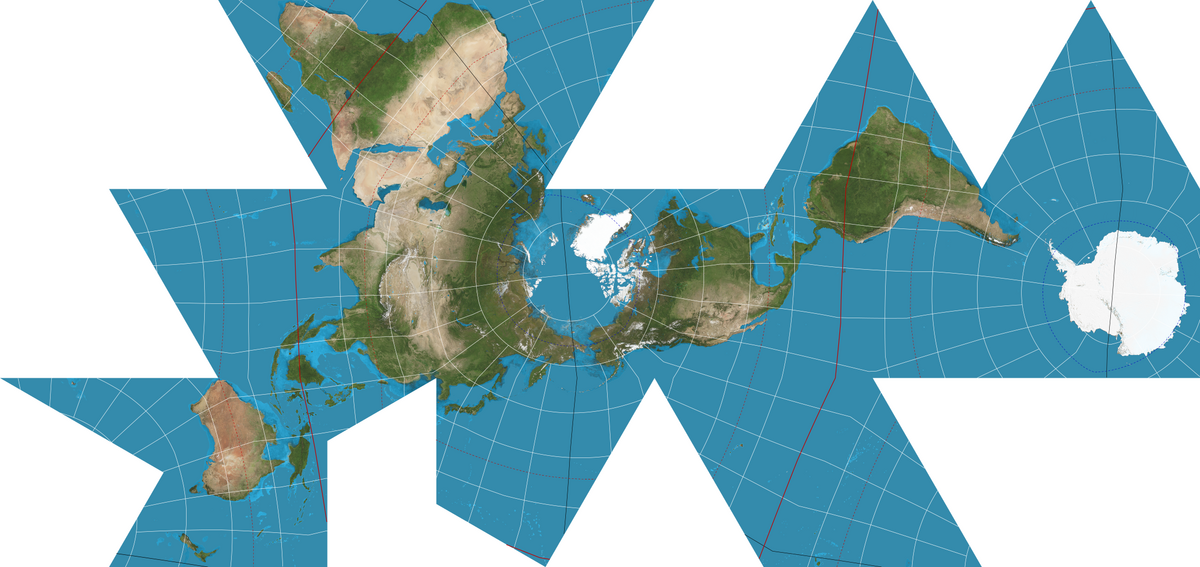
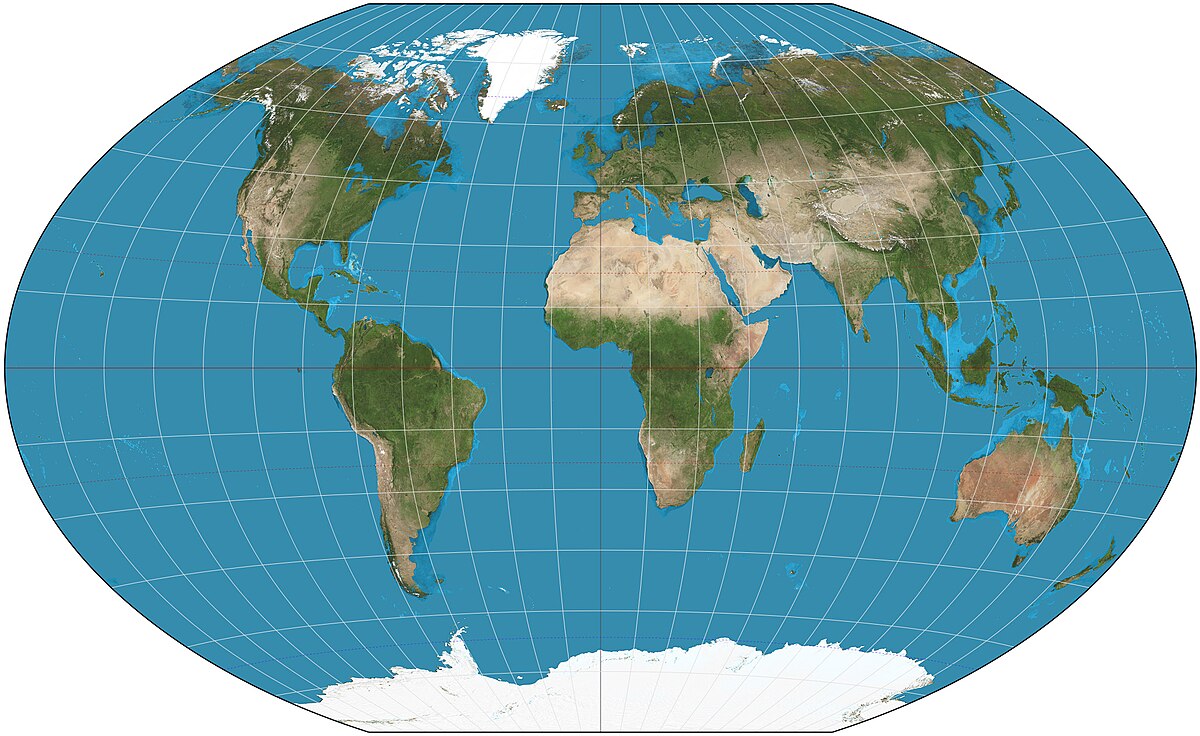
what projection is this
fuller map projection
benefits of fuller map projection
accurate shapes/sizes
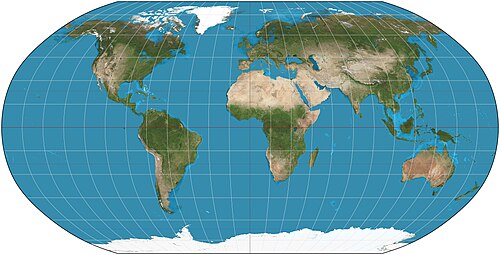
what projection is this
robinson projection
benefits of robinson projection
minimal distortion
what projection is this
winkel tripel projection
benefits of winkel tripel projection
accurate size and minimizes distortion by keeping it concentrated at the poles
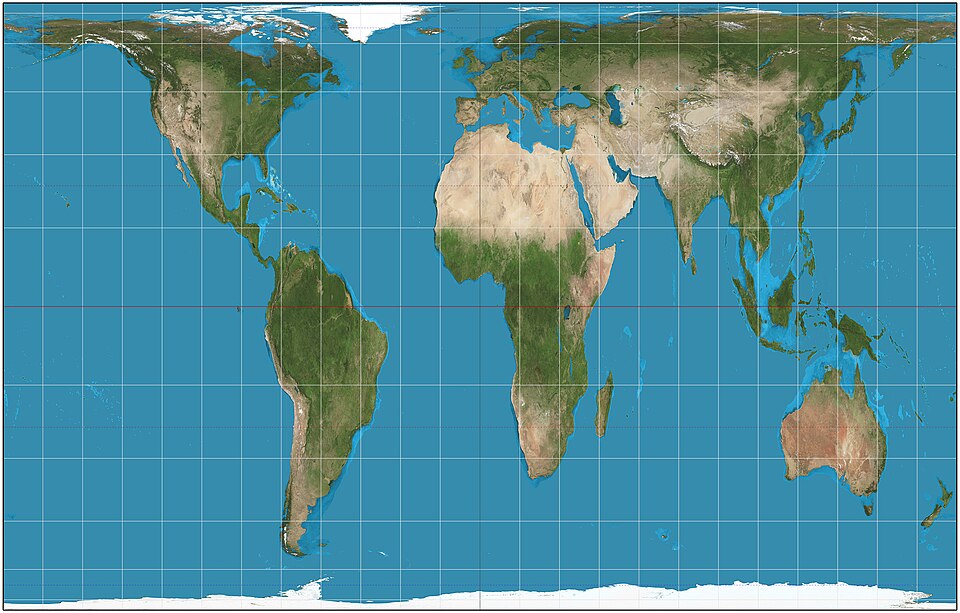
what projection is this
gall peters projection
benefits of gall peters projection
accurate in shape
reference maps
informational maps (ex. boundaries, names, geographic features)
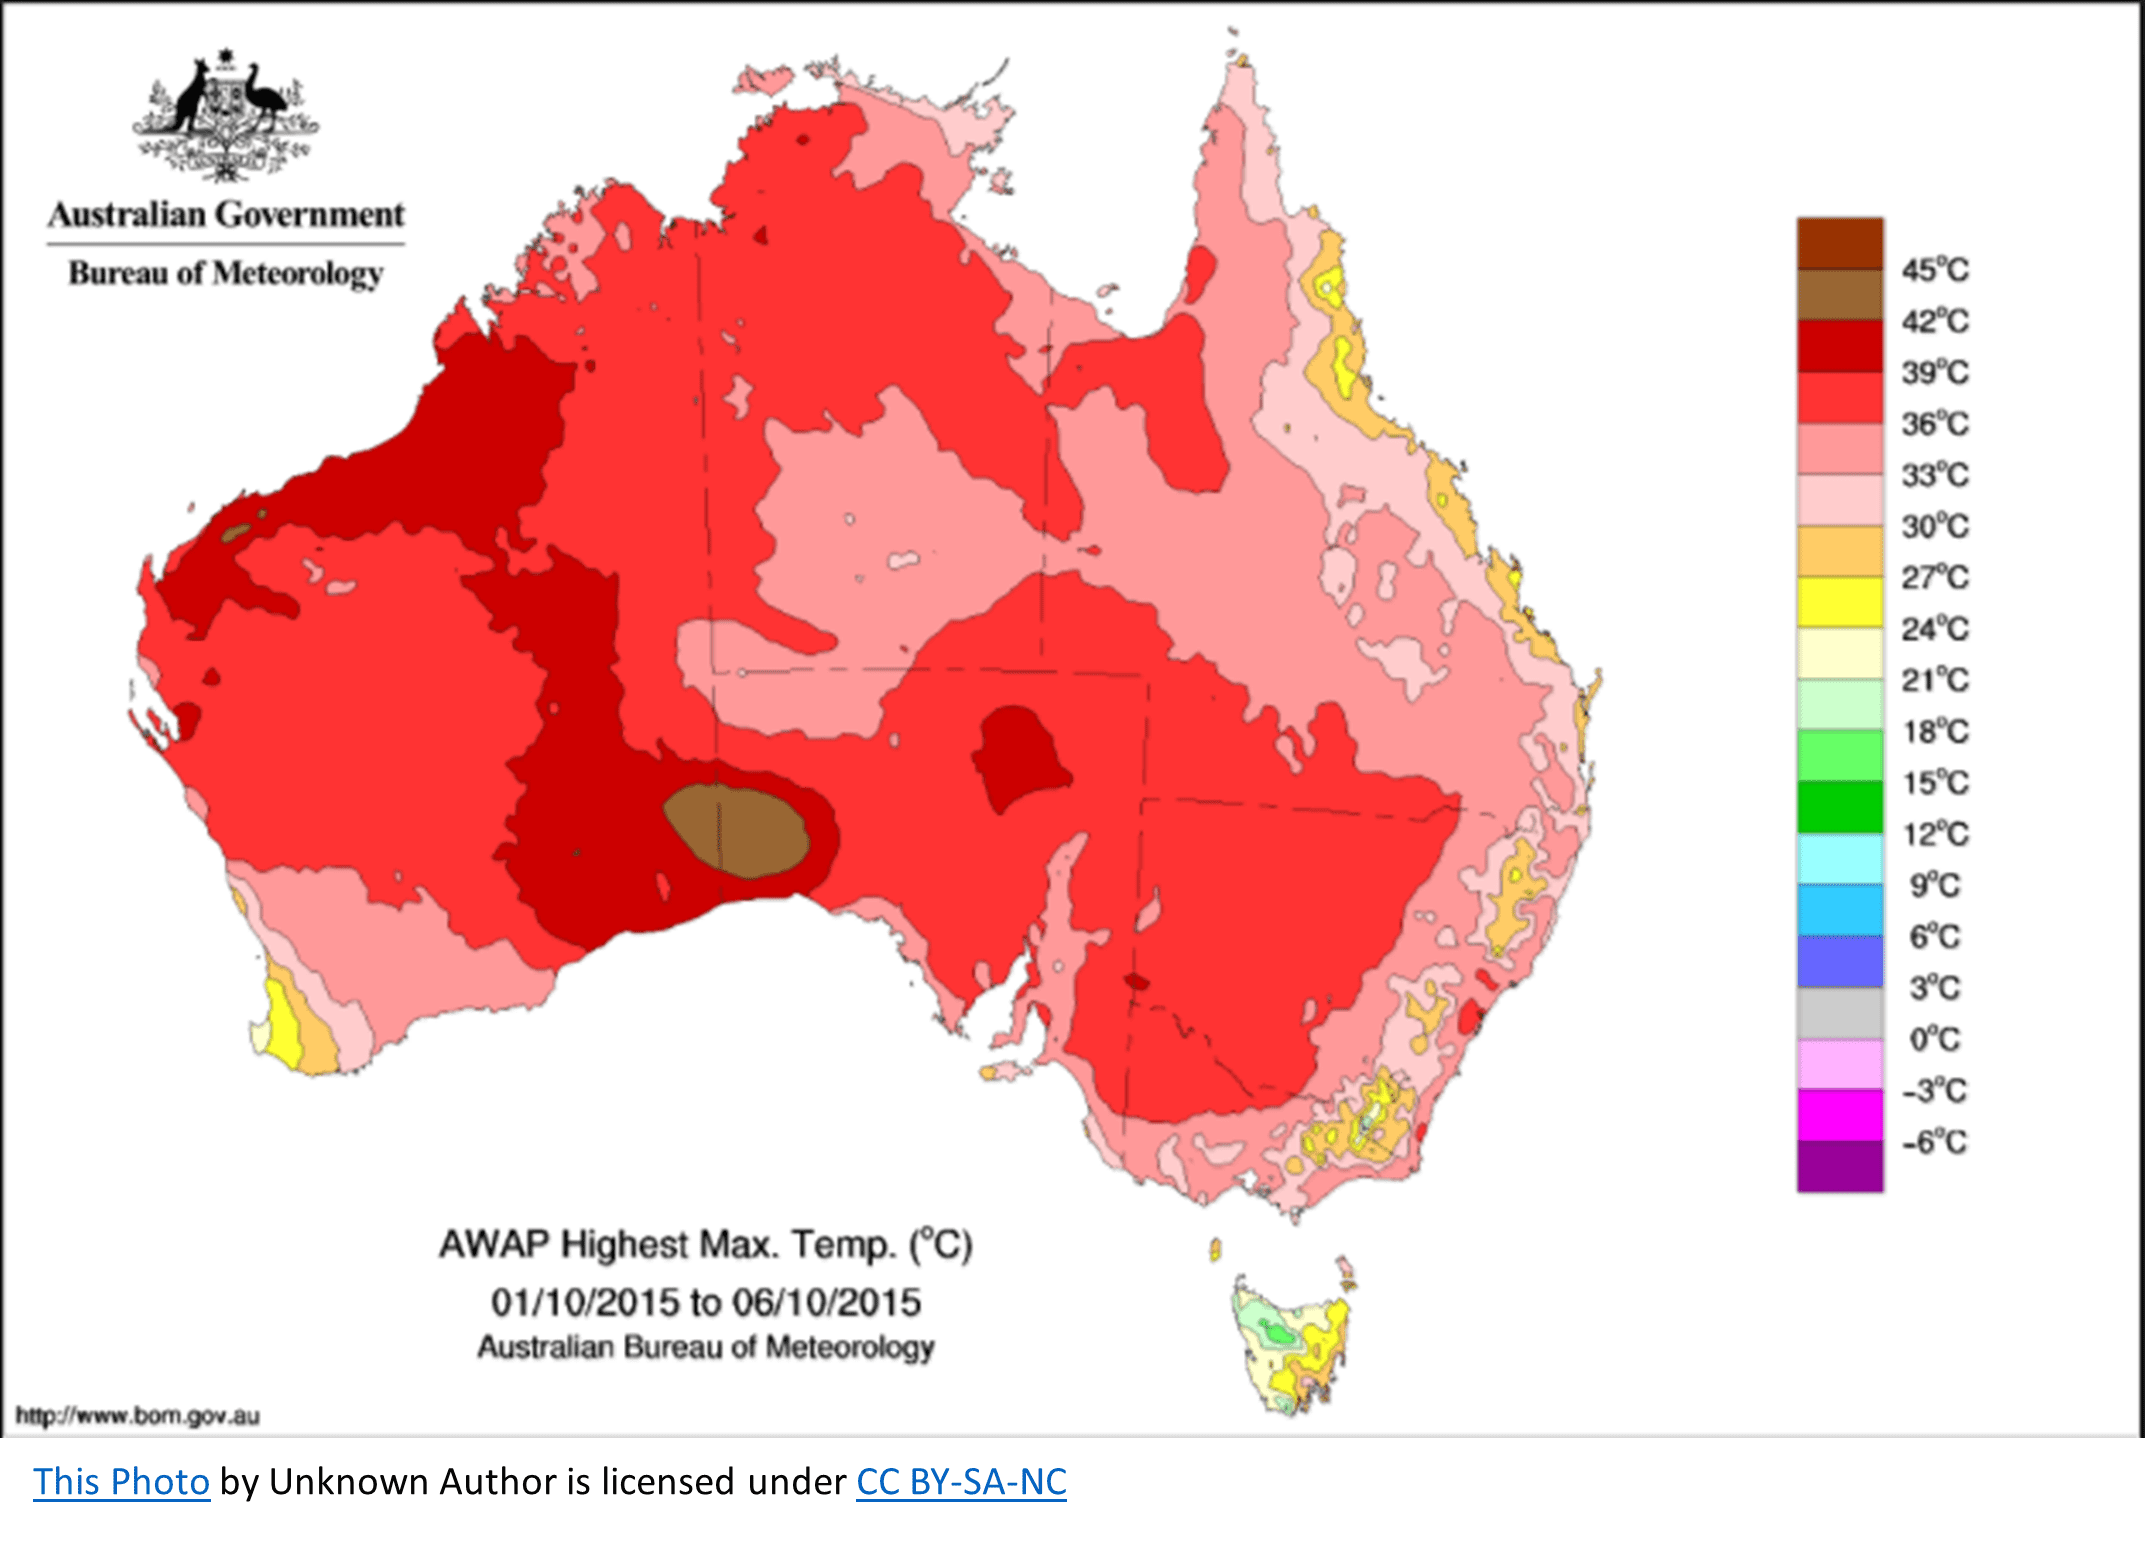
topographic map
contour lines displaying terrain/elevation changes
absolute direction
exact place one may be heading (quantitative)
absolute distance
exact distance between two places (quantitative)
relative direction
describing the location or orientation of an object in relation to another object or a reference point (qualitative)
relative distance
approximate distance between two places (qualitative)
relative location
description of a location using geographic features (qualitative)
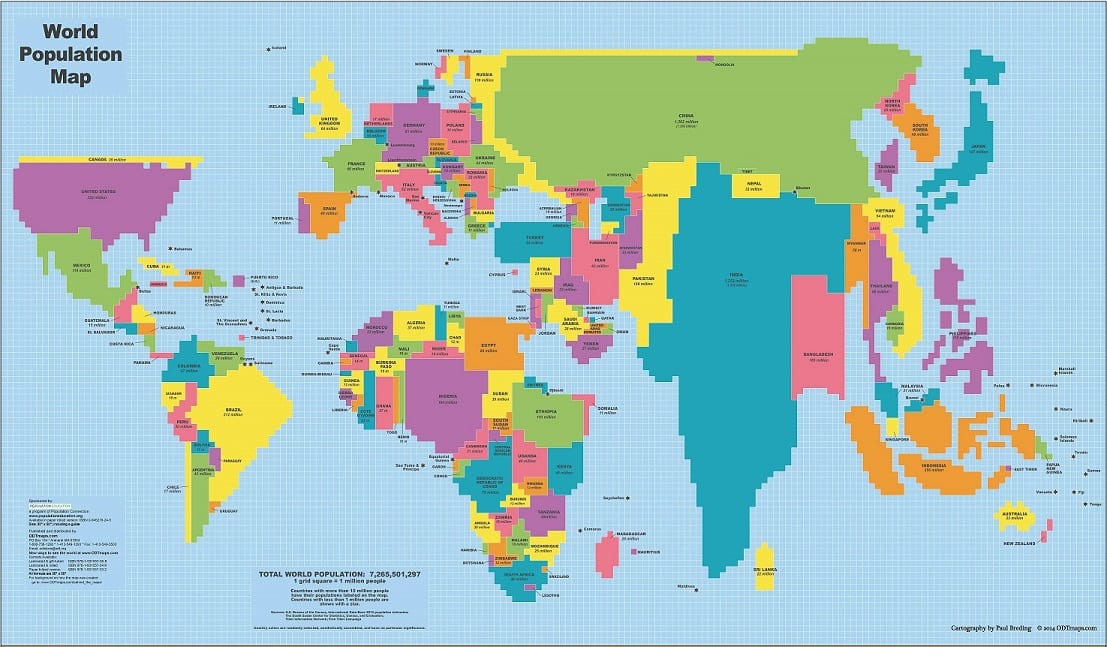
thematic map
displays spatial patterns of places and uses quantitative data to display topics
what map is this
choropleth map

what map is this
dot density map
what map is this
cartogram
what map is this
graduated symbol map
what map is this
isoline map
what map is this
flowline map
remote sensing
collecting information with satellites
geographic information systems (gis)
computer system that collects, analyzes, and displays geographic data
place
specific point on earth’s surface with one or more unique characteristics
global positioning system (gps)
network of satellites to determine location of something on earth’s surface
field observations
first hand observations
landscape analysis
studying land and how humans have altered it
photo analysis
analyzing photos
distance decay
larger distance = less interaction (however, technology reduces distance decay)
time-space compression
technology reduces space between places (counters distance decay)
spatial association
relationship of different objects in an area
physical characteristics
observable features (ex. climate/landscape)
human characteristics
attributes, behaviors, and social structures that define human populations (ex. religion, language)
sense of place
emotional connections and attachments people develop with specific locations
placelessness
no strong response to an area due to a lack of unique characteristics
site
physical/natural characteristics of a place
situation
a place's location relative to other places and its accessibility, especially in terms of transportation and connections
environmental possibilism
idea that environment does have limits, but people can overcome them
enviornmental determinism
outaged idea that environment sets possibilities for people
scale of analysis
observation of data at a global, national, regional, or local scale
scale
distance on map vs. distance on ground
state
a territory with defined boundaries organized into a political unit and ruled by an established government that has control over its internal and foreign affairs
large scale
large amount of detail and small geographic area
small scale
less detail over a large geographic area
region
geographic area with common characteristics/patterns of activity
formal (uniform) region
region defined by set boundaries (undebatable)
functional (nodal) region
an area around a node
perceptual (vernacular) region
no perfect defining boundaries, all based on beliefs
arithmetic density
total population/total amount of land
physiological density
total population/total amount of arable land (shows how much food needs to be produced per unit)
agricultural density
amount of farmers/amount of arable land
carrying capacity
max amount of people that can be supported without damaging the enviornment
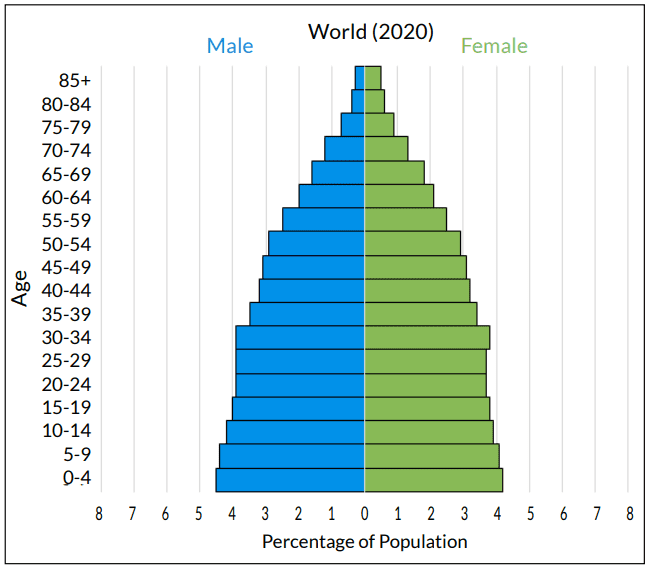
what is this
population pyramid
sex ratio
males/females multiplied by 100
dependency ratio
gives insight into how many people a society needs to support
0-14, 65+/working age population x 100
child dependency ratio
0-14/15-64 × 100
elderly dependency ratio
65+/15-64 × 100
what does cbr stand for
crude birth rate
crude birth rate
live births per 1000 people
what does cdr stand for
crude death rate
crude death rate
number of deaths per 1000 people
what does tfr stand for
total fertility rate (avg # children a woman will have)
what does imr stand for
infant mortality rate
infant mortality rate
total # deaths of children under 1 year old per 1000 births
what does rni stand for
rate of natural increase
rate of natural increase (natural increase rate)
% of population growth in a year (cbr-cdr)
doubling time
amount of time it takes for population to double
pro-natalist policies
government policies that promote birth rates
anti-natalist policies
government policies that decline birth rates
stage one of demographic transition model
high cbr and cdr, they both cancel out
stage 2 of demographic transition model
high cbr, lowering cdr due to advancements
stage 3 of demographic transition model
cbr/cdr both decrease, nir becomes moderate
stage 4 of demographic transition model
low cdr/cbr, low or flat nir
stage 5 of demographic transition model
negative nir, cbr is below cdr
stage 1 of epidemiological transition model
pestilence, famine, death
epidemic
disease spreading through region or community
pandemic
disease across multiple regions/countries
endemic
a disease stays in an area
stage 2 of epidemiological transition model
less deaths and pandemics; improved standards of life
stage 3 of epidemiological transition model
degenerative diseases (ex. cancer, human made diseases)
stage 4 of epidemiological transition model
fighting degenerative diseases, improved diet/lifestyle
stage 5 of epidemiological transition model
reemergence of infectious disease
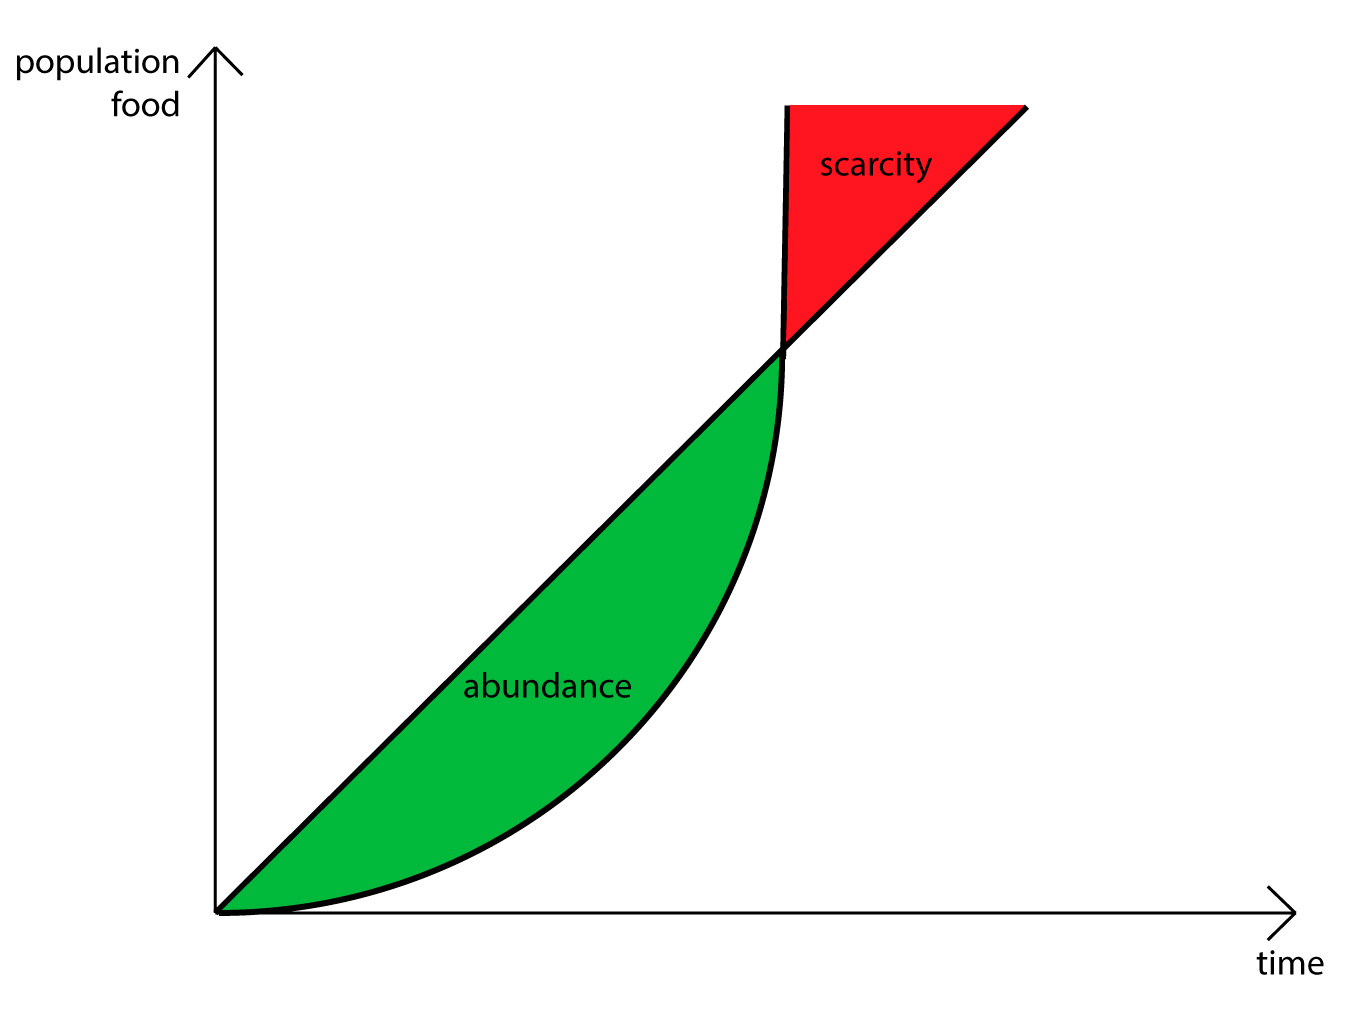
what is this
malthusian theory
malthusian theory
we will outgrow our food sources, as population grows exponentially and food grows linearly
why is malthusian theory wrong
population growth isn’t exponential and doesn’t account for advances in agriculture
neo-malthusians
believes that earth’s resources will run out eventually
what does mmr stand for
maternal mortality rate
maternal mortality rate
female deaths per 100,000 births
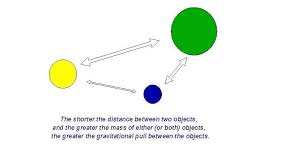
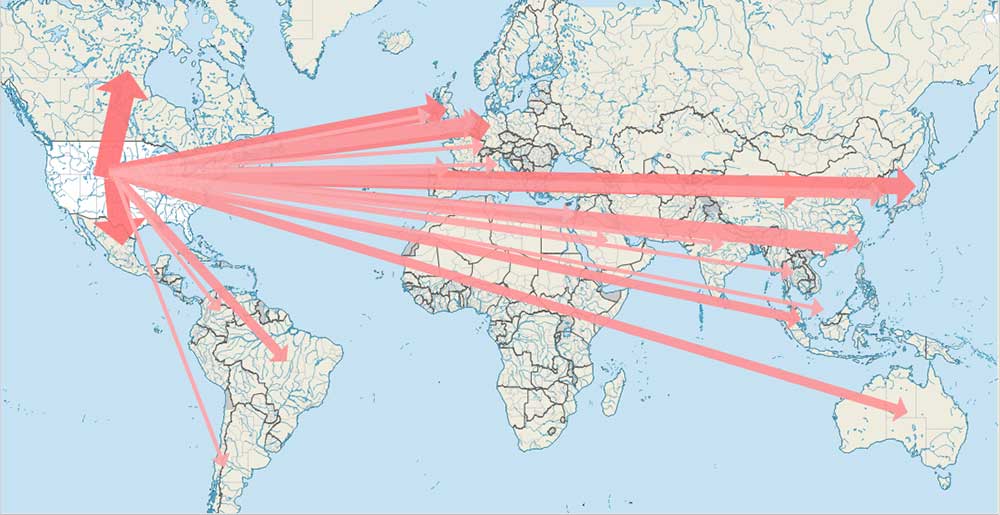
what is this
gravity model
gravity model
the larger the city, the greater the pull
ravenstein’s laws of migration
demonstrates migration patterns
pull factor
a factor that makes people want to move to a place
push factor
negative situations that force people to move
emigration
exiting out of a country
immigration
migrating into a country