3.1 - Variation and Control (1-25) 3.2 - Trial Central Lines and Trial limits (26-37) 3.3 Revised Central Lines and Revised Limits (38-48) 4.4 Alternate Control Charts (49-55)
What is variation?
Its the law of nature in that two natural items are the same. The ability to measure ariation is necessary before it can be controlled
What is ‘within-piece variation’? Give an example
Characteristics that differ in on piece. E.g. Surface roughness of a specimen or printing on one side that is darker than the other
What is ‘piece-to-piece variation’? Give an example
Among pieces produced at the same time. E.g. the intensity of light of four consecutive light bulbs produced from the same machine will be different
What is ‘time-to-time variation’? Give an example
Difference in product produced at different times in the day. E.g. Service levels differs in the morning when compared to the afternoon, or as cutting tools wear characteristic will change
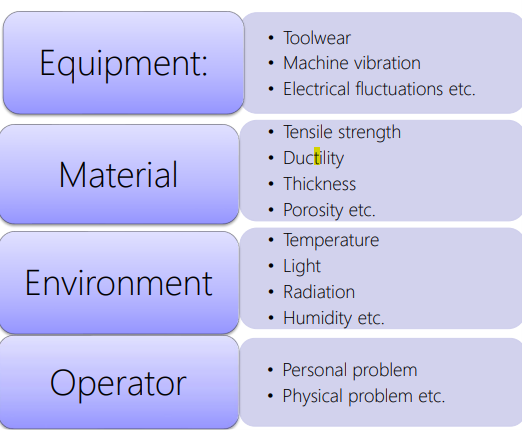
Name some variation in production processes
Inputs: materials, tools
Processes: operators, methods, machines, environment
Outputs: Measurement Instruments, Human Inspection Performance
What two types of causes can cause variation?
Change causes (random causes) or Assignable causes
What statistic of variation should inspection contribute too?
Inspection should be 1/10 th of the other 4 causes
What is Statistical control?
When only chance causes are present, the process is said to be in statistical control. The process is stable in predictable
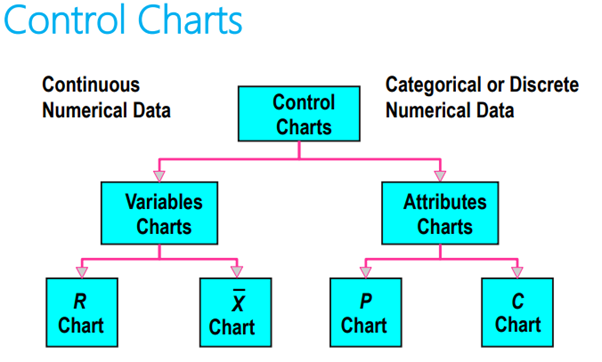
What control charts would you use for variable data?
X bar and R bar charts
X bar and R bar charts
Charts for individuals (x-charts)
What control charts would you use for attribute data?
For defectives: p chart, np chart
For defects: c-chart, u-chart
Why do we use control charts for variables?
its a mean of visualising the variations that occur in the central tendency and the mean of the set observations. Fundamentally it shows whether a process is in a stable state or not
What is UCL and LCL?
Upper control limit and lower control limit
State the features of a X bar chart
Used to record variation in average (X bar) chart value of samples
Horizontal axis: ‘subgroup number’ (which identifies a particular sample consisting of a fixed number of observations
Vertical Axis: variable
Average values are used rather than individual observation
Indicate a change in variation much faster
What are the three interpretations of a solid line through the centre of an X bar chart?
(dependant on available data)
Average of the plotted points (would be an ‘average of averages’ of X double bar)
Standard of reference value ‘X bar subscript’
Population mean (mu) that is known
What are the two dashed outer lines on an X bar chart and what do they help to judge?
The upper and lower limits - the ‘control limits’
They help to judge the significance of the variation in quality of the product/service
What are specification limits?
Permissible limits of quality characteristics of each individual unit/product
What are control limits?
Used to evaluate the variations in quality from subgroup to subgroup
How can a frequency distribution of the subgroup averages be determined?
determined with its corresponding average and standard deviation
how are control limits typically established?
plus or minus three standard deviations from the central line 9the difference between these items is 99.73%
What does it mean if a subgroup falls out of the control limits?
The process is considered to be out of control
Why are x bar chars and r charts used together?
X bar for central tendency and R chart for the dispersion
What are the ‘rules’ for reporting inspection results?
the frequency at which a product is inspected at a particular work centre is determined by the quality of the product
when the process is in control and no differences are being encountered then fewer inspections may be required
similarly if a process is out of control then more inspections are needed
If a value is above the control limits, is the process said to be out of control?
No as an individual observation is not related to the control limits, its about the subgroup average
What is the action taken if a process is out of control?
Must find assignable cause and if possible, take corrective action
What are the objectives of having control charts?
Quality improvement
To determine process capability
For realistic decisions regarding product specifications
To determine natural or unnatural patterns of variation in order to make decisions about the current production process
To help decide whether recently produced items should be released to the next phase of their sequence
What is the procedure for establishing a pair of control charts for the average x bar and the range R?
Select the quality characteristic
Choose the rational subgroup
Collect the data
Determine the trial central line and control limits
Establish the revised central line and control limits
Achieve the objective
What must a quality characteristic be?
Must be measurable (can be expressed in base units e.g length, mass, time etc)
What is a rational subgroup?
A group in which the variation within a group is due only to chance causes
‘within-subgroup’ variation is used to determine the control limits
Variation between subgroups is used to evaluate long-term stability
What is the instant-time method for selecting subgroup samples?
Select subgroup samples from product or service produced at one instant of time or as close to that instant as possible
• e.g. selecting four consecutive parts from a tray of recently produced parts would be a subgrouping technique
• Next subgroup 1 h late
What is the period of time method for selecting subgroup samples?
Select from product (or service) produced over a period of time that is representative of all of the products or services
• E.g. inspector makes a visit to a circuit breaker assembling process once every hour.
• Subgroup is 4 samples randomly selected from the previous hour of production
• Next subgroup is taken from between visits
Compare the two methods for selecting the subgroup samples
The instant-time method will have a minimum variation within a subgroup and a maximum variation among subgroups (most commonly used since it provides a particular time reference for determining assignable causes.)
The period of time method will have a minimum variation among subgroups and a maximum variation within a subgroup. (provides better overall results and will provide a more accurate picture of the quality)
Regardless of which scheme is used to obtain the subgroup, the lots from which the sub groups are chosen must be homogeneous.
• This means that the pieces/specimens are as ‘alike’ as possible- same machine, same operator, same mould etc. Homogenous lots can also be designed by equal time intervals
• Easy technique to administer
No matter how the lots are designated, the items in a subgroup should be produced in the same conditions
What factors effect the subgroup size?
As the subgroup size increases, the control limits become closer to the central value, which make the control chart more sensitive to small variations in the process average. Also the inspection cost per subgroup increases as the size increases
When destructive testing is used and the item is expensive, a small subgroup size is required
what are the ideal size for a subgroup?
From a statistical basis a distribution of subgroup averages are nearly normal for groups of 4 or more even when samples are taken from a non-normal distribution
When a subgroup size of 10 or more is used, the s chart should be used instead of the R chart.
E.g 4000 pieces (using guide is expected 75 is recommended) so 76 are inspected, subgroup size of 4 and 19 subgroups total (19×4=76)
What are the conditions for data collection?
It is necessary to collect a minimum of 25 subgroups of data
Fewer subgroups would no provide a sufficient amount of data for accurate computation of the central line and control limits
That data is then plotted, the graphical format is called a run-chart
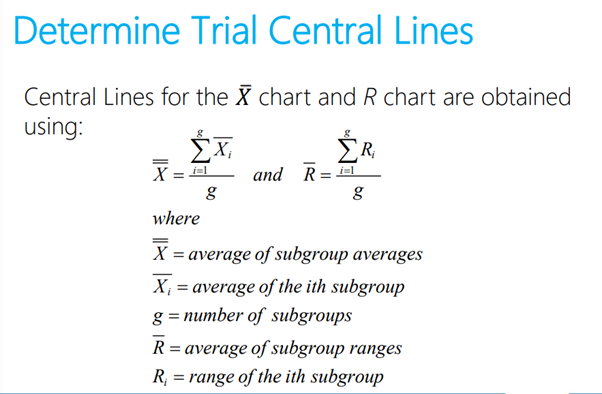
How are the central lines for x bar and r charts obtained
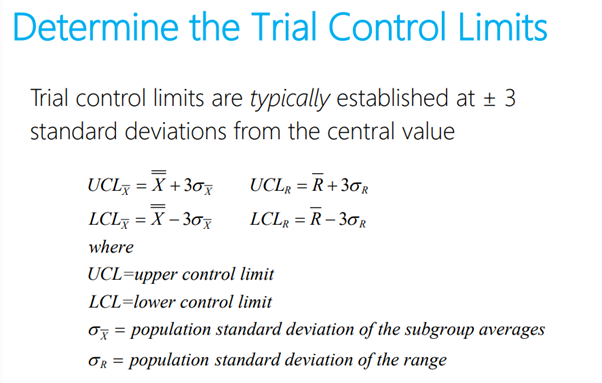
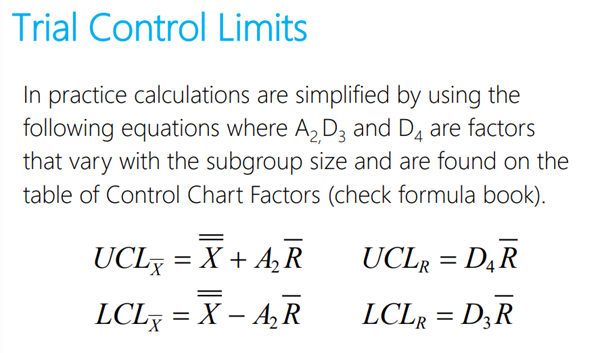
How do you calculate the trial control limits? (WITHOUT formula book)
How do you calculate the trial control limits? (WITH formula book)
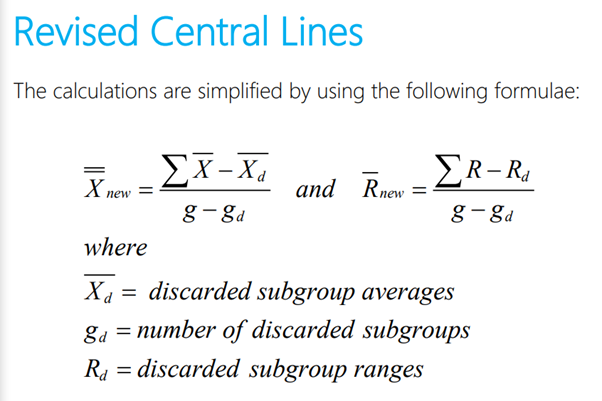
How do you establish and the revised central line an control limits?
post the preliminary data to the chart along with the control limit lines and central line.
adopt standard values (𝑋 bar subscript 0 and R subscript 0 ) for the central line (more appropriately stated as the best estimate of standard values with the available data
If an analysis of the preliminary data shows good control, then 𝑋 bar subscript 0 and 𝑅 subscript can be considered as representative of the process and these become the standard values 𝑋0 and R0
How can you tell if there is ‘good control’ when revising the central line and control limits?
when there are no out of control points and no unusual patterns of variation
NOTE: most processes are not in control when first analysed
How do you determine whether the central line and control limits are stable?
Analyse the R chart. If the points that are out of control have assignable causes (e.g. a damaged oil line) then it can be discarded from the data. The remaining plotted points would then indicate to a stable process.
What do you do after you have analysed the R chart?
Analyse the x bar chart. If only one subgroup is out of control with no assignable causes (perhaps like others) then it can be assumed that is is due to chance and is part of natural variation
New ‘X bar bar’ and ‘R bar’ values are calculated with the remaining data (that hasn’t been discarded for assignable causes).
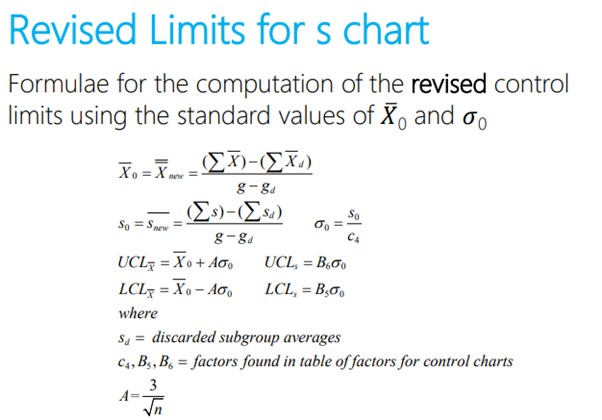
How do you calculate revised central lines?
What are the two rules when discarding data?
If either the 𝑋ത or R value of a subgroup is out of control and has an assignable cause, both are discarded.
Only the out of control value of a subgroup is discarded (from that particular chart)
What is the impact of more data becoming available?
As more data becomes available, better estimates or more confidence in the existing standard values are obtained.
(The objective is to obtain the best estimate of these standard population standard values)
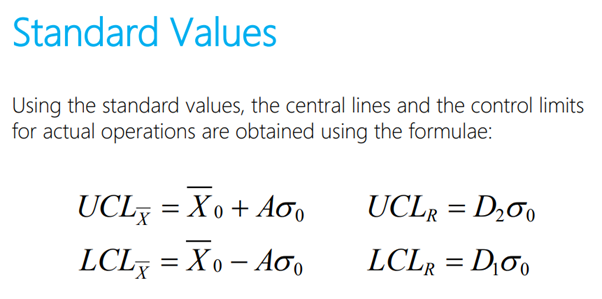
How do you calculate the upper and lower limits using standard values?
How do you use standard values?
The central lines and control limits are drawn on the charts for the next period (shown in next slide)
To illustrate, the trial control limits and revised control limits are shown on the same chart
The limits for the 𝑋 bar and R chart became narrower
When should control charts be used in practice?
it needs to be in a conspicuous place where it can be seen by operators and supervisors
What final considerations are appropriate about control charts?
By discarding out of control points with assignable causes, the central line and control limits are more representative of the process. The parameter σ subscript 0 is now available to obtain the initial estimate of the process capability (6σ0 )
What happens when control charts are introduced into the workplace?
usually an improvement in the performance
initial performance is noticeable when the process is on the skill of the operator
posting a control chart can act as a trigger to the operator to improve performance
often a reduction in the range
What should you do after posting the control charts in the workplace?
Standard values should be re-examined to determine whether any changes have occurred
Re-evaluation should be carried out every 25 subgroups and comparisons made
How do you know if there have been improvements after posting the charts?
if the points that fell outside of the control limits were addressed and were prevented from occurring again
Quality improvement has occurred when the plotted points of the 𝑋 bar chart, converge on the central line
… or when the plotted points on the R chart trend downwards
What should happen when the objective has been achieved?
When the objective for initiating the charts has been achieved, its use should be discontinued or the frequency of inspection substantially reduced to a monitoring action.
Efforts should then be directed toward the improvement of other quality characteristics
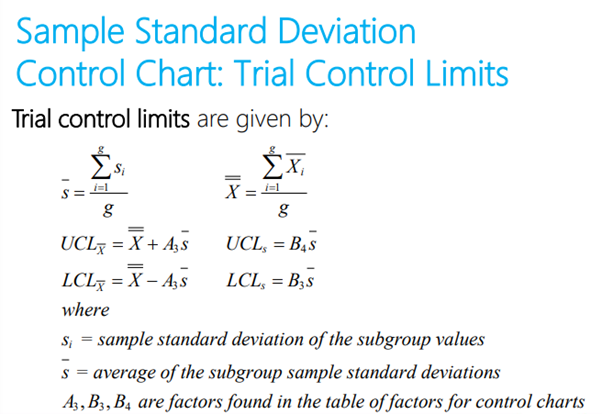
What is the ‘sample standard deviation control chart’?
Although 𝑋 bar and R Charts are the most common charts for variables, some organisations prefer the sample standard deviation (s) as the measure of subgroup dispersion
Comparing an R chart with an ‘s chart’:
• R chart is easier to compute and explain
• Subgroup sample standard deviation calculated from all data (rather than just the high and the low)
‘s chart’ is more accurate than an R chart
A subgroup size of 10 or more – extreme values will have a large influence on the R chart
In large subgroup sizes (>10), the ‘s chart’ should be used
How do you calculate the control limits for a sample standard deviation chart?
How do you calculate the REVISED control limits for a sample standard deviation chart?