10. Visualizing Network Graph Data
1/29
There's no tags or description
Looks like no tags are added yet.
Name | Mastery | Learn | Test | Matching | Spaced | Call with Kai |
|---|
No study sessions yet.
30 Terms
What characterizes graph (network) data?
Graph data represents relations between data items.
Nodes represent entities, edges represent relationships.
The structure itself is often more important than individual attribute values.
When do we speak of a tree instead of a general graph?
When the graph has no cycles and expresses a hierarchical parent-child structure, typically with a single root.
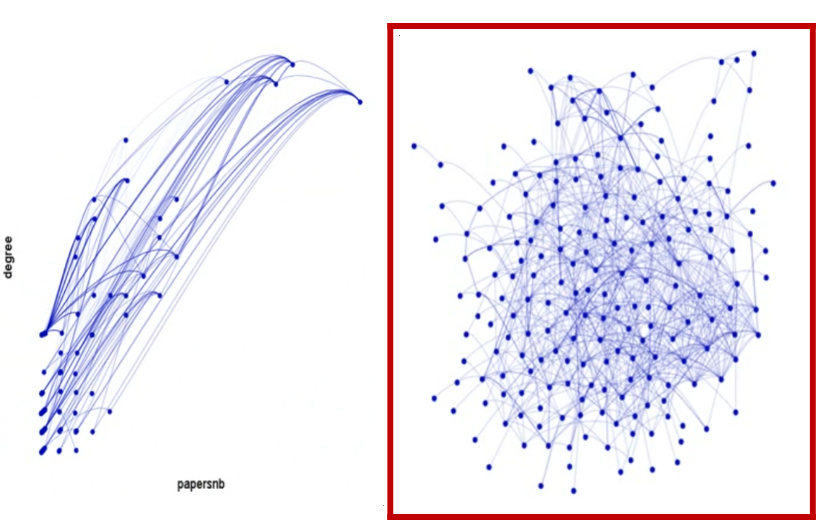
What is the difference between data values and data relations in visualization?
Data value visualizations focus on numerical attributes (e.g., scatterplots) while graph visualizations prioritize relationships, using structure to determine layout rather than attribute values.
What are the fundamental terms used in graph visualization?
Node (data item), edge (relation), degree (number of connections), weight (numerical attribute), root, parent, child, sibling, leaf, branching factor
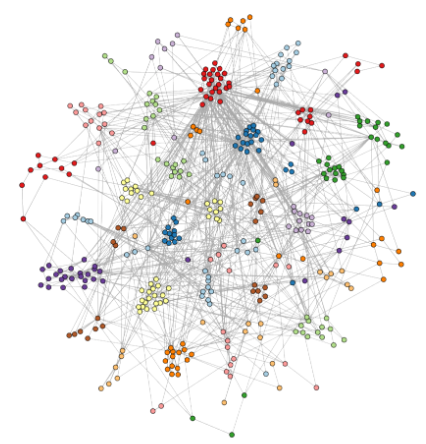
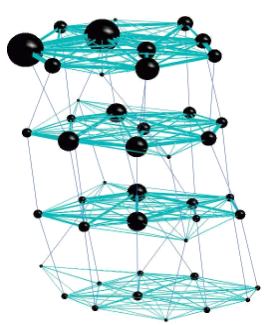
What is a node-link diagram?
A visualization where nodes are drawn as points and edges as lines, explicitly showing relationships between entities.

What makes a good node-link diagram?
Few edge crossings, few bends, compact area, reasonable aspect ratio, visible symmetries, and preferably uniform edge lengths.
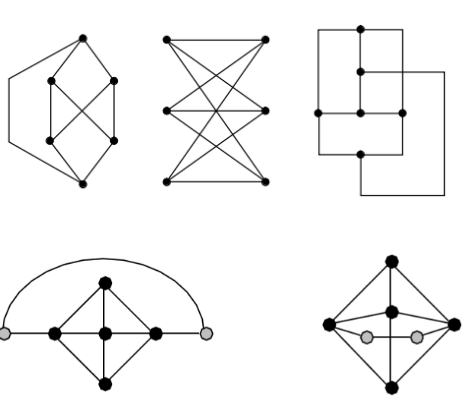
Why are edge crossings problematic?
They increase clutter and introduce ambiguity, making it easier to misinterpret which nodes are connected.
Why can layout criteria for node-link diagrams conflict?
Optimizing one criterion (e.g., minimizing crossings) can worsen others (e.g., uniform edge length), so trade-offs are unavoidable.
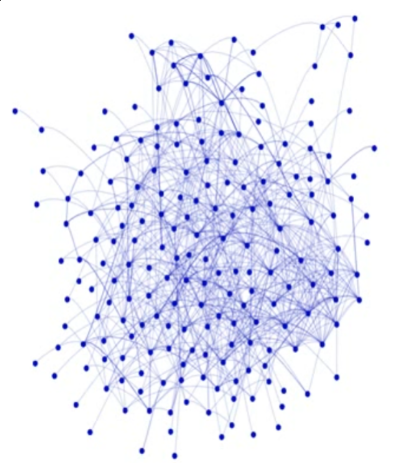
What is the main idea behind force-directed graph layouts?
Nodes are treated as physical objects: edges act as springs pulling nodes together, while nodes repel each other to avoid overlap.
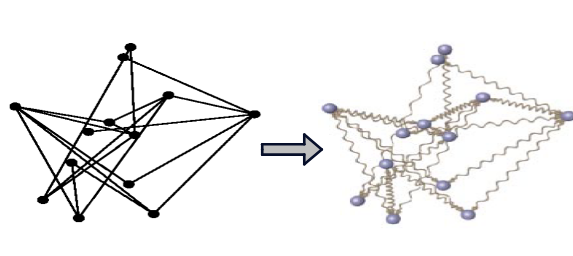
Which physical metaphors are used in force-directed layouts?
Attractive forces inspired by Hooke’s law (springs) and repulsive forces inspired by Coulomb’s law (electrostatic repulsion).
Why are repulsive forces necessary in force-directed layouts?
Without repulsion, all nodes would collapse into a single point due to attraction alone.
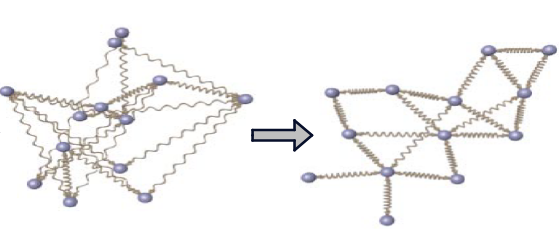
What role does simulated annealing play in force-directed layouts?
It gradually reduces node movement over time, allowing large adjustments early and fine-tuning later, leading to a stable layout.
What is the “cooling rate” in simulated annealing?
A parameter that controls how quickly node movement is reduced, influencing convergence speed and layout stability.
How can force-directed layouts incorporate cluster information?
By adding extra forces that pull nodes of the same cluster together and push nodes of different clusters further apart.
Why are force-directed layouts considered flexible?
Because additional semantic information can be encoded simply by adding new forces to the simulation.
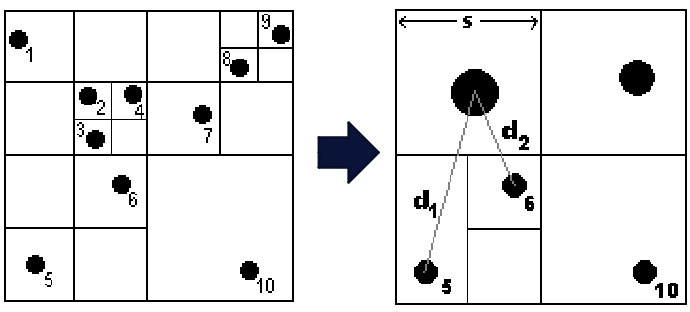
What is the computational drawback of basic force-directed layouts?
They have quadratic time complexity, since repulsive forces must be computed for all node pairs.
How does the Barnes-Hut optimization improve performance?
It approximates forces from distant nodes using a quadtree, reducing the number of force calculations.
Why is layout stability important for dynamic or streaming graphs?
To preserve the user’s mental map, preventing nodes from jumping unpredictably between time steps.
Name techniques used to stabilize dynamic force-directed layouts.
Inter-timeslice edges, pinning, and aging - each limits node movement based on temporal consistency.
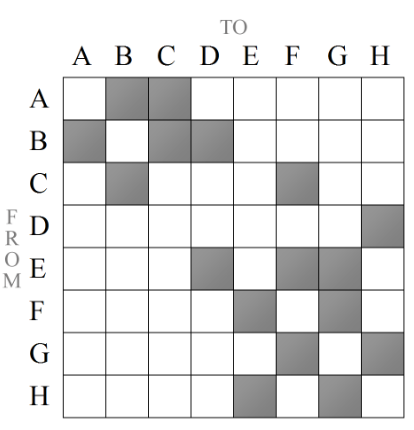
What is a matrix visualization of a graph?
A visualization of the adjacency matrix, where rows and columns represent nodes and cells represent edges.
When are matrix visualizations preferable to node-link diagrams?
For dense graphs or when focusing on edge attributes, where node-link diagrams would be cluttered.
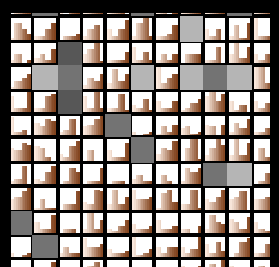
What advantage do matrix visualizations have for edge-centric data?
They allow rich encodings inside cells (e.g., color, glyphs), which is difficult with simple lines.
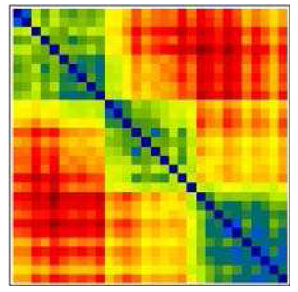
Why is ordering crucial in matrix visualizations?
Without proper ordering, structural patterns such as clusters remain invisible.
What is a Robinson matrix?
A matrix where values do not increase as one moves away from the main diagonal, revealing clustered structure.
How is matrix ordering formulated computationally?
As an optimization problem that minimizes Robinson violations using different cost functions (e.g., count, sum).
What are implicit graph layouts?
Layouts where relationships are encoded through node positioning rather than explicit edges.
What implicit representations are used for general graphs?
Interval representations and permutation diagrams, where overlap or crossing implies relationships.
How can trees be represented implicitly?
Through adjacency (icicle plots, sunbursts), inclusion (treemaps), or overlap (cascaded treemaps).
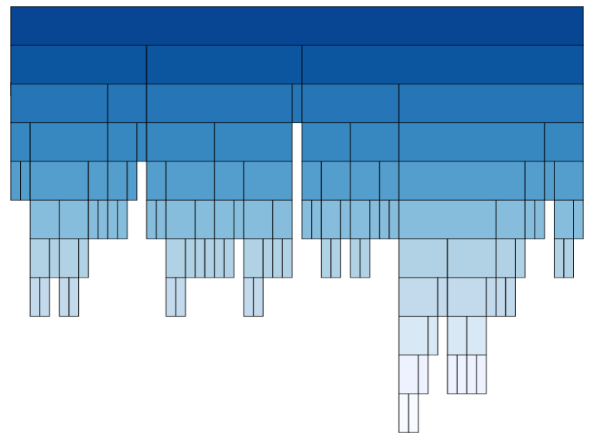
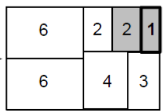
What problem does the squarified treemap solve?
It avoids extreme aspect ratios by arranging regions to be as close to square as possible.
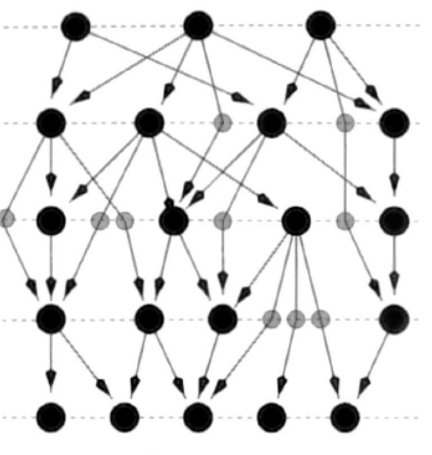
Why is the Sugiyama framework used for partially ordered sets?
Because it preserves hierarchical direction in directed acyclic graphs through layering, crossing minimization, and coordinate assignment.