extra things: distribution, histograms, psychology and the economy
 Call Kai
 Learn
Learn Practice Test
 Spaced Repetition
 Match
Match Flashcards
 Knowt Play
1/8

There's no tags or description
Looks like no tags are added yet.
Name | Mastery | Learn | Test | Matching | Spaced | Call with Kai | Chat |
|---|
No analytics yet
Send a link to your students to track their progress
9 Terms
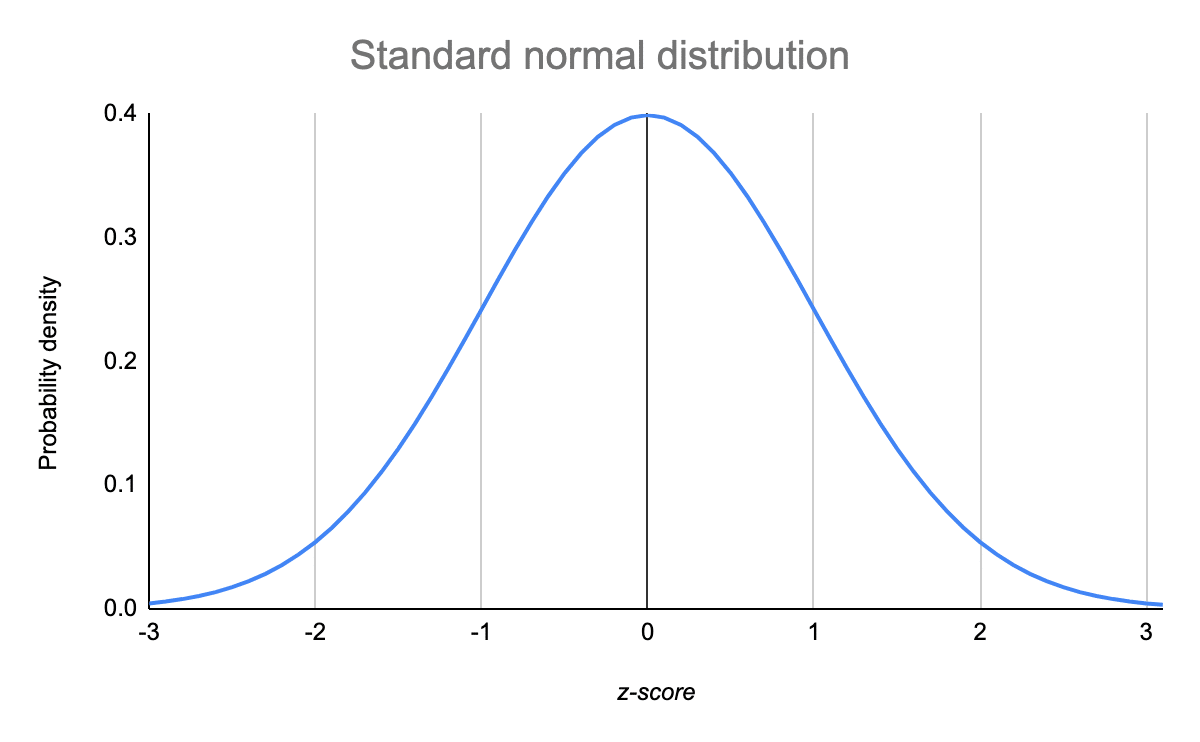
what is a normal distribution and sketch a graph
the mean is the same as the mode and median
representative sample
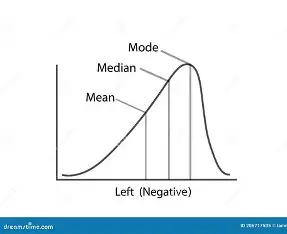
what is a negatively skewed distribution and sketch a graph
if the mean is less than the median and mode
not a representative sample/ anomaly
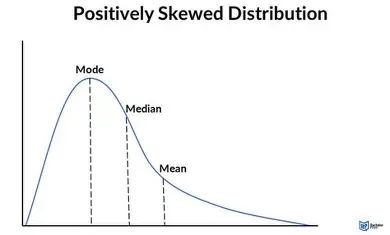
what is a positively skewed distribution and sketch a graph
if the mean is more than the median and mode
not a representative sample/ anomaly
what is the difference between a bar chart and a histogram
bar chart: categorical, unrelated data
histogram: plot of continuous data- do not leave gaps between bars
how to chose which method of central tendency/ dispersion to use
Central tendancy
mean: sensitive- interval data
median and mode: less sensitive- ordinal/nominal data
dispersion
range: less sensitive- ordinal/nominal data
standard deviation: sensitive- interval data
economic implications of psychological research: mental health
treatments (drugs, CBT etc) →increase functioning → allow them to work → pay taxes → reduces economic burden (benefits)
links to:
approaches
schizophrenia
forensics
psychopathology
economic implications of psychological research: social influence
social change (laws/ policies)
minority influence: research on things like smoking → reduces economic burden on healthcare
economic implications of psychological research: attachment
multiple attachments (schaffer and emmerson): childcare → mums can work (good), mat pay (bad)
IWM- good PIES development (the work/taxes cycle)
economic implications of psychological research: memory
EWT and cognitive interviews
reduces costs involved during criminal justice system
less time wasted/ cost wasting
prison- cant commit other crimes- less money wasted on other crimes