Unit 1 - Thinking Geographically
1/63
Earn XP
Description and Tags
Name | Mastery | Learn | Test | Matching | Spaced |
|---|
No study sessions yet.
64 Terms
Spatial
How things are distributed in a space
ESPN
Economic, Social, Political, Environmental
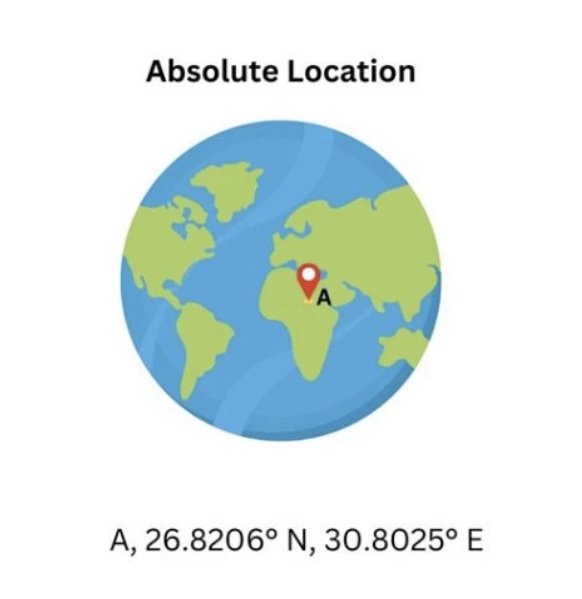
Absolute Location/Distance
Exact location; coordinates. Quantitative, similar to site
Relative Location/Distance
Location of an object in relation to another object. Qualitative, similar to situation.

Sense of Place
Peoples perception of a place
Distance Decay
Function that explains how the farther away 2 places are, the less interconnected they will be; modern technology has decreased the impact of distance decay
Time-space compression
Technology compresses the effect of distance decay between two areas by reducing the time it takes to send an idea (communication) or a product over to another place.
Pattern vs Process
Pattern - how objects are arranged in space.
Process - the “why of where,” why the pattern occurs
Reference Maps
Informational, often displaying physical and man made features
Thematic Maps
Shows quantitative data, such as density and distribution, and tell the story of its title
Types of Thematic Maps
Choropleth, Dot distribution, Graduated Symbol, Isoline, and Cartograms
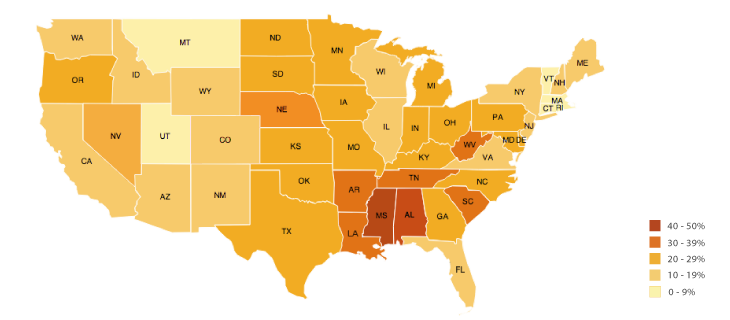
Choropleth
Colors and shading to show quantitative data, shows density but not distribution
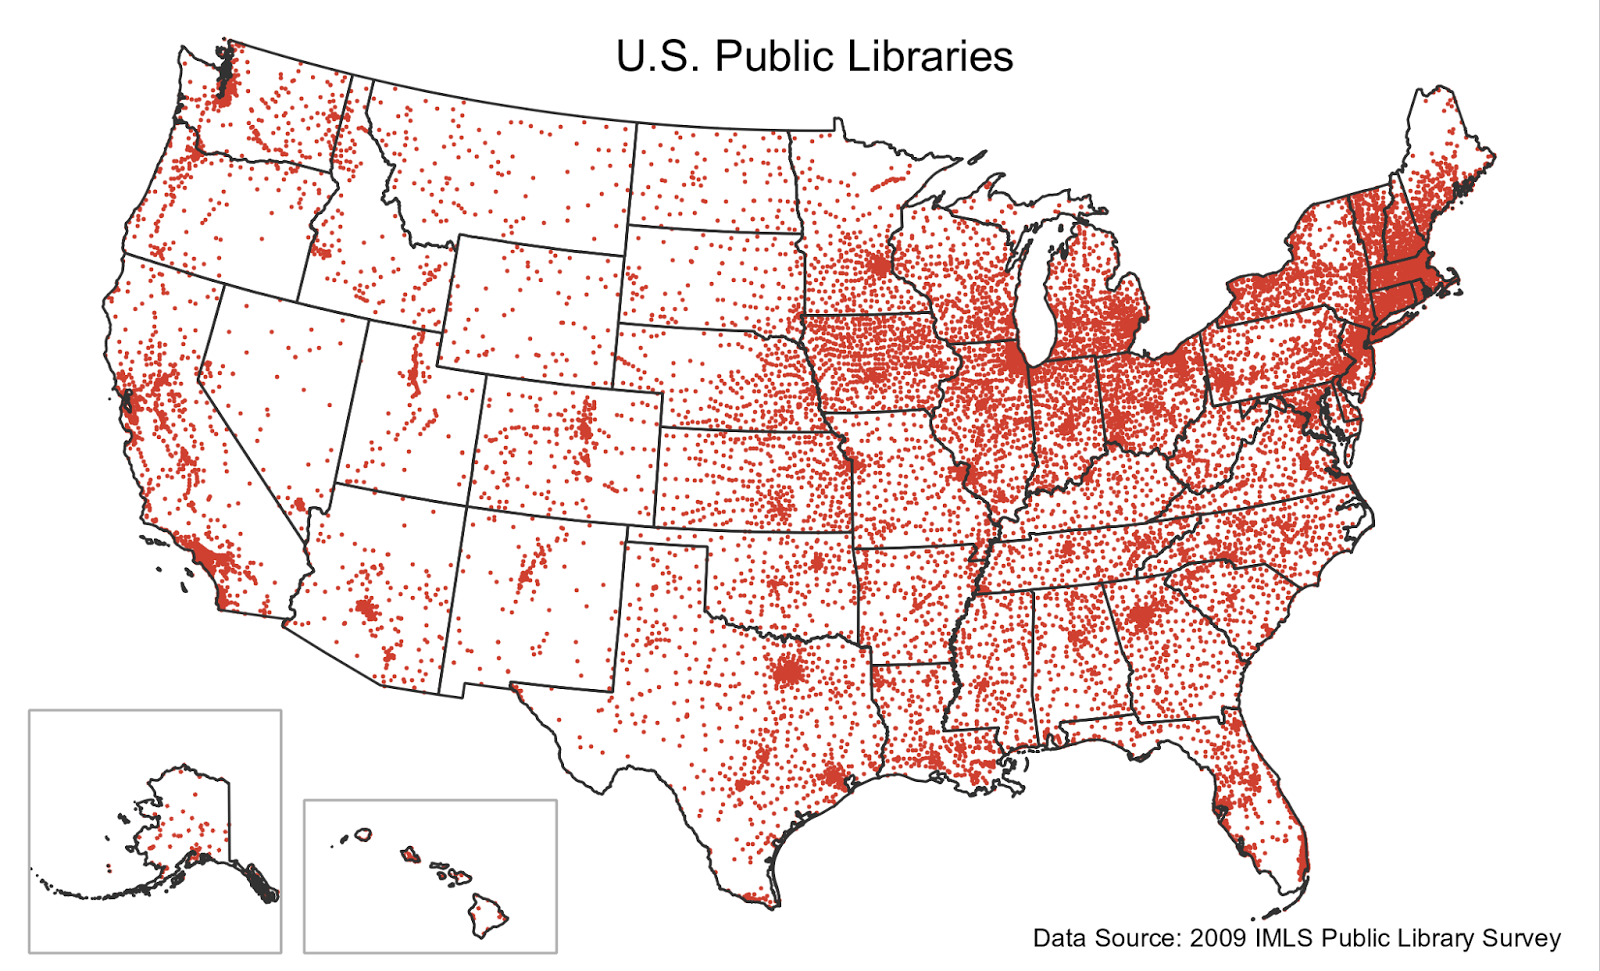
Dot Distribution Map
Each dot represents a value in its approximate location, shows distribution but density is hard to see
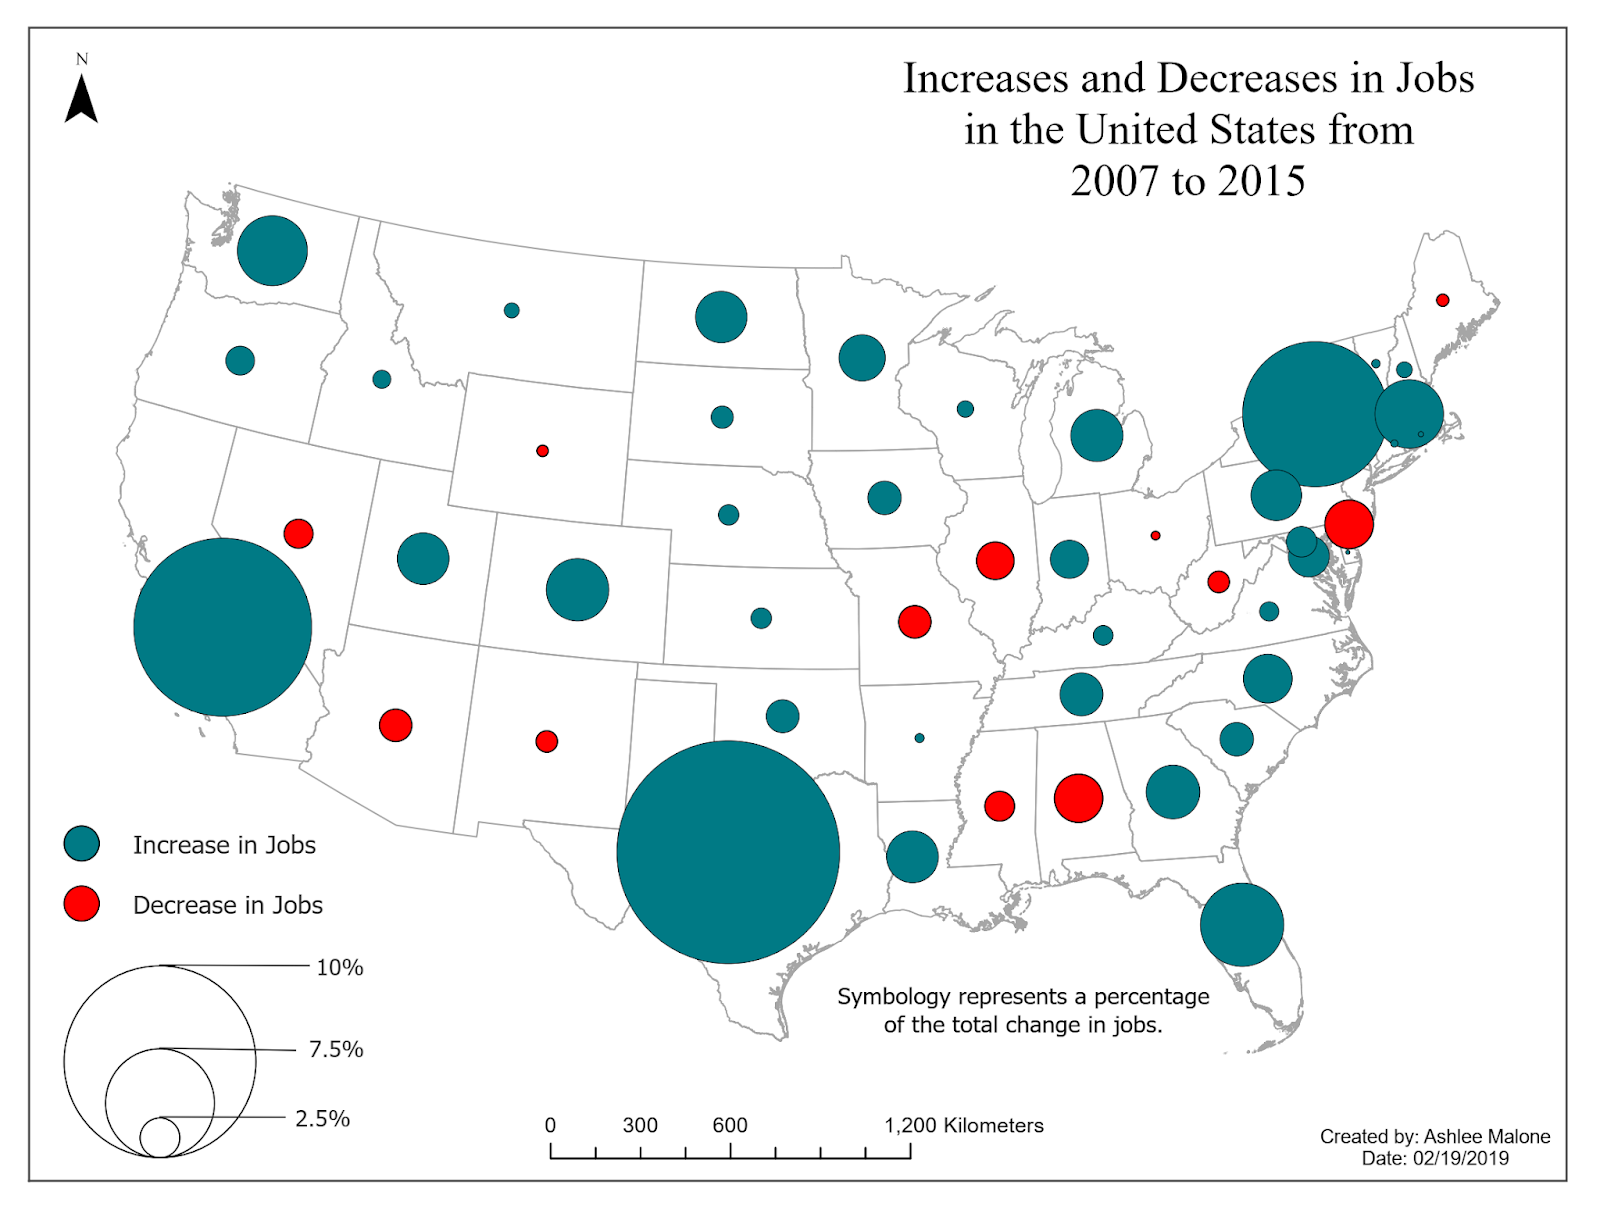
Graduated Symbol Map
Symbols that represent data, larger symbols representing more of an object
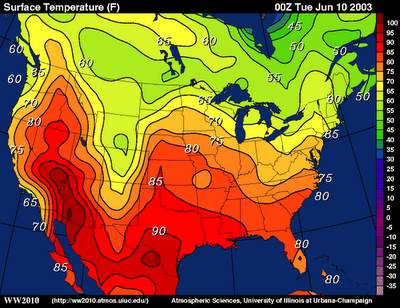
Isoline Map
Have different shades or lines dividing areas that have different amounts of an occurrence
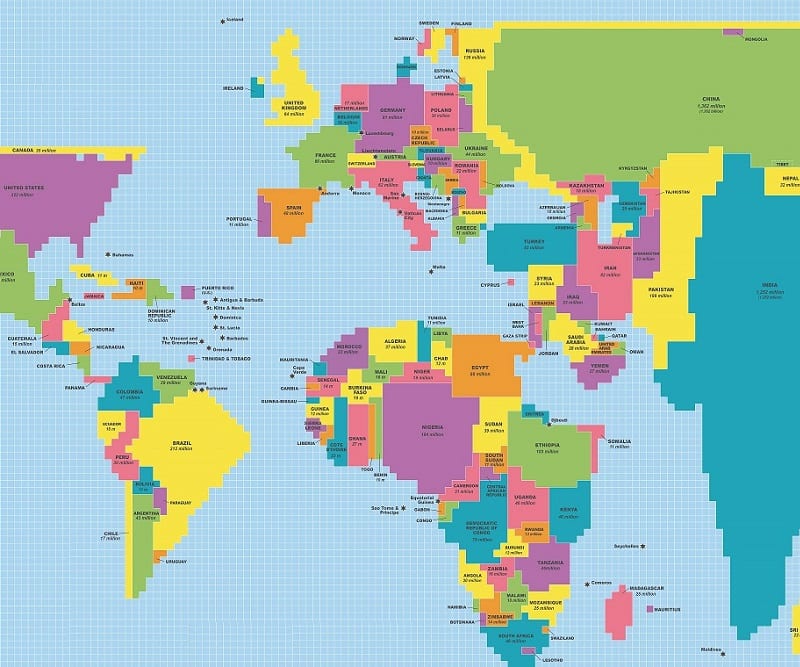
Cartograms
Shows spaces with more measured objects as bigger, without care for geographic size
Types of Spatial Patterns represented on Maps
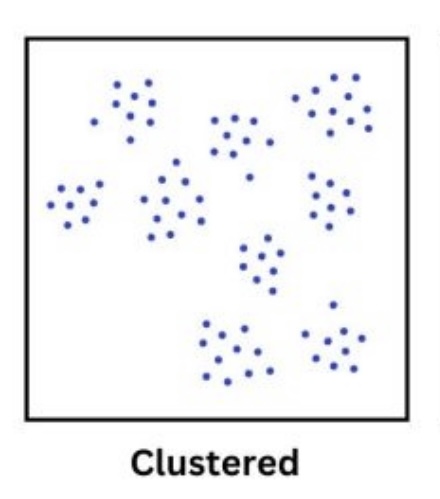
Clustered data, Dispersed data, Uniform patterns, and Random data
Clustered Data
Data is mostly clumped in a singular area or spot
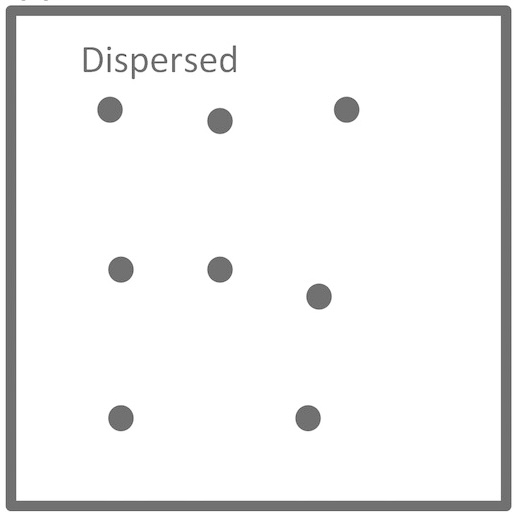
Dispersed Data
Data is spread across the space
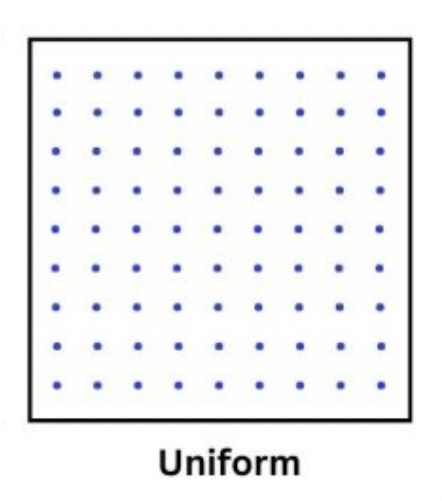
Uniform Patterns
All data is evenly distributed within the space
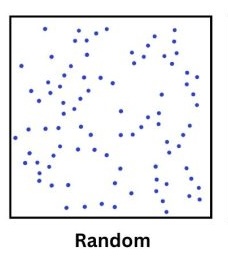
Random Data
There is no observable pattern to the data, it is just randomly anywhere
Map Projections Traits
All Map Projections must have distortions because a curved object, Earth, can not be 100% accurately displayed on a flat image
Conformal Projections
Retain the shape of objects but distort size
Equal-Area Projections
Distort Oceans to retain the size of landmasses
Types of Map Projections
Mercator, Gall-Peters, Robinson, and Goodes
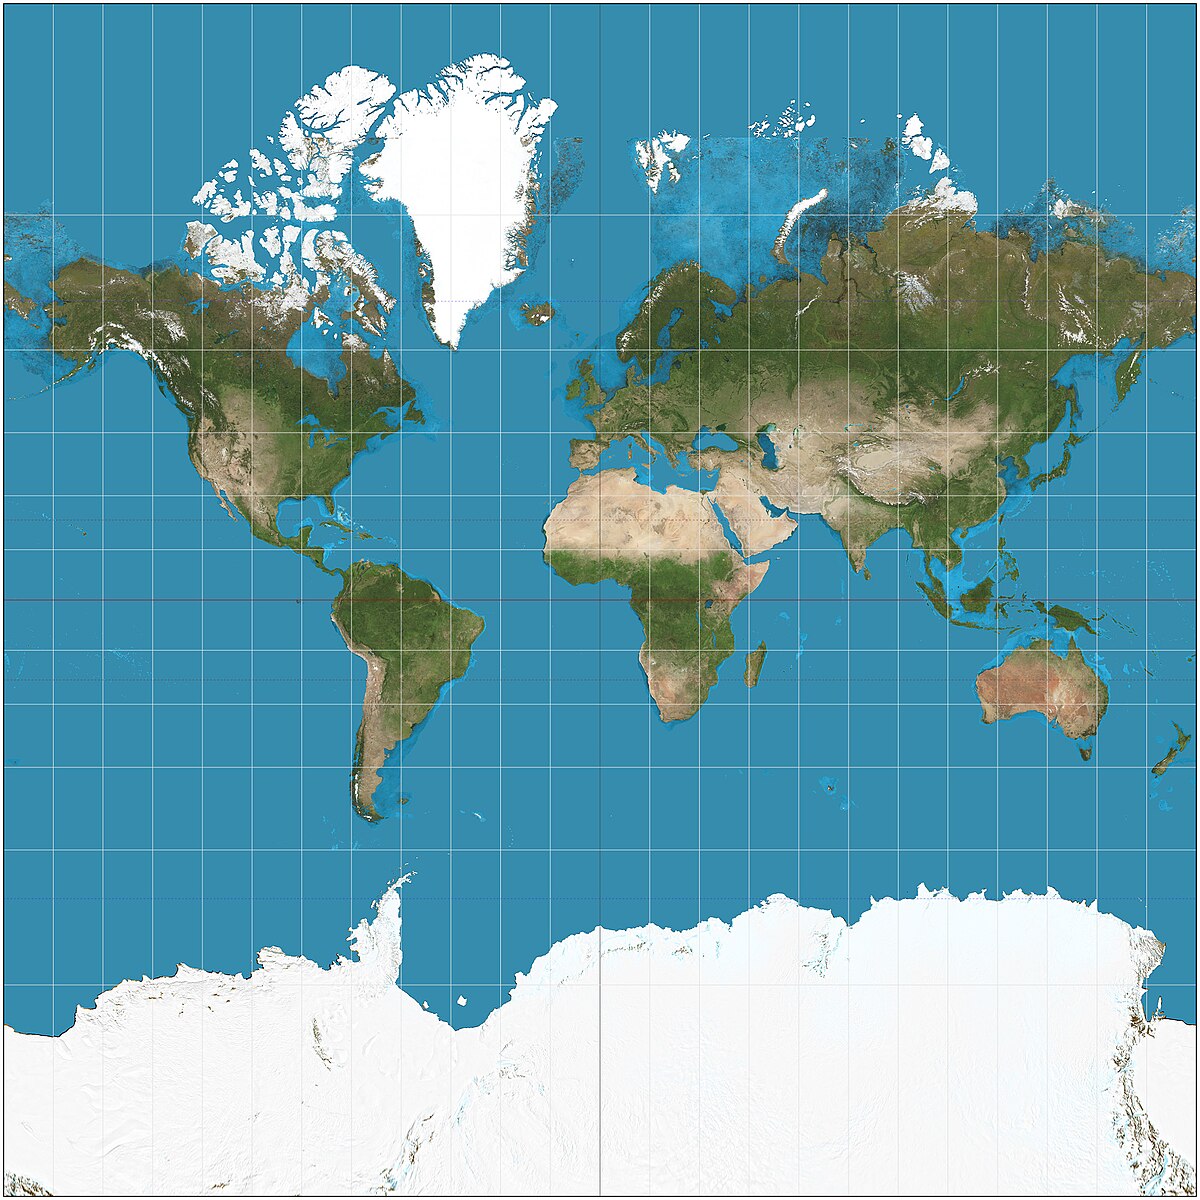
Mercator
Show latitude and longitude at right angles, preserve shape of objects, but massively distorted size at higher latitudes; are used in navigation
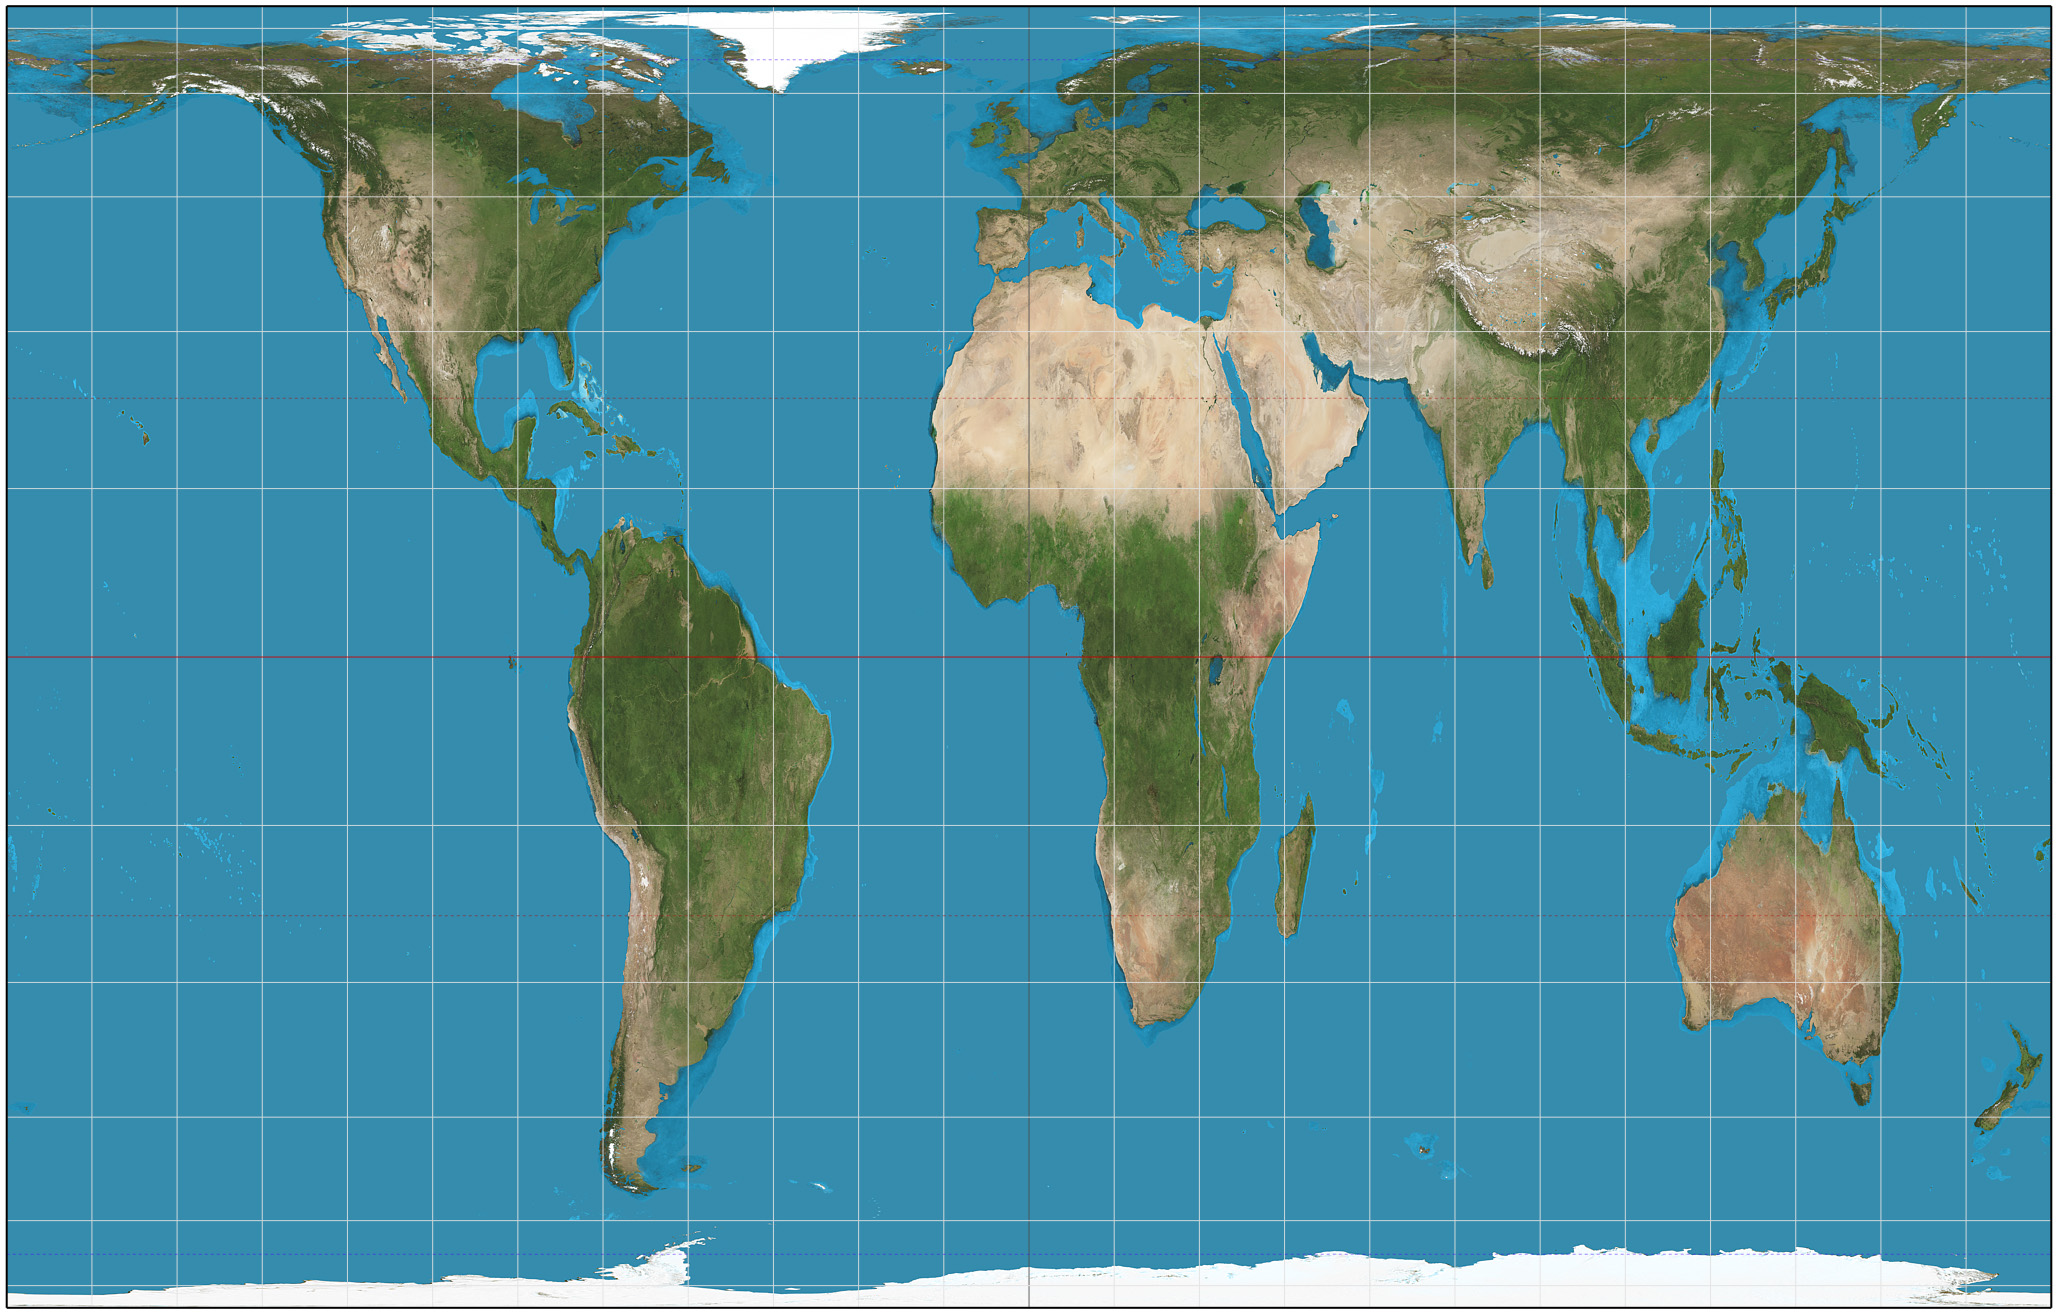
Gall-Peters
Preserve size but distort shape by stretching and compressing
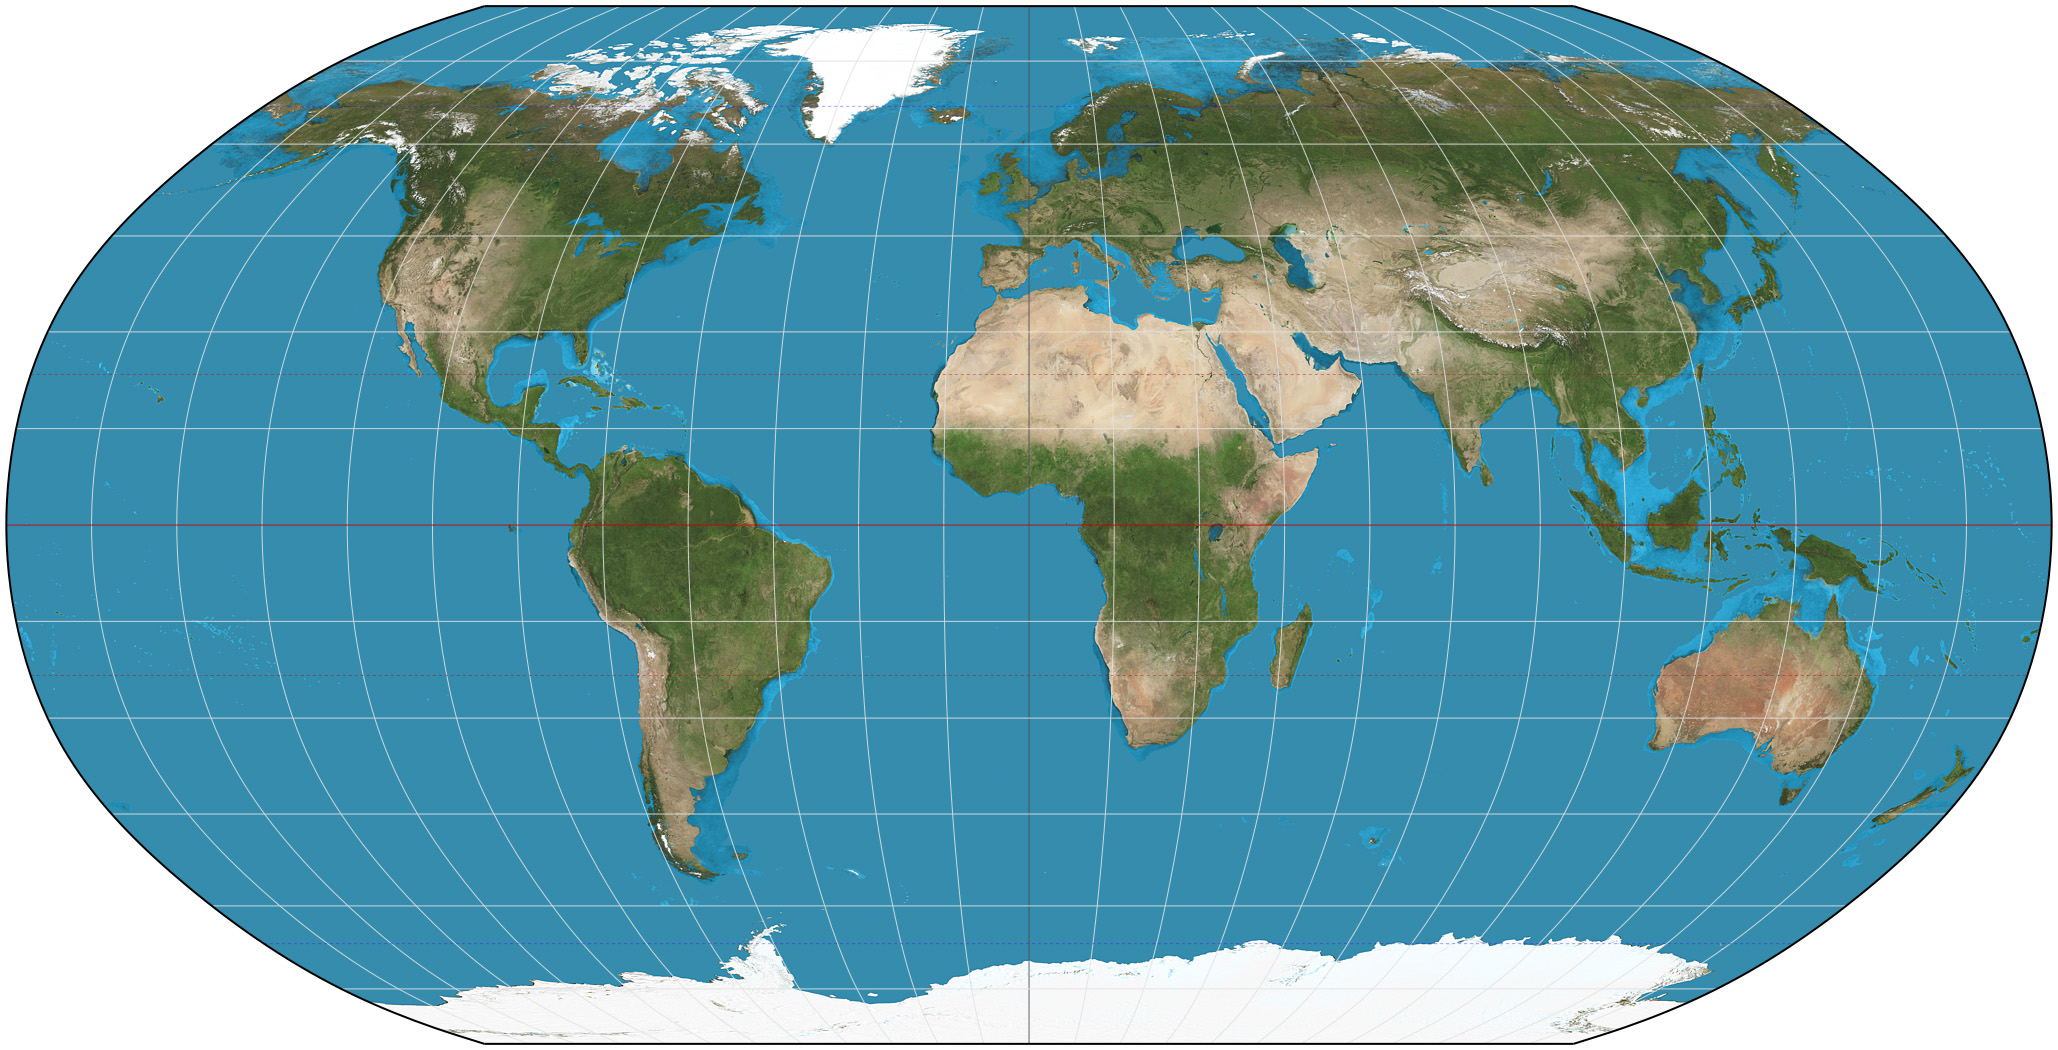
Robinson
Preserved size and shapes of continents, but distort polar areas a little, but better than Mercado in those areas; are compromise projections and are used in atlases
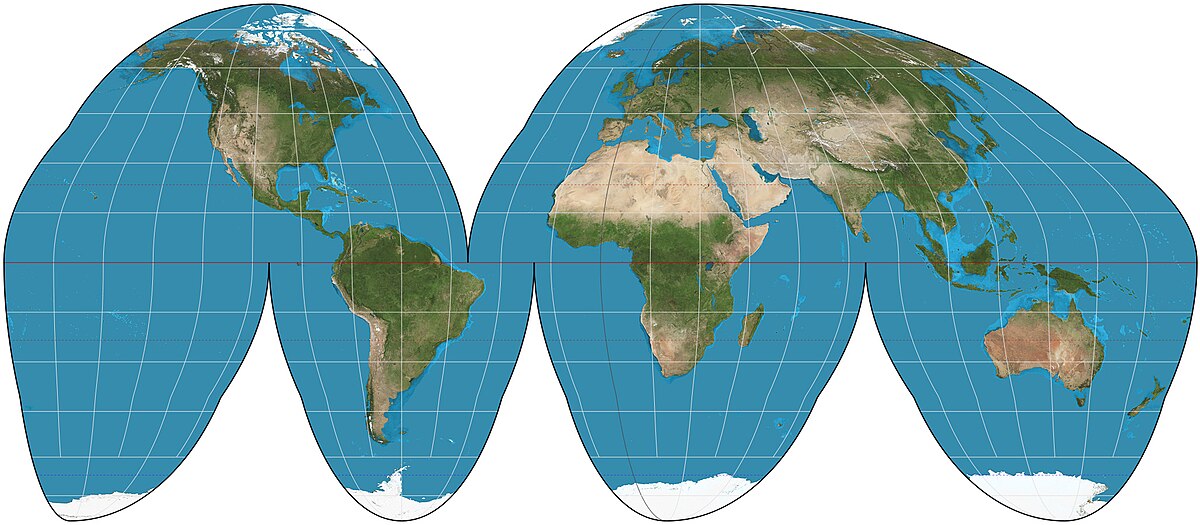
Goodes
remove ocean to preserve the size and shape of land masses; often use for Thematic maps; made up of four ovals of land masses
Gathering Data “in the field”
individuals or organizations are considered “in the field” when they’re gathering any type of data
Who gathers data?
Government agencies, private companies, research institutes or universities, and individuals
Private companies
can gather data through devices, like phones, or apps on that device
Research Institutions or Universities
Can gather data through methods like surveys or studies
Individuals
Can gather data through field observations, such as going on journeys and taking notes
Census
Every decade, population, ages of people, number of people in a household
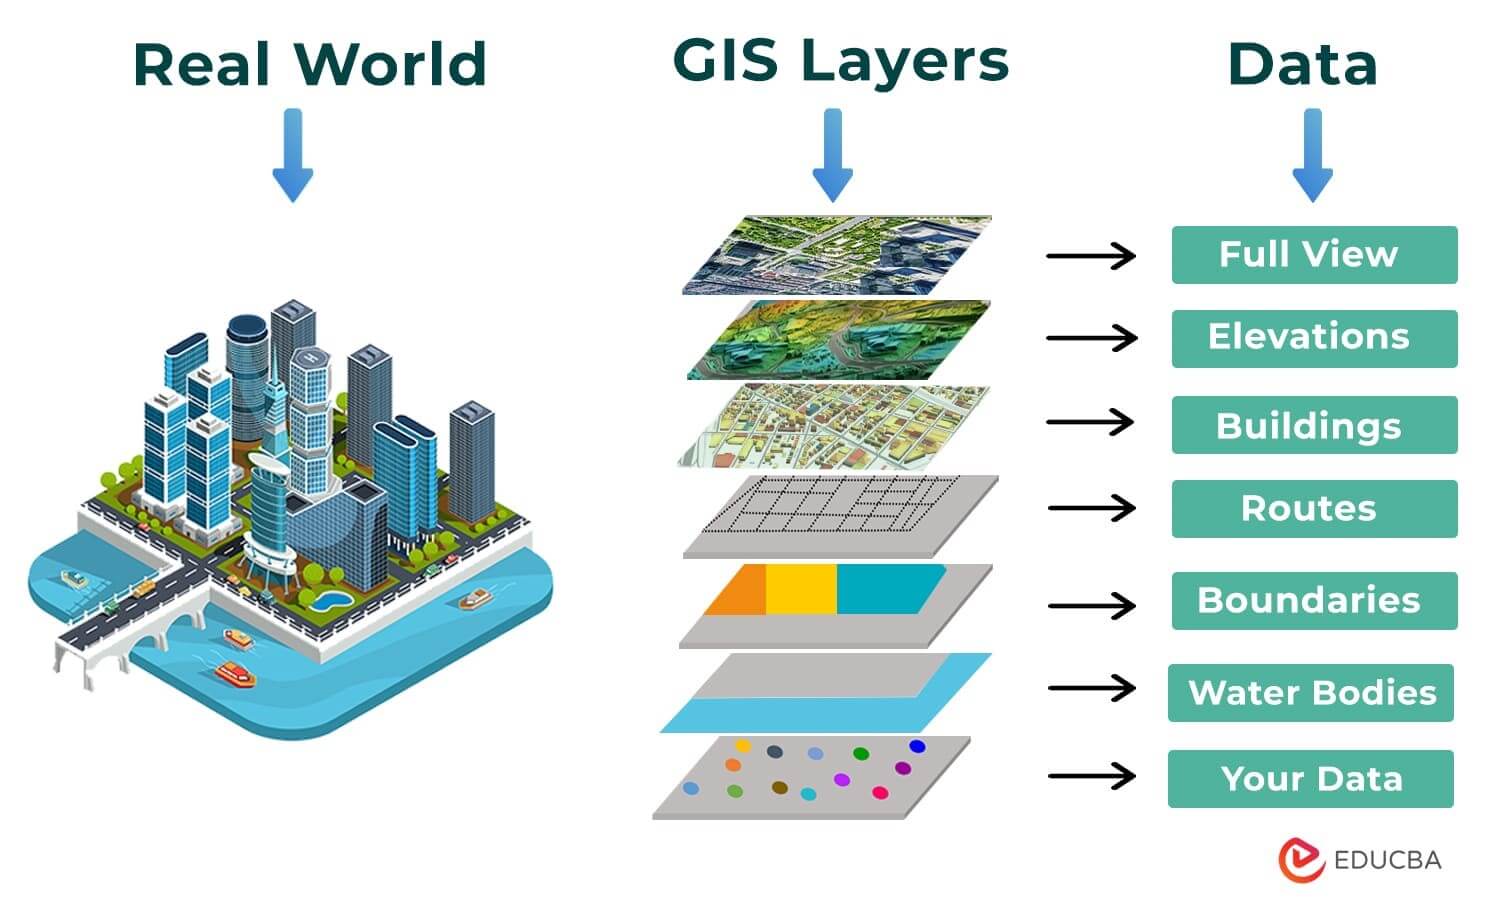
GIS stands for?
Geographic Information Systems
What is GIS?
Can collect store, analyze, and display geographic data. Can display different types of geographic information on a map; Such as where houses are, where roads are, where mountains are, etc.
Satellite Navigation Systems
Provide precise latitude and longitude coordinates of location locations to help in travel (through GPS).
Remote Sensing
Satellites collect data when orbiting the Earth by scanning the Earth in a detailed image. Can gather data about urban settlements and increase in their size, locations in drought, how many is being used for agriculture use, etc.
Online Mapping and Visualization
Online maps that provide data
Collecting Data
Data can come from field observation, reports from the media, notes made while in the field, legislation regarding a geographic topic, interviews with experts, landscape analysis, aerial photograph analysis, etc.
Who uses Geographic Data?
Individuals, Companies, Federal Governments, and State or Local Governments
How do individuals use Geographic Data?
GPS to get from one place to another
How do companies use Geographic Data?
GIS to analyze sites on where to make a new location
How do Federal Governments use Geographic Data?
Census to decide the funding and representation in government for an area when redistributing
How do State or Local Governments use Geographic Data?
GIS to make decisions about public transportation and urban development
Sustainability
Actions that provide immediate benefit by use of resources but will also provide a benefit in the long run by preserving resources
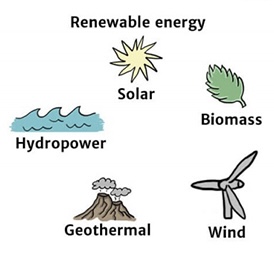
Renewable Resources
Renewable Resources are sustainable and can be remade
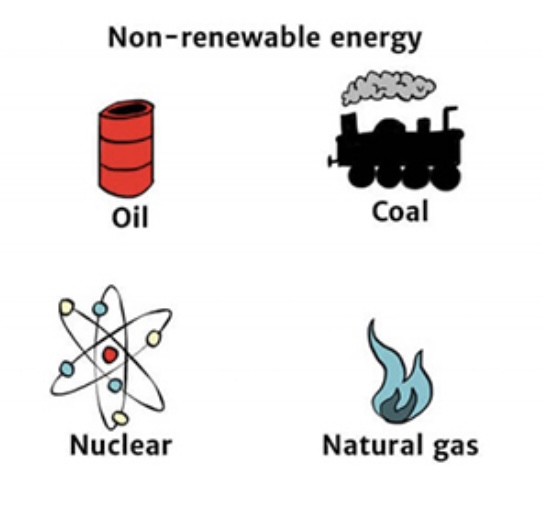
Non-Renewable Resources
Non renewable resources cannot be used forever and aren’t sustainable
What are the types of Land Use?
Agricultural, Industrial/Commercial, Residential, Transportational, and Recreational
Environmental Determinism
Was developed in the ancient world; says that natural factors determine humans way of life. Environmental Determinism is debunked.
Who used Environmental Determinism?
It was used by European as a justification for colonization because Europeans were “more advanced” due to more resources
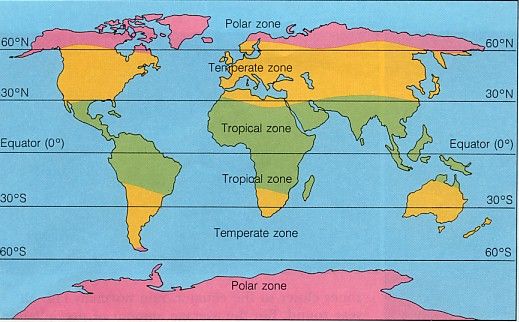
Too hot, too cold, too dry, too wet or too mountainous
Areas people won’t live in much. 45° north and south of the equator is common living zone; the temperate region
Possibilism
Physical environments affect humans way of life, but isn’t the main factor. Humans can break free from environmental restrictions and adapt to harsh environments.
Map Scale
Relationship between a distance on a map and a distance in real life
Types of Scales of Analysis
Global, regional, national, and local. Different patterns and processes can be seen at different scales; Just because the country of India has high population density doesn’t mean that every local place in India is that way.
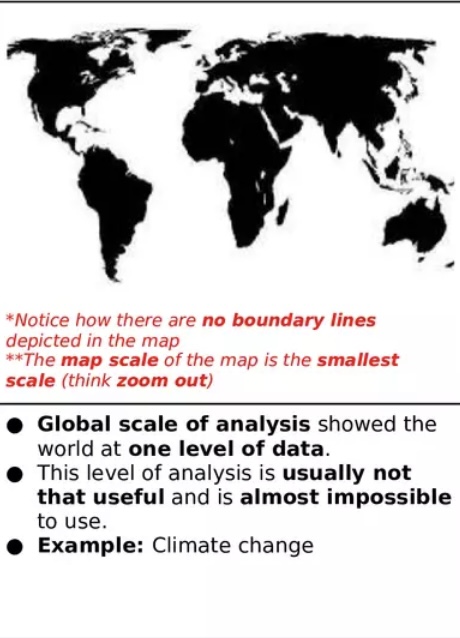
Global Scale of Analysis
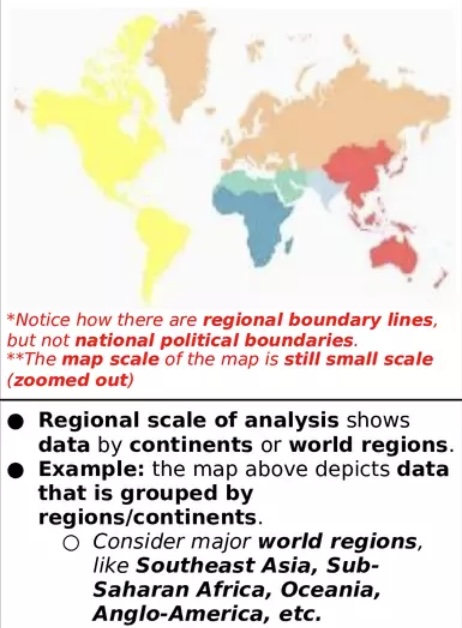
Regional Scale of Analysis
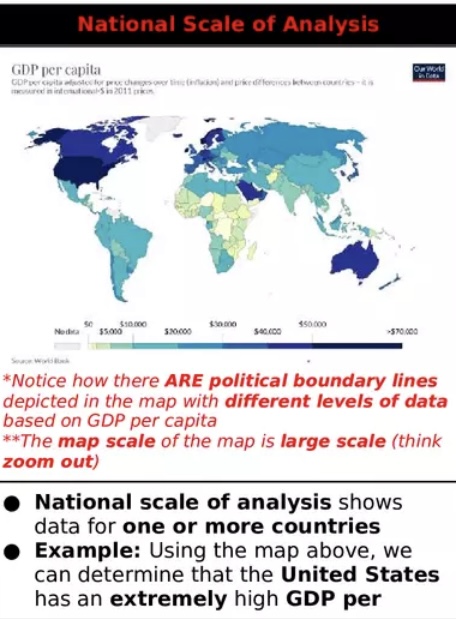
National Scale of Analysis
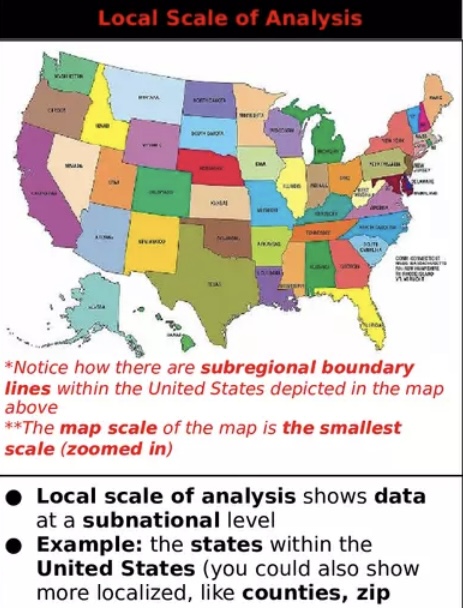
Local Scale of Analysis
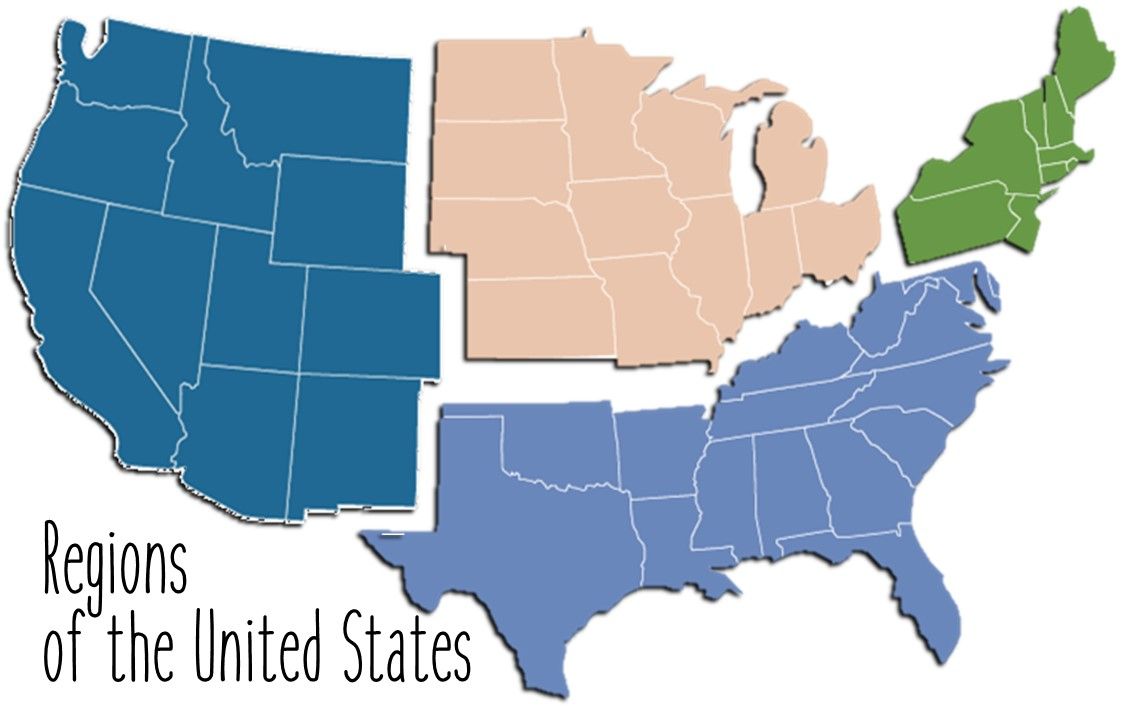
Types of Regions
Formal, Functional/Nodal, Vernacular/Perceptual Regions
Formal Regions
Uniform and homogeneous, have defined, official boundaries.
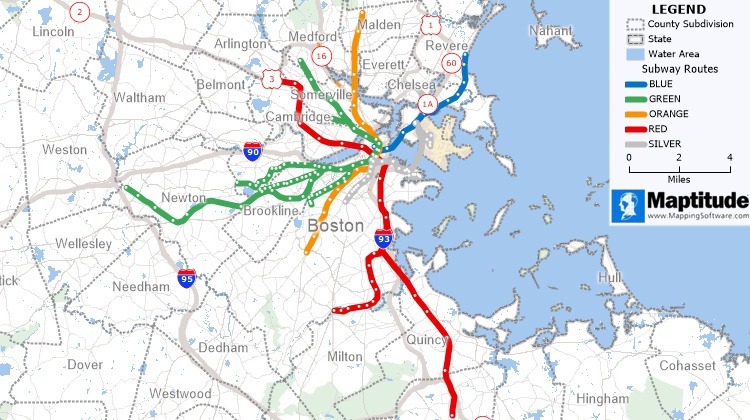
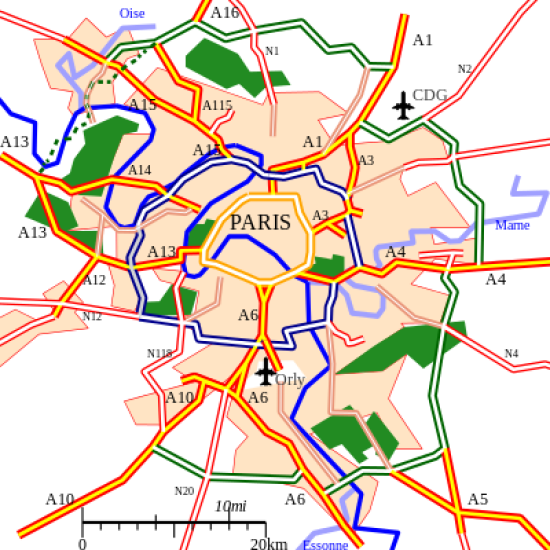
Functional/Nodal Regions
The area that is dependent around a central node. Example: metropolitan areas
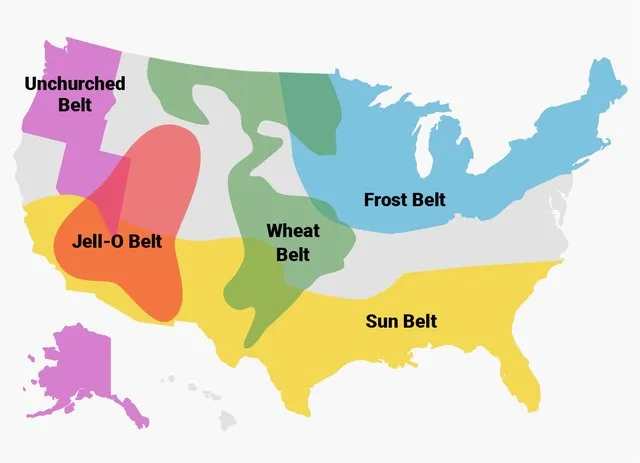
Vernacular/Perceptual Regions
Have some characteristics that the region shares, no defined boundaries, just people’s perceptions.