Module 3 descriptive stats
1/62
There's no tags or description
Looks like no tags are added yet.
Name | Mastery | Learn | Test | Matching | Spaced |
|---|
No study sessions yet.
63 Terms
what is a varible
Variables: characteristics of the observation unit that we can measure.
Ex. The number of Facebook posts a person might read each day is a variable.
Ex. The number of Facebook posts a person might read each day is a variable.
True or false this is an example of a varible
true
what are the 3 key pieces of info. that a varible must include
what the varible repersents
mesuarment units
descriution of the observation unit
Ex. If we wanted to observe the long jump distance for high schoolstudents, our variable might be "Long jump distance (cm) for eachstudent". Breaking it down, long jump distance' is what the variablerepresents, 'centimeters' is the measurement unit, and 'student' is theobservation unit
breaking down this example what is the 3 key piece of info in this varibel?
Ex. If we wanted to observe the long jump distance for high schoolstudents, our variable might be "Long jump distance (cm) for eachstudent".
Breaking it down, long jump distance' is what the variable represents, 'centimeters' is the measurement unit, and 'student' is the observation unit
what am I? the particular value of the variable that you measure from an observation unit is called.
data (pl)
datum (sing)
what is the data and varibel of this example?
Ex. Imagine we observed three students and recorded the following long jump distances: Amelia 401 cm, Mackenzie 389 cm, and Sarine 315 cm.
The variable is "Longjump distance (cm) for each student" and the data are 401 cm, 389 cm, and 315cm respectively
what are two main type of varibles?
numerical varibles
categorical varibles
what am I? varibles where the data is numeric, has measurementunits
numerical varibles
what are the two types of numerical varibles?
continous numerical varibles
discrete numerical varibles
what is continuous Numerical varibles
a varible that takes on continous numbers, including fractional and deciaml Ex 19.5kg
these are examples of what kind of varibles Ex. weight = 90.5kg, time
continous numerical
what is discrete numerical varibles?
numerical varible that only takes on whole numbers (intergers)
ex Ex. counting the number of people (30 people)
counting the number of people (30 people) is an example of what kind of varible
discrete numerical
what is categorical variables
those where the data is a qualitative description no measurement units
what are the two types of caatergorical varibles?
1. Ordinal Categorical varibles
2. Nominal Categorical
what varible am I? variable that can take on qualitative valuesbut where values are ranked from a scale (particular order). Ex.using emojis to rank how you are feeling today.(Likert scale)
ordinal catergorical varible
what varible type am I? variable that can take on qualitative values but where values do not have any particular order. Ex. Food.apples, oranges, kiwi: all fruits, no particular order. Ex colour
Nominal Categorical varibles
what is the average value of your sample called?
Mean
what is the middle value of your sample when ordered low to high?
median
T or F: counts are used for numerical data
false counts are used in caterigorical data
what are counts
are used for categorical variables and are thenumber of observations in your sample that fall into each category
T or F: proportions are used for numerical varibles
F used for catergoical data
what are proptions
are used for categorical variables and are the share of observations in your sample that fall into each category (%)
False: counts are are the share of observations inyour sample that fall into each category (%)
this is the defination for proportions.
counts: are thenumber of observations in your sample that fall into eachcategor
using counts makes data eaiser to understand vs unsing proptions T or F
F proptions makes it easier
what is the central tendency?
describes the typical value in your sample (ie mean) (only in categorical data)
the central tendency is used in numerical data T or F
F the central tendency is used in catergotical data
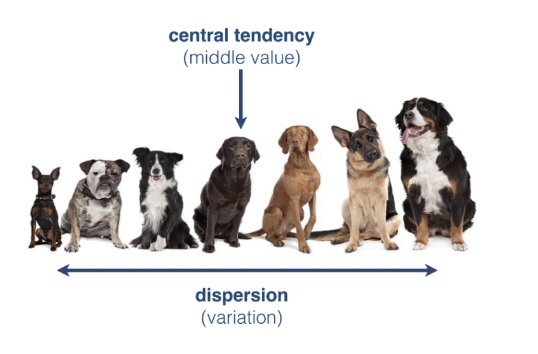
what is dispersion
describes the spread of the values ( ie variance) (only in categorical data)

T or F: disperison is used for numerica data
F it is used for categorical data
what is the range?
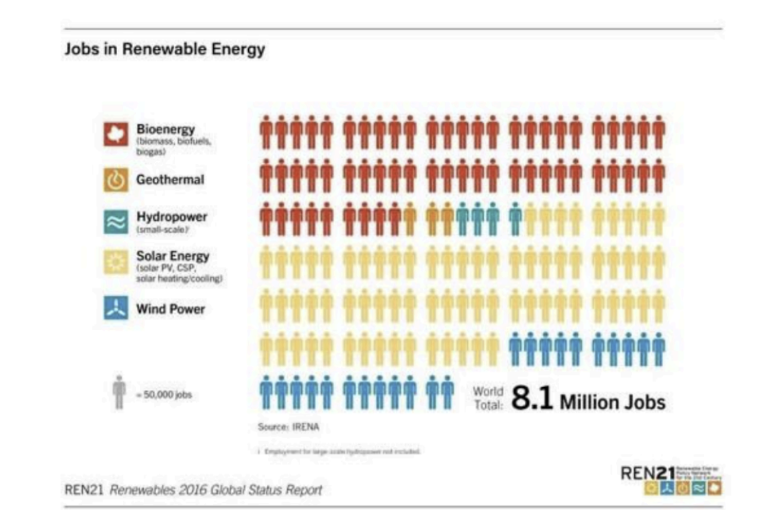
the difference between the maximum and minimum values for the numerical variables or the dif. Between the max and min of the counts for the categorical variable. Used to indicate dispersion.
Ex of range: the proportion of renewable energy jobs in each category ranges from 2%to 46%, which is a relatively wide range.
what is used to indicate disperison?
the range
T or F range is used for both numerical and catergorical data
T
what is a quartile
one-quarter of your sample when the values are ranked from lowest to highest
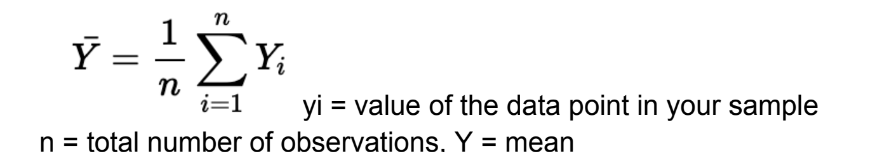
how do you calculate the mean
summing all of the values in your sample
Dividing by the number of data points in your sample
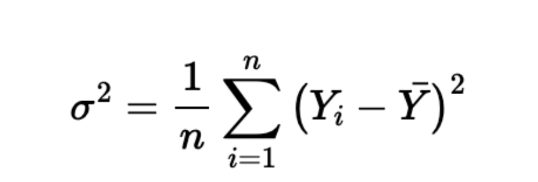
Calculating Variance:
1. Calculate the mean for a sample
2. Calculate the difference between each data point and the mean, then square that value
3. Sum the squares of the differences and divide by the number of observations/data points (this gives the population variance NOT the sample variance)
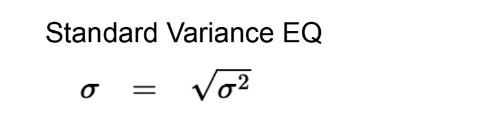
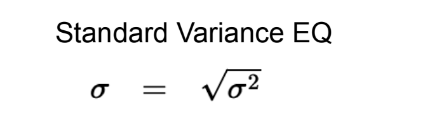
what is the standard devation EQ
the square root of the varience/population varience
what am I? typical squared distance from the values to the mean, measures theamount of variation in your sample (σ^2
Variance: typical squared distance from the values to the mean, measures theamount of variation in your sample (σ^2
what am I? Is the squared root of the variance (σ)
standard variance (σ)
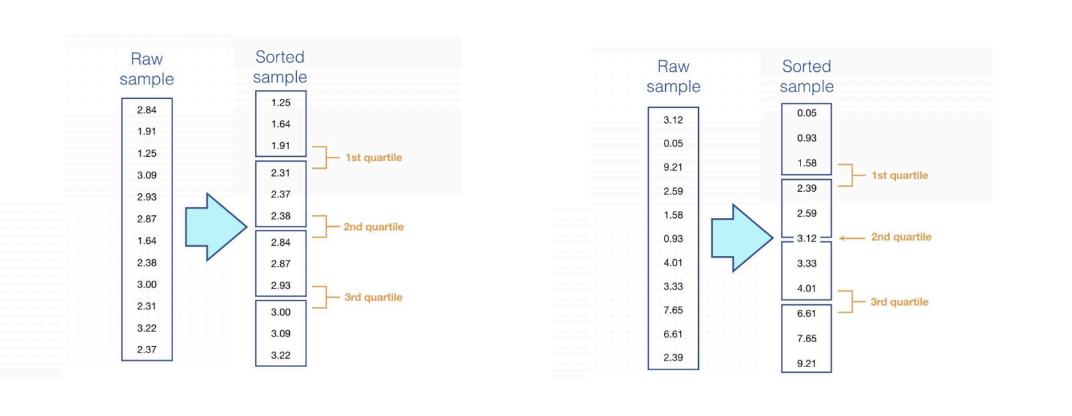
Steps: Calculating quartiles
1. Sort the data from low → high
2. Find the 2nd quartile by splitting the data in ½ according to.
The sample has an odd # of observations → middle # of the dataset is the second quartile.
The sample has an even # of observations → average of the two values closest to the middle is the second quartile
3. Find the 1st quartile by creating a subset of the data that is the lower-valued half of the observations, then use the rules in step 2 to find the middle value. The lower subset is created.
The sample has an odd number of observations, in which case the lower-valued subset is all values less than or equal to the second quartile.
The sample has an even number of observations, in which case the lower-valued subset is all values less than the second quartile The subset does not include the second quartile.
4. Find the 3rd quartile by repeating step 3 but for the upper-valued half of the observations.5. Ex. even # observation (Right) Ex. even # observation (Left)
what is the central tendency
is the middle, given by the second quartile. it is also called the medican as it is the central quartile
We know 50% of the data is above and below what point?
the central tendency value
what shows how much varience there is in a sample? (numerical data)
dispersion
with quartiles how do tell the variation
the range of values that contain the center-most 50% of the data. The range is btw the 1st and 3rd quartiles and is called the interquartile range
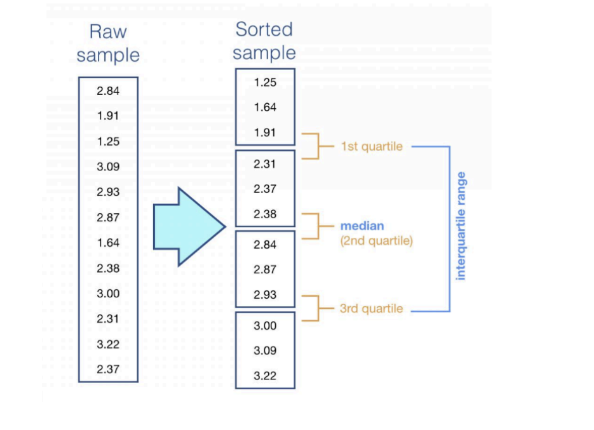
what is the interquartile range?
uses quartiles to describe dispersion in a numericalvariable. It is the difference between the 3rd and 1st quartiles and gives therange of the innermost 50% of a numerical sample○ Calc: subtract the 1st quartile from the 3rd quartile

how do you calculate the IQR
subtact 1st quartile from the 3rd quartile
using quartiles for numerical data pro and con (over using the mean)
Pro: The median and interquartile range are relatively good for extreme values
Con: The median and interquartile range change a lot for samples with a small # of observations
using mean for numerical data pro and con (over using the quartiles)
Pro: The mean and the standard deviation are better when there are small numbers of observations in the sample
Con: The mean and the standard deviation are sensitive to extreme values
what is Standard deviation
tells you how spread out the data is. It is a measure of how far each observed value is from the mean
what is effect size?
is the change in mean value of the response variable among groups (difference)
The difference is the calculation of what?
alculations of effect size are Y1-Y2 where Y1 and Y2 are the means of samples from group 1 and group 2 respectively
what are the two ways of cacluating effect size?
the difference (-)
ratio (/)
ratio is the calcuation of what?
effect size Y1/Y2 where Y1 and Y2 are the means of samples from group 1 and group 2 respectively
what does “mindfulness” refer to when taking about the difference
refers to whether the difference among groups is important for your study
T or F effect size is a discriptive statistic? if T what does it describe?
T, it is a description of the change in mean among thesamples you collected from different groups
In a case-control study effect size would be…
the change in the mean value ofthe response variable between the case and control groups
In observational studies, effect size is calculated as the change…
amoung groups
In experimental studies, effect size is calculated among…
treatment levels
in a single factor experiment effect size would be the change in mean valueof the response variable among….
the levels of the factor/treatement
absolute effect size (define)
simple change is the mean value between groups
T or False: a con using differences is that it does not keep the orignal scale (keeps the units)
F: using diffeneces keeps the units that is a pro
T or F a con of using ratio is that is does not indicate relactive change
F
a pro of using ratios is that it indicates relative change
T or F : using ratios keeps the units of the scale
False a con of using ratios for effect size is that it does not keep original scale (units)
You are conducting a medical study to see the risk of cancer. to calculate the effect size would you use difference or ratios?
you would use ratios easier to see the risk and units are not important. By using rations the researchers can evaluate the proportional increase in therisk of getting a disease.