AP Stats Unit 6
1/7
There's no tags or description
Looks like no tags are added yet.
Name | Mastery | Learn | Test | Matching | Spaced | Call with Kai |
|---|
No study sessions yet.
8 Terms
Interpreting Confidence Interval
We can be _% confident that in the population of all (context), the proportion that (have the quality in context) is between _ and _.
Interpreting Confidence Level
If the (context) selects many random samples of (n) (individuals) and constructs a _% confidence interval using each sample, then about _% of these intervals will capture the true proportion of all (individuals) that (quality in context).
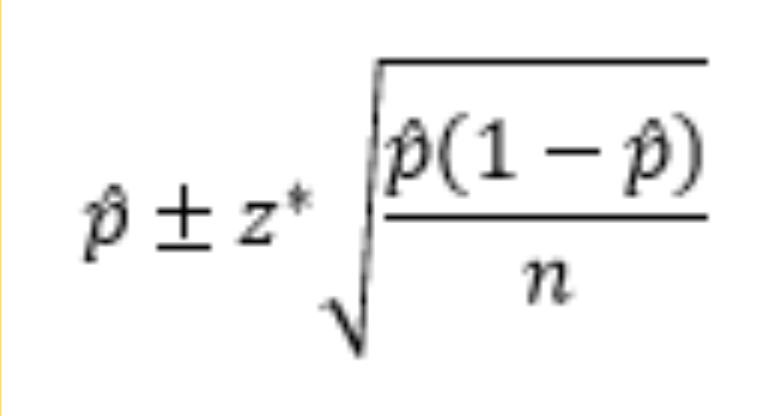
Answering FRQs for Building Confidence Intervals for a Population Proportion
State interval you intend to build
For population proportion use “one-sample z-interval for population proportion”
State formula
Requirements have been met
Random sample
Less than 10%
Large enough sample size (10 checks)
Calculate interval
Margin of Error (M) or (E)
Point estimate to either the upper or lower bound
Subtract higher from lower, divide by 2
Point Estimate
Center
Add, divide by 2
Width
Interval is the size of the entire interval
2 times margin of error
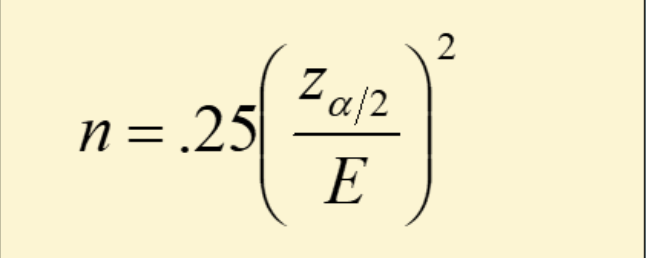
Determining the Sample Size n
Always round up
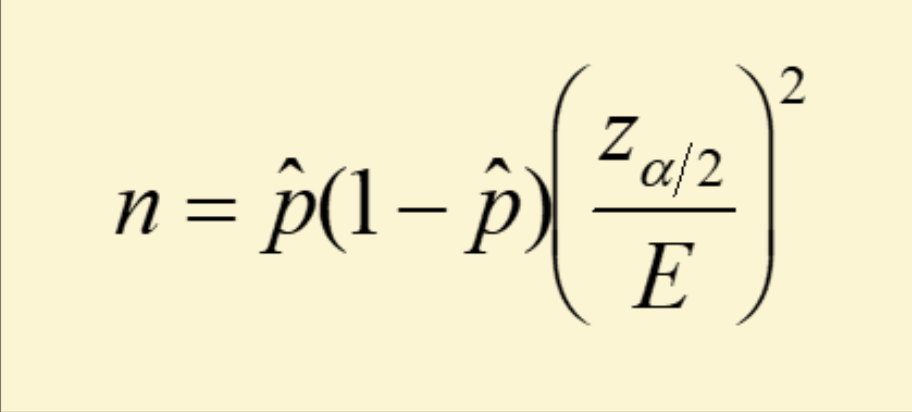
Determining the Sample Size n
Always round up