Chapter 9: Hypothesis Testing
1/32
There's no tags or description
Looks like no tags are added yet.
Name | Mastery | Learn | Test | Matching | Spaced |
|---|
No study sessions yet.
33 Terms
Hypothesis Testing
An area of statistical inference in which one evaluates a conjecture about some characteristic of the parent population based upon the information contained in the random sample
Statistical hypothesis
A claim concerning one or more populations whose truthfulness can be established using sample data
Types of hypotheses
Null hypothesis
Alternative hypothesis
Null hypothesis
A statistical hypothesis which the researcher doubts to be true
denoted by Ho (or 𝐻0),
Alternative hypothesis
The operational statement of the theory that the researcher believes to be true and wishes to prove
denoted by Ha (or 𝐻1)
Types of Hypothesis Tests
one-tailed test
two-tailed test
One-tailed test of hypothesis
A test where the alternative hypothesis specifies a one-directional difference for the parameter of interest (greater than or less than)
Two-tailed test of hypothesis
A test where the alternative hypothesis does not specify a directional difference for the parameter of interest (not equal to)
Test statistic
A statistic whose value is calculated from sample measurements and on which the statistical decision will be based.
Critical region / Rejection region
The set of values of the test statistic for which the null hypothesis will be rejected
Nonrejection region / Acceptance region
The set of values of the test statistic for which the null hypothesis will not be rejected
Critical value of the test statistic
A value that separates the nonrejection and rejection regions, and the location of the value depends on Ha
Types of Errors
Type I
Type II
Type I Error
The error made by rejecting the null hypothesis when it is actually true (reject, but true)
worse error out of the two
Type II Error
The error made by not rejecting the null hypothesis when it is actually false (not reject, but false)
Level of Significance
The maximum probability of a Type I error that a researcher is willing to commit
denoted by 𝛼
common values: 0.01, 0.05, and 0.1
Relationship between level of significance and size of the critical region
larger 𝛼 values = larger critical region
a lower level of significance implies a “stricter” test, in the sense that it makes it difficult to reject Ho.
p-value
The probability of selecting a sample whose computed value for the test statistic is equal to or more extreme (in the direction stated in Ha) than the realized value computed from the sample data, given that the null hypothesis is true.
Relationship between p-value and level of significance
When the p-value is less than or equal to 𝛼, we reject Ho. Otherwise, we do not reject Ho.
Conditions of the p-value
may also be viewed as the smallest level of significance at which Ho will be rejected based on the information contained in the sample.
should NOT be interpreted as the probability that Ho is true
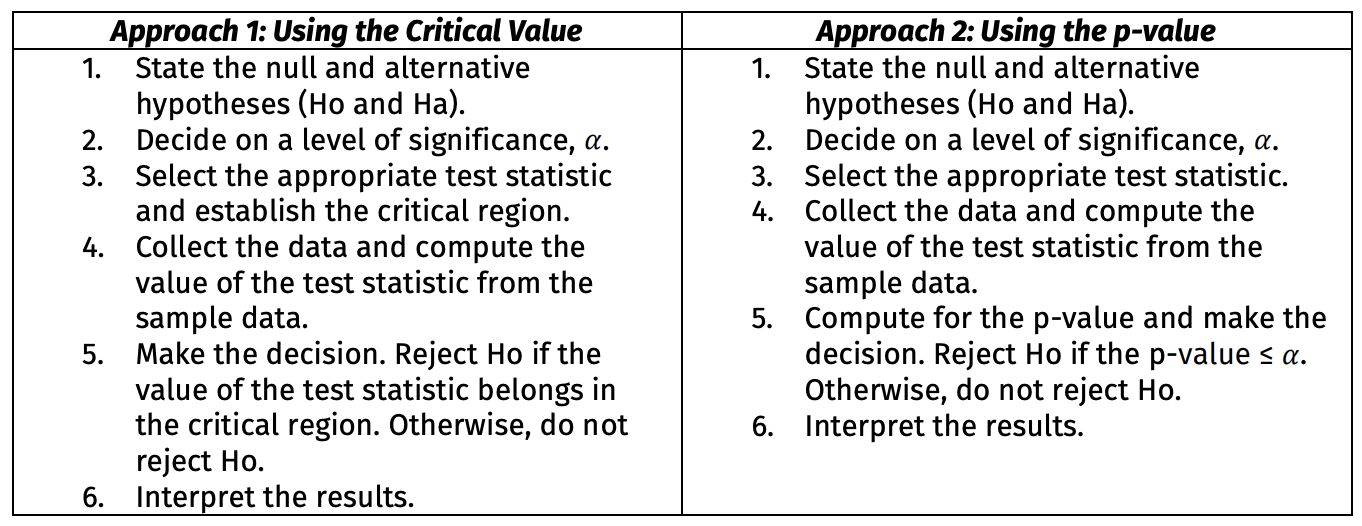
Steps in Hypothesis Testing
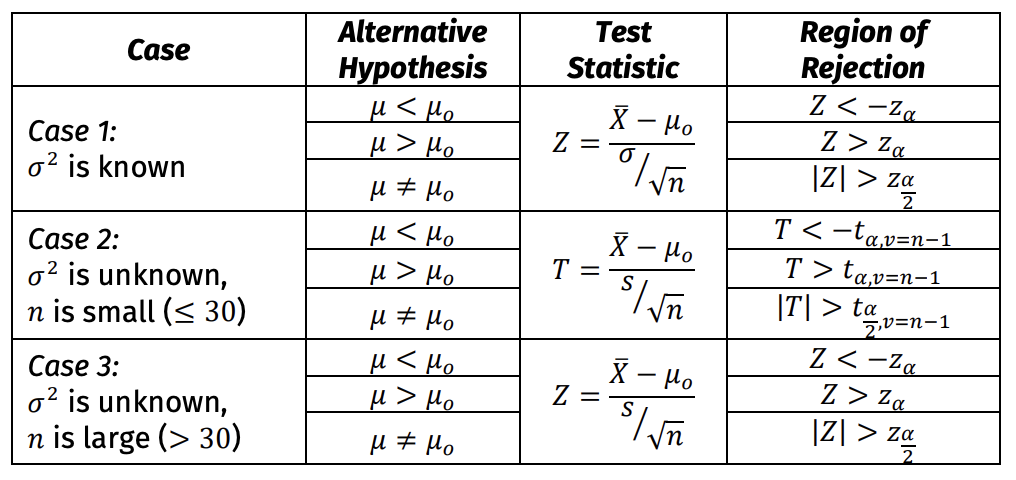
Hypothesis Tests for the Mean of a Normal Population (one population)
Given that the random samples are strictly from a normal distribution and are exact level-𝛼 tests
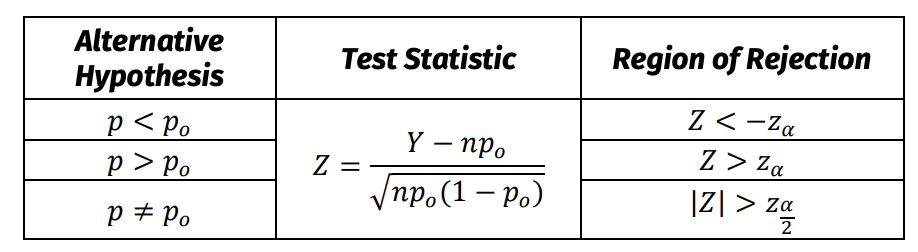
Hypothesis Tests for the Population Proportion (one population)
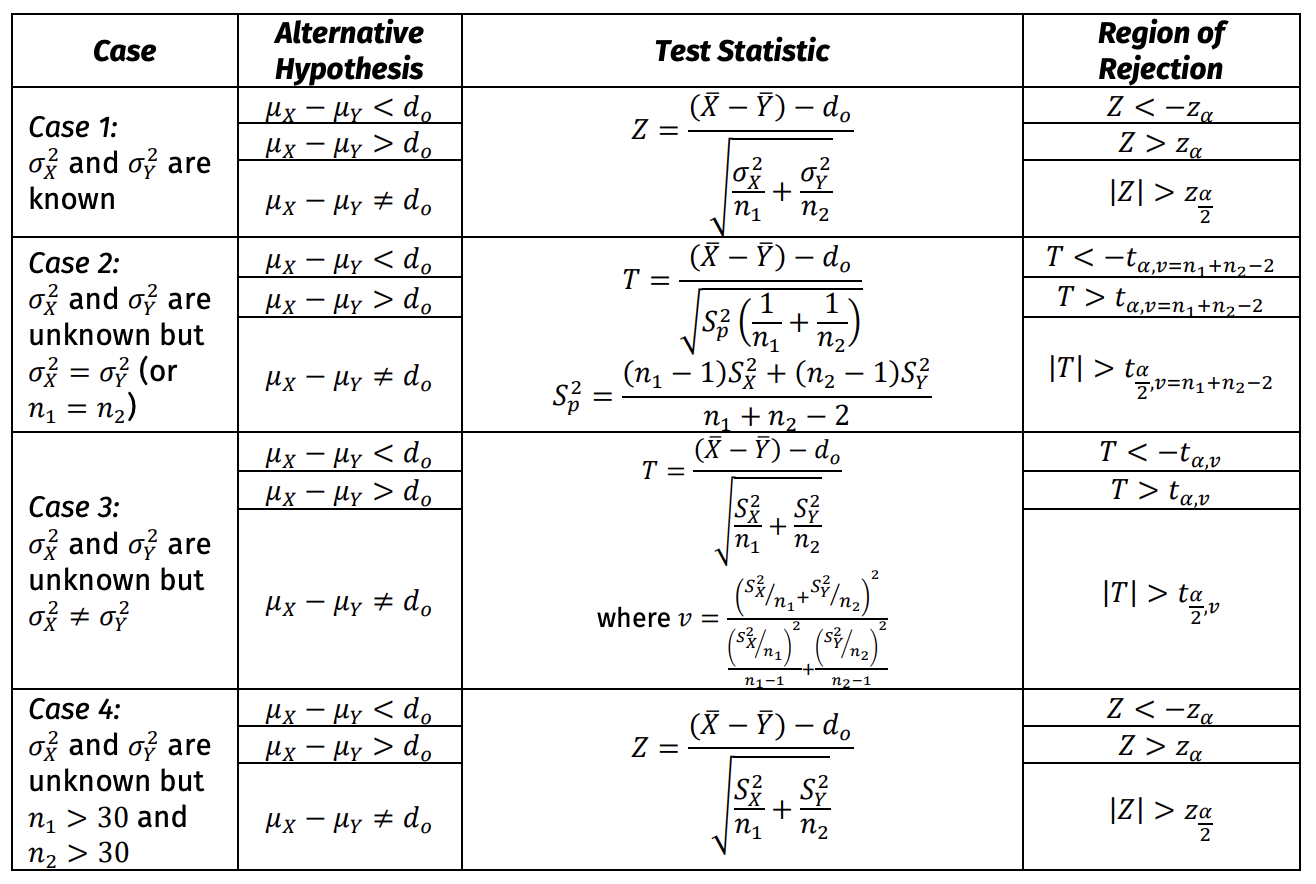
Hypothesis Tests for the Difference of Means (Independent Samples from Two Normal Populations)
given 𝑑𝑜 is the hypothesized difference of means
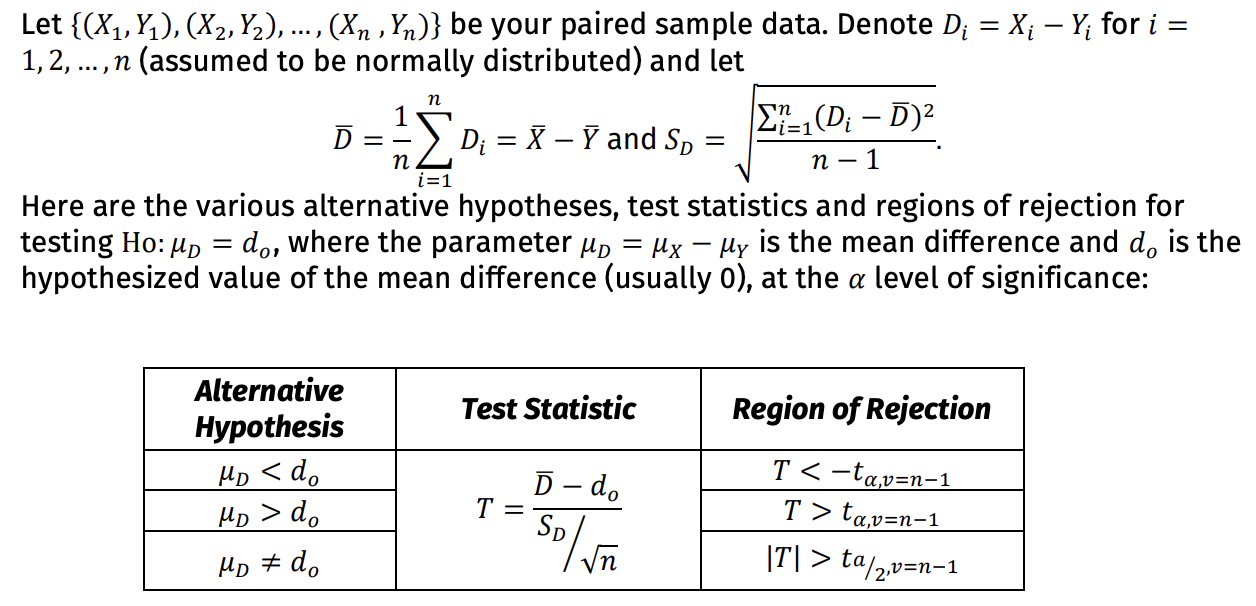
Hypothesis Tests for the Mean Difference (Paired Sampling) (two populations)
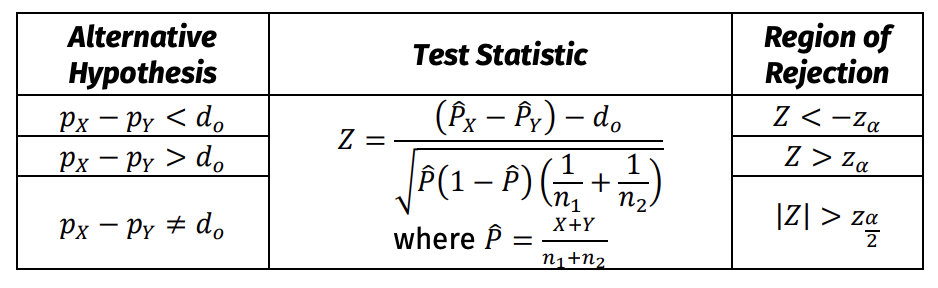
Hypothesis Tests for the Difference of Proportions (two populations)
given that 𝑑𝑜 is the hypothesized difference of proportions (usually 0)
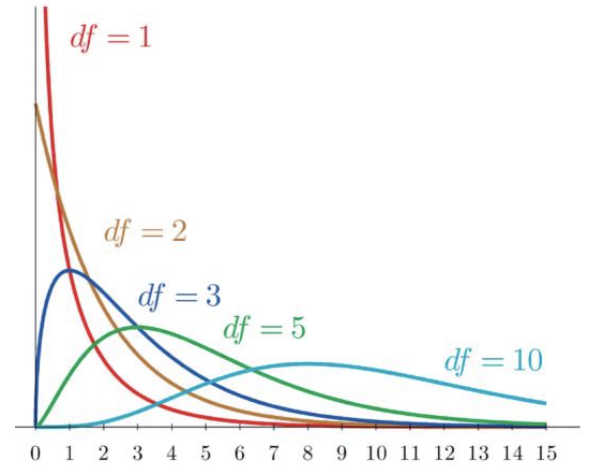
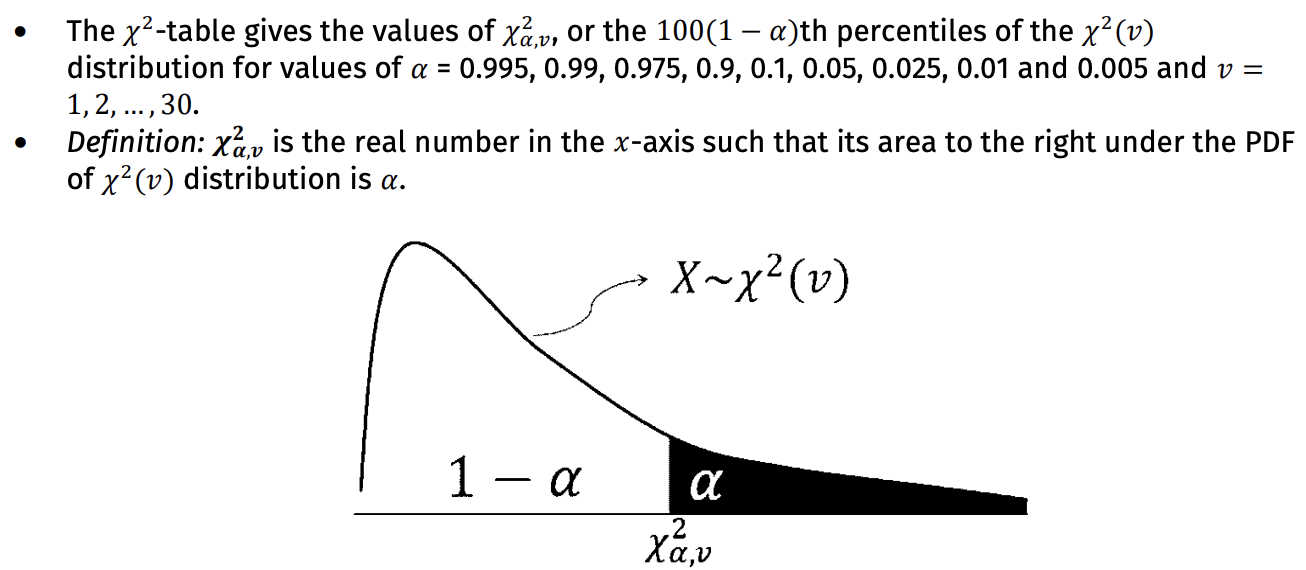
Chi-square distribution (𝝌²-distribution) characteristics
It has one parameter — degrees of freedom, denoted by 𝑣.
𝑋~𝜒 2 (𝑣).
The PDF is nonzero for positive real numbers only.
It is skewed to the right, and the PDF becomes close to symmetry as 𝑣 increases.
Reading the 𝝌²-Table
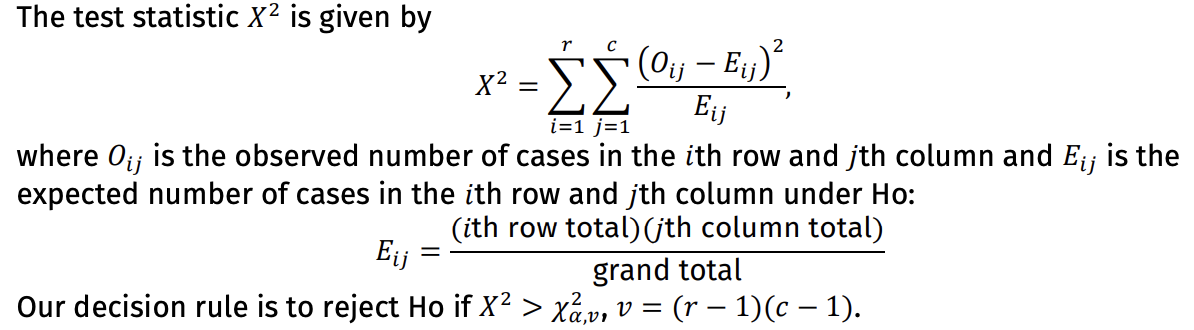
Chi-square Test for Independence
A test used to determine whether two categorical variables are related or not, with observations tallied in an r x c contingency table.
Null and Alternative Hypotheses for the Chi-square Test for Independence
Ho: The two variables are independent.
Ha: The two variables are not independent (The two variables are related/associated.)
Chi-square Test for Independence - Test statistic formula
Conditions for the Chi-square Test for Independence
The test is valid if at least 80% of the cells have expected frequencies of at least 5 and no cell has an expected frequency ≤ 1
If many expected frequencies are very small, researchers commonly combine categories of variables
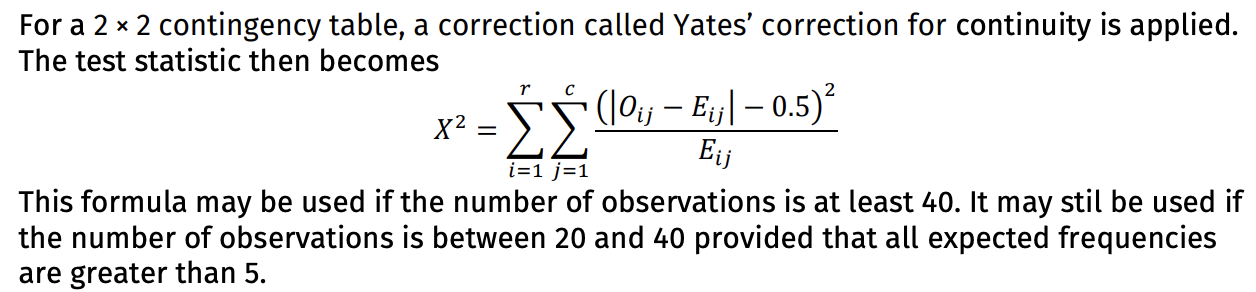
Chi-Square Test for 2 × 2 Tables