Unit 7: Natural Selection
1/45
Earn XP
Description and Tags
Name | Mastery | Learn | Test | Matching | Spaced | Call with Kai |
|---|
No analytics yet
Send a link to your students to track their progress
46 Terms
Natural Selection
Ex.
Evidence of Evolution
Ex.
Common Ancestry
Ex.
Genetic Varability
Ex.
Causes of Evolution
Ex.
Divergent Evolution
Ex.
Convergent Evolution
Ex.
Population Genetics
Ex.
Extra - What is differential Survival?
Differential survival describes how animals, plants, and other living organisms manage to successfully survive changes to their environment or fail and die out.
Extra - What is evolutionary fitness?
In evolutionary biology, "evolutionary fitness" refers to an organism's or genotype's ability to survive and reproduce successfully in its environment, ultimately contributing to the next generation's gene pool.
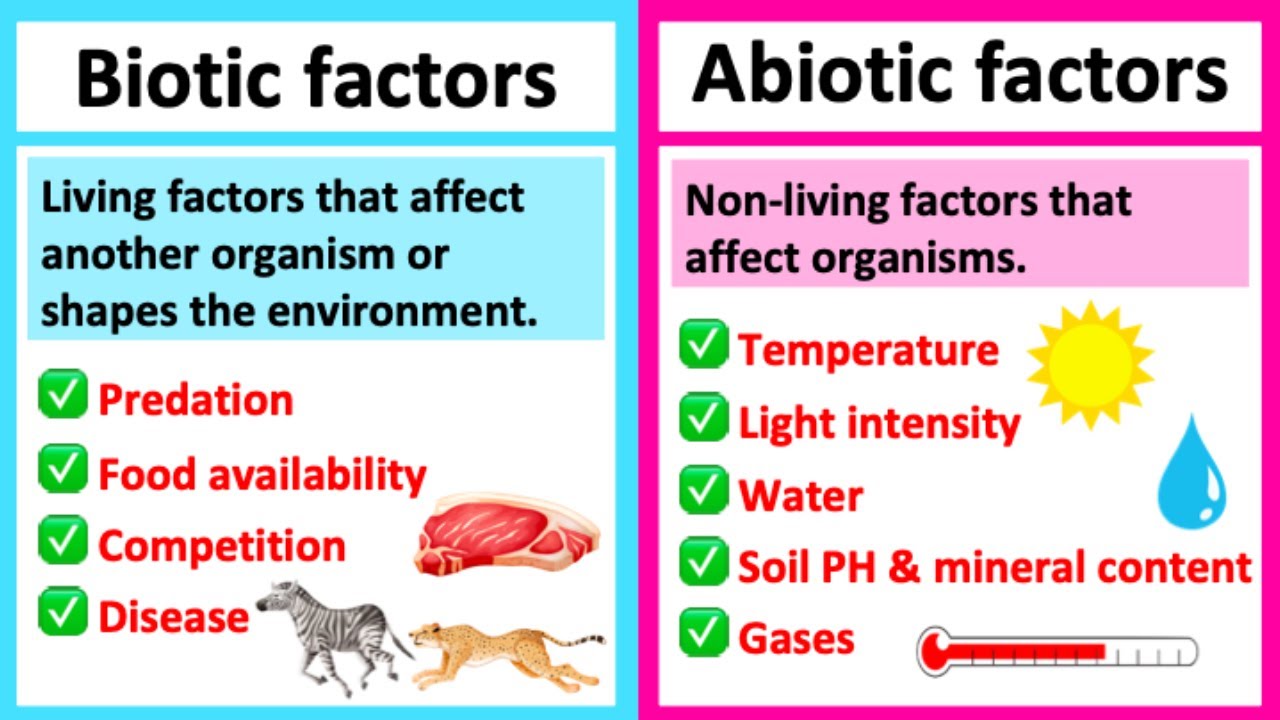
Extra - Abiotic vs Biotic
Ex.
Extra - What are selective pressures?
Evolutionary pressure, also known as selective pressure, is a force that impacts a population's reproductive success, driving natural selection. It's caused by factors that make certain phenotypes more favorable in specific environmental conditions.
Extra - What is artificial selection?
Artificial selection is the process where humans intentionally breed plants or animals with specific, desirable traits, accelerating the evolution of those traits in future generations, unlike natural selection which is driven by environmental pressures.
Extra - Types of Selection
Ex.
Extra - Hardy-Weinberg Equilibrium
Ex.
Extra - What two ways can you solve Hardy-Weinberg Equations?
Solve for the variables or solve for the q²
Extra - What is biogeography?
Biogeography is the study of the distribution of organisms, species, and ecosystems across geographic space and through geological time, exploring why and how they live where they do.
Extra - Phylogenetic Trees
Ex.
Extra - Shared vs Derived Characteristics
In evolutionary biology, shared characteristics are traits present in two or more species due to a common ancestor, while derived characteristics are traits that evolved uniquely in a particular lineage, distinguishing it from others.
Extra - Reading Phylogenetic Trees
Ex.
Extra - Describe the causes of natural selection.
Causes of Natural Selection:
• Genetic Variation: Differences in DNA among individuals lead to diverse traits.
• Overproduction of Offspring: More offspring are produced than can survive, leading to competition.
• Struggle for Existence: Limited resources result in competition among individuals.
• Differential Survival and Reproduction: Individuals with advantageous traits are more likely to survive and reproduce.
Natural Selection Leading to Evolution:
• Adaptation Accumulation: Beneficial traits become more common over generations.
• Allele Frequency Changes: Favorable alleles increase in the population, leading to evolutionary change.
Darwin’s Theory of Natural Selection:
• Variation: Individuals within a species vary in their traits.
• Inheritance: Traits are heritable and passed to offspring.
• Overproduction and Competition: Species produce more offspring than can survive, leading to competition.
• Differential Survival: Individuals with advantageous traits have higher survival and reproduction rates.
• Descent with Modification: Over time, advantageous traits become more common, leading to evolution.
Differential Survival in Competition for Limited Resources:
• Resource Limitation: Essential resources (e.g., food, shelter) are finite.
• Competitive Advantage: Traits providing better resource acquisition increase survival chances.
• Selective Pressure: Environmental factors favor individuals with advantageous traits.
• Evolutionary Outcome: Populations evolve as advantageous traits become more prevalent.
Extra - Explain how natural selection affects populations
Natural Selection’s Impact on Populations:
• Allele Frequency Shifts:
• Advantageous traits become more common over generations.
• Population Adaptation:
• Populations evolve to better suit their environments.
Measuring Evolutionary Fitness:
• Definition:
• An individual’s genetic contribution to the next generation.
• High Fitness:
• Individuals with favorable traits have higher reproductive success.
Reproductive Success:
• Definition:
• The number of offspring an individual produces that survive to reproduce.
• Influence on Evolution:
• Traits enhancing reproductive success become more prevalent.
Biotic Factors Affecting Evolution:
• Direction:
• Predation:
• Prey species evolve defenses; predators evolve counter-adaptations.
• Competition:
• Species adapt to utilize different resources, reducing competition.
• Rate:
• Mutualism:
• Beneficial interactions can accelerate evolutionary changes.
• Parasitism:
• Hosts and parasites may rapidly co-evolve.
Abiotic Factors Affecting Evolution:
• Direction:
• Climate Change:
• Species adapt to new temperatures or precipitation patterns.
• Habitat Alteration:
• Changes in environment (e.g., deforestation) drive new adaptations.
• Rate:
• Natural Disasters:
• Events like volcanic eruptions can prompt rapid evolutionary responses.
• Resource Availability:
• Sudden changes in resources can speed up evolutionary processes.
Extra - Describe the importance of phenotypic variation in a population.
mportance of Phenotypic Variation in a Population:
• Survival in Changing Environments: Variation increases the likelihood that some individuals can adapt to environmental changes, ensuring population survival.
Target of Natural Selection:
• Phenotype: Natural selection acts on observable traits, as they influence an organism’s ability to survive and reproduce.
Environmental Selective Pressures on Populations:
• Biotic Factors: Predation, competition, and disease can favor traits that enhance survival and reproduction.
• Abiotic Factors: Climate, temperature, and availability of resources can influence which traits are advantageous.
Phenotypic Variation Increasing Fitness:
• Camouflage: Coloration that blends with the environment can reduce predation.
• Disease Resistance: Genetic variations that confer immunity can enhance survival.
Phenotypic Variation Decreasing Fitness:
• Maladaptive Traits: Traits that reduce survival or reproduction, such as bright colors that attract predators.
• Genetic Disorders: Mutations leading to health issues can decrease fitness.
Extra - Explain how humans affect diversity within a population.
Human Impact on Genetic Diversity:
• Habitat Fragmentation: Reduces population sizes, leading to decreased genetic variation.
• Introduction of Exotic Species: Can outcompete native species, reducing their genetic diversity.
Artificial Selection:
• Definition: Humans breeding organisms for desired traits.
• Examples: Domestication of dogs; cultivation of specific crop varieties.
Effects of Artificial Selection on Variation:
• Reduced Genetic Diversity: Focusing on specific traits can decrease overall genetic variation.
• Increased Susceptibility: Low genetic diversity can make populations more vulnerable to diseases and environmental changes.
Extra - Explain Relationship between changes in the environment and evolutionary change.
Environmental Changes and Evolutionary Responses:
• Adaptation: Species develop traits better suited to new conditions.
• Migration: Organisms relocate to favorable environments.
• Extinction: Species unable to adapt may perish.
Convergent Evolution:
• Definition: Unrelated species independently evolve similar traits due to analogous environmental pressures.
• Example: Wings in bats and insects evolved separately for flight.
Selective Pressures Leading to Similar Adaptations:
• Similar Environments: Distinct species in comparable habitats develop alike traits.
• Predation: Species facing common predators may evolve matching defenses.
• Diet: Species consuming similar foods might evolve comparable feeding structures.
Extra - Explain how random occurrences affect genetic makeup of populations
Random Occurrences Affecting Genetic Makeup:
• Mutations: Random changes in DNA sequences introduce new genetic variations, which can be beneficial, neutral, or harmful.
• Genetic Drift: Random fluctuations in allele frequencies, especially significant in small populations, can lead to the loss or fixation of alleles over time.
Types of Mutations:
• Point Mutations: Single nucleotide changes (e.g., substitutions).
• Insertions/Deletions: Addition or loss of nucleotide segments.
• Chromosomal Mutations: Large-scale changes affecting chromosome structure or number.
Effects of Mutations on Population Genetics:
• Increased Genetic Variation: Mutations introduce new alleles into the population.
• Potential Adaptations: Beneficial mutations can enhance survival and reproduction.
• Genetic Disorders: Harmful mutations may reduce fitness.
Genetic Drift:
• Definition: Random changes in allele frequencies due to chance events, leading to reduced genetic variation, particularly in small populations.
Bottleneck Effect:
• Definition: A sharp reduction in population size due to environmental events (e.g., natural disasters), resulting in decreased genetic diversity.
• Impact: Survivors’ allele frequencies may differ from the original population, leading to reduced genetic variation and potential inbreeding.
Founder Effect:
• Definition: When a new population is established by a small number of individuals from a larger population, leading to reduced genetic variation.
• Impact: The new population may have different allele frequencies than the original group, potentially increasing the prevalence of certain genetic traits.
Gene Flow:
• Definition: The transfer of alleles between populations through migration of individuals or gametes.
• Impact: Introduces new genetic material, increasing genetic variation and potentially reducing differences between populations.
Extra - Describe the role random process in the evolution of specific populations
Role of Random Processes in Evolution:
• Genetic Drift: Random fluctuations in allele frequencies, especially significant in small populations, can lead to the loss or fixation of alleles over time.
• Mutations: Random changes in DNA sequences introduce new genetic variations, which can be beneficial, neutral, or harmful.
Effect of Decreased Genetic Variation on Population Differences:
• Increased Divergence: Populations with reduced genetic diversity may adapt differently to environmental pressures, leading to greater differences between populations of the same species.
Extra - Describe the change in the genetic makeup of a population over time
Genetic Makeup Changes Over Time:
• Mutation: Random changes in DNA introduce new alleles, increasing genetic variation.
• Natural Selection: Favors advantageous traits, altering allele frequencies.
• Genetic Drift: Random fluctuations in allele frequencies, especially in small populations.
• Gene Flow: Movement of alleles between populations through migration.
Mutations and Genetic Variation:
• Point Mutations: Single nucleotide changes can create new alleles.
• Insertions/Deletions: Adding or removing nucleotides alters gene function.
• Chromosomal Rearrangements: Large-scale changes can create new gene combinations.
Genetic Variation and Phenotypes:
• Protein Function: Mutations can alter protein structure, affecting traits.
• Regulatory Changes: Mutations in gene control regions can change gene expression patterns.
Natural Selection Acting on Phenotypes:
• Differential Survival: Individuals with advantageous traits are more likely to survive.
• Differential Reproduction: Advantageous traits increase reproductive success.
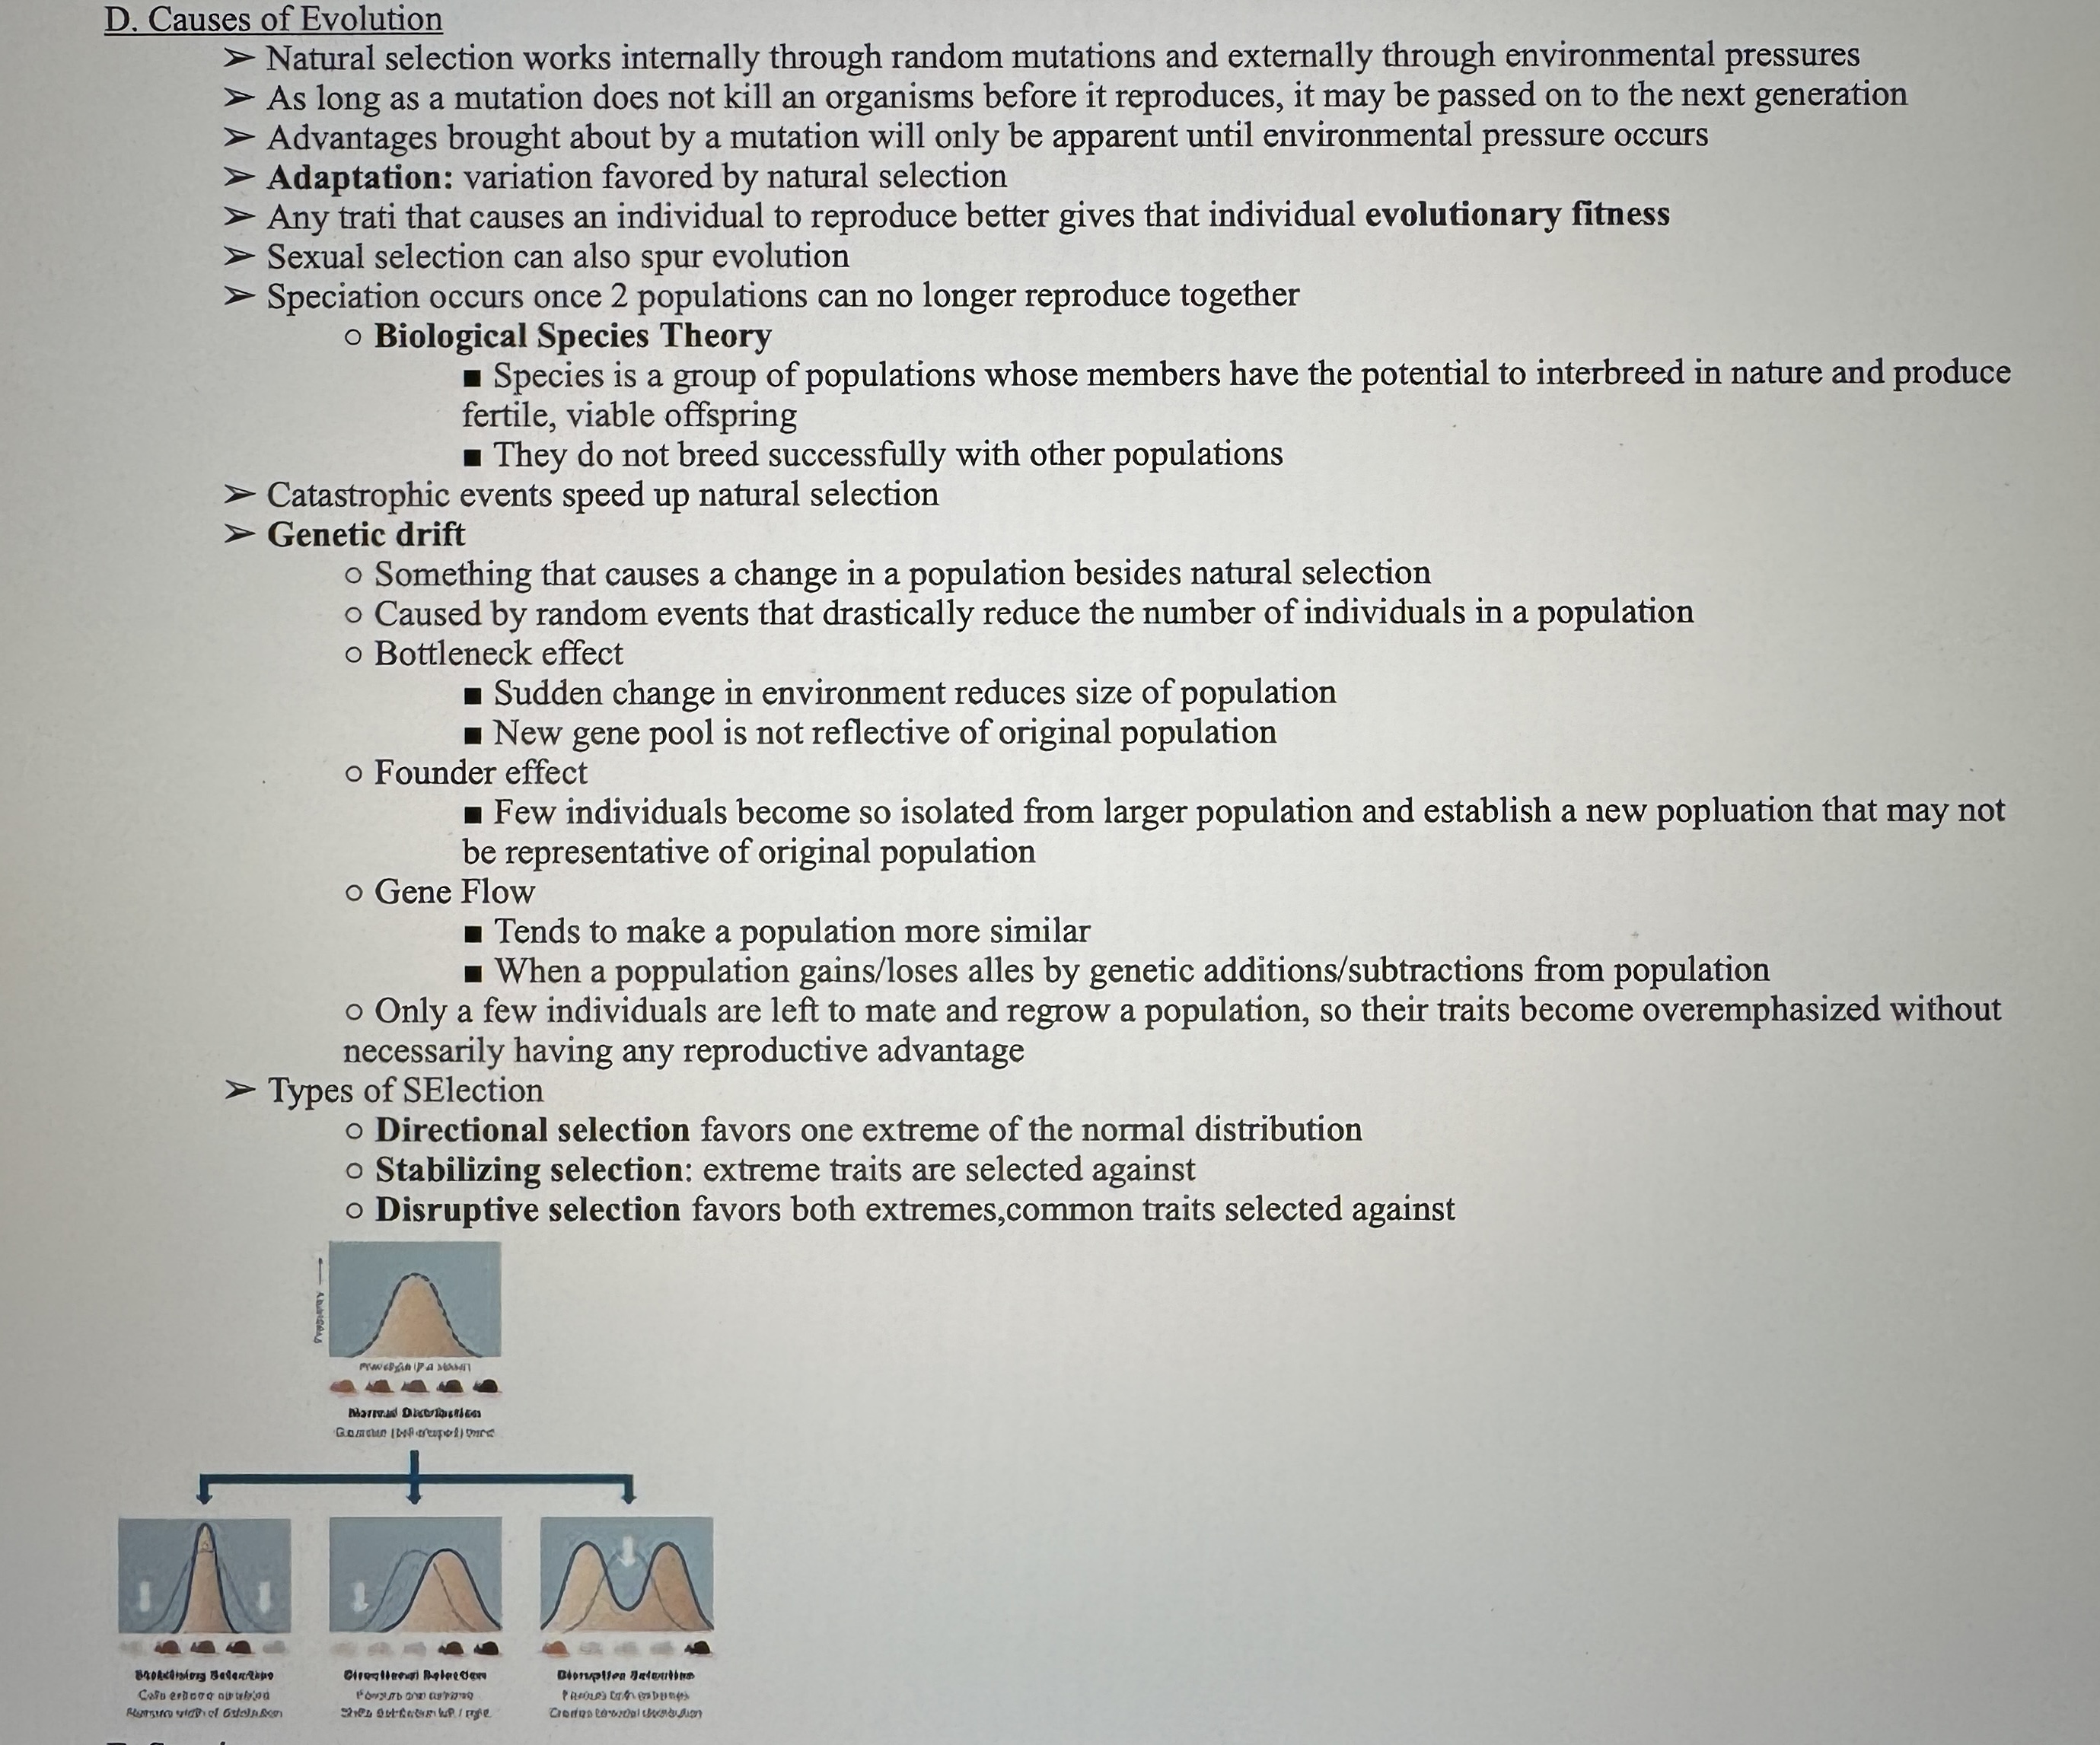
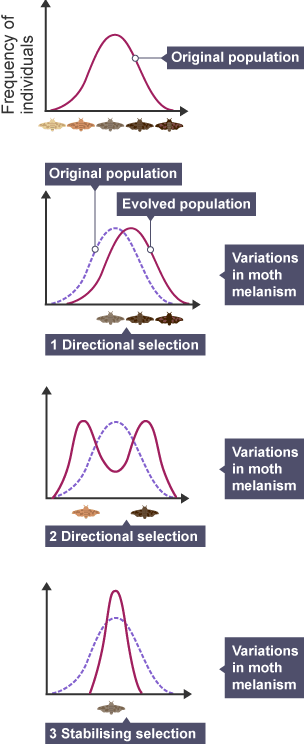
Types of Natural Selection:
• Directional Selection: Favors one extreme phenotype, shifting the population trait distribution in that direction.
• Stabilizing Selection: Favors intermediate phenotypes, reducing variation around the mean trait value.
• Disruptive Selection: Favors extreme phenotypes over intermediates, potentially leading to speciation.
Extra - Describe the Conditions under which allele and genotype frequencies will change in populations.
Conditions Leading to Changes in Allele and Genotype Frequencies:
• Mutations: Introduce new alleles, altering frequencies.
• Gene Flow (Migration): Movement of individuals between populations changes allele frequencies.
• Genetic Drift: Random changes in small populations can fix or lose alleles.
• Non-Random Mating: Preferences can shift genotype frequencies.
• Natural Selection: Advantageous alleles become more common.
Hardy-Weinberg Equilibrium (HWE):
• Definition: A model where allele and genotype frequencies remain constant across generations, indicating no evolution.
• Conditions for HWE:
• No mutations
• No migration
• Large population size
• Random mating
• No natural selection
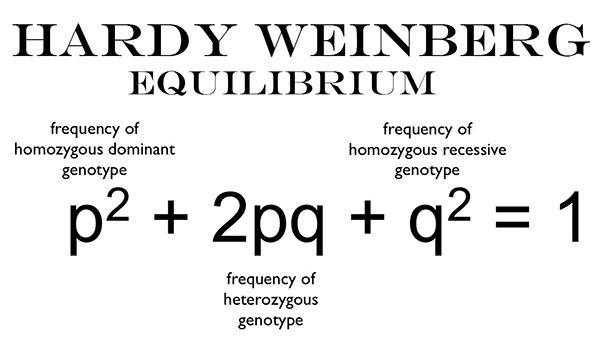
Calculating Allele Frequencies from Genotype Frequencies:
• Allele Frequencies:
• p = frequency of dominant allele (A)
• q = frequency of recessive allele (a)
• Genotype Frequencies:
• AA = p²
• Aa = 2pq
• aa = q²
• Relationships:
• p + q = 1
• p² + 2pq + q² = 1
Identifying Variables in the Hardy-Weinberg Equation:
• p: Frequency of dominant allele (A)
• q: Frequency of recessive allele (a)
• p²: Frequency of homozygous dominant genotype (AA)
• 2pq: Frequency of heterozygous genotype (Aa)
• q²: Frequency of homozygous recessive genotype (aa)
Extra - Explain impact of any of conditions of hardy- Weinberg sent met.
Impacts of Violating Hardy-Weinberg Conditions:
• Evolutionary Changes: Deviations from Hardy-Weinberg equilibrium, such as mutations, gene flow, non-random mating, genetic drift, and natural selection, lead to changes in allele frequencies, indicating evolutionary processes.
• Loss of Genetic Variation: Genetic drift, particularly in small populations, can reduce genetic diversity, potentially leading to the fixation of deleterious alleles and affecting population viability.
Susceptibility of Small Populations to Allele Frequency Changes:
• Genetic Drift: In small populations, chance events can cause significant fluctuations in allele frequencies, leading to rapid evolutionary changes and potential loss of genetic diversity.
• Founder and Bottleneck Effects: Small founding groups or population bottlenecks can result in reduced genetic variation, making populations more susceptible to genetic drift and divergent evolution.
Extra - Describe types of data that show evidence of evolution.
Types of Data Providing Evidence for Evolution:
• Fossil Record: Chronicles the progression of life forms over time.
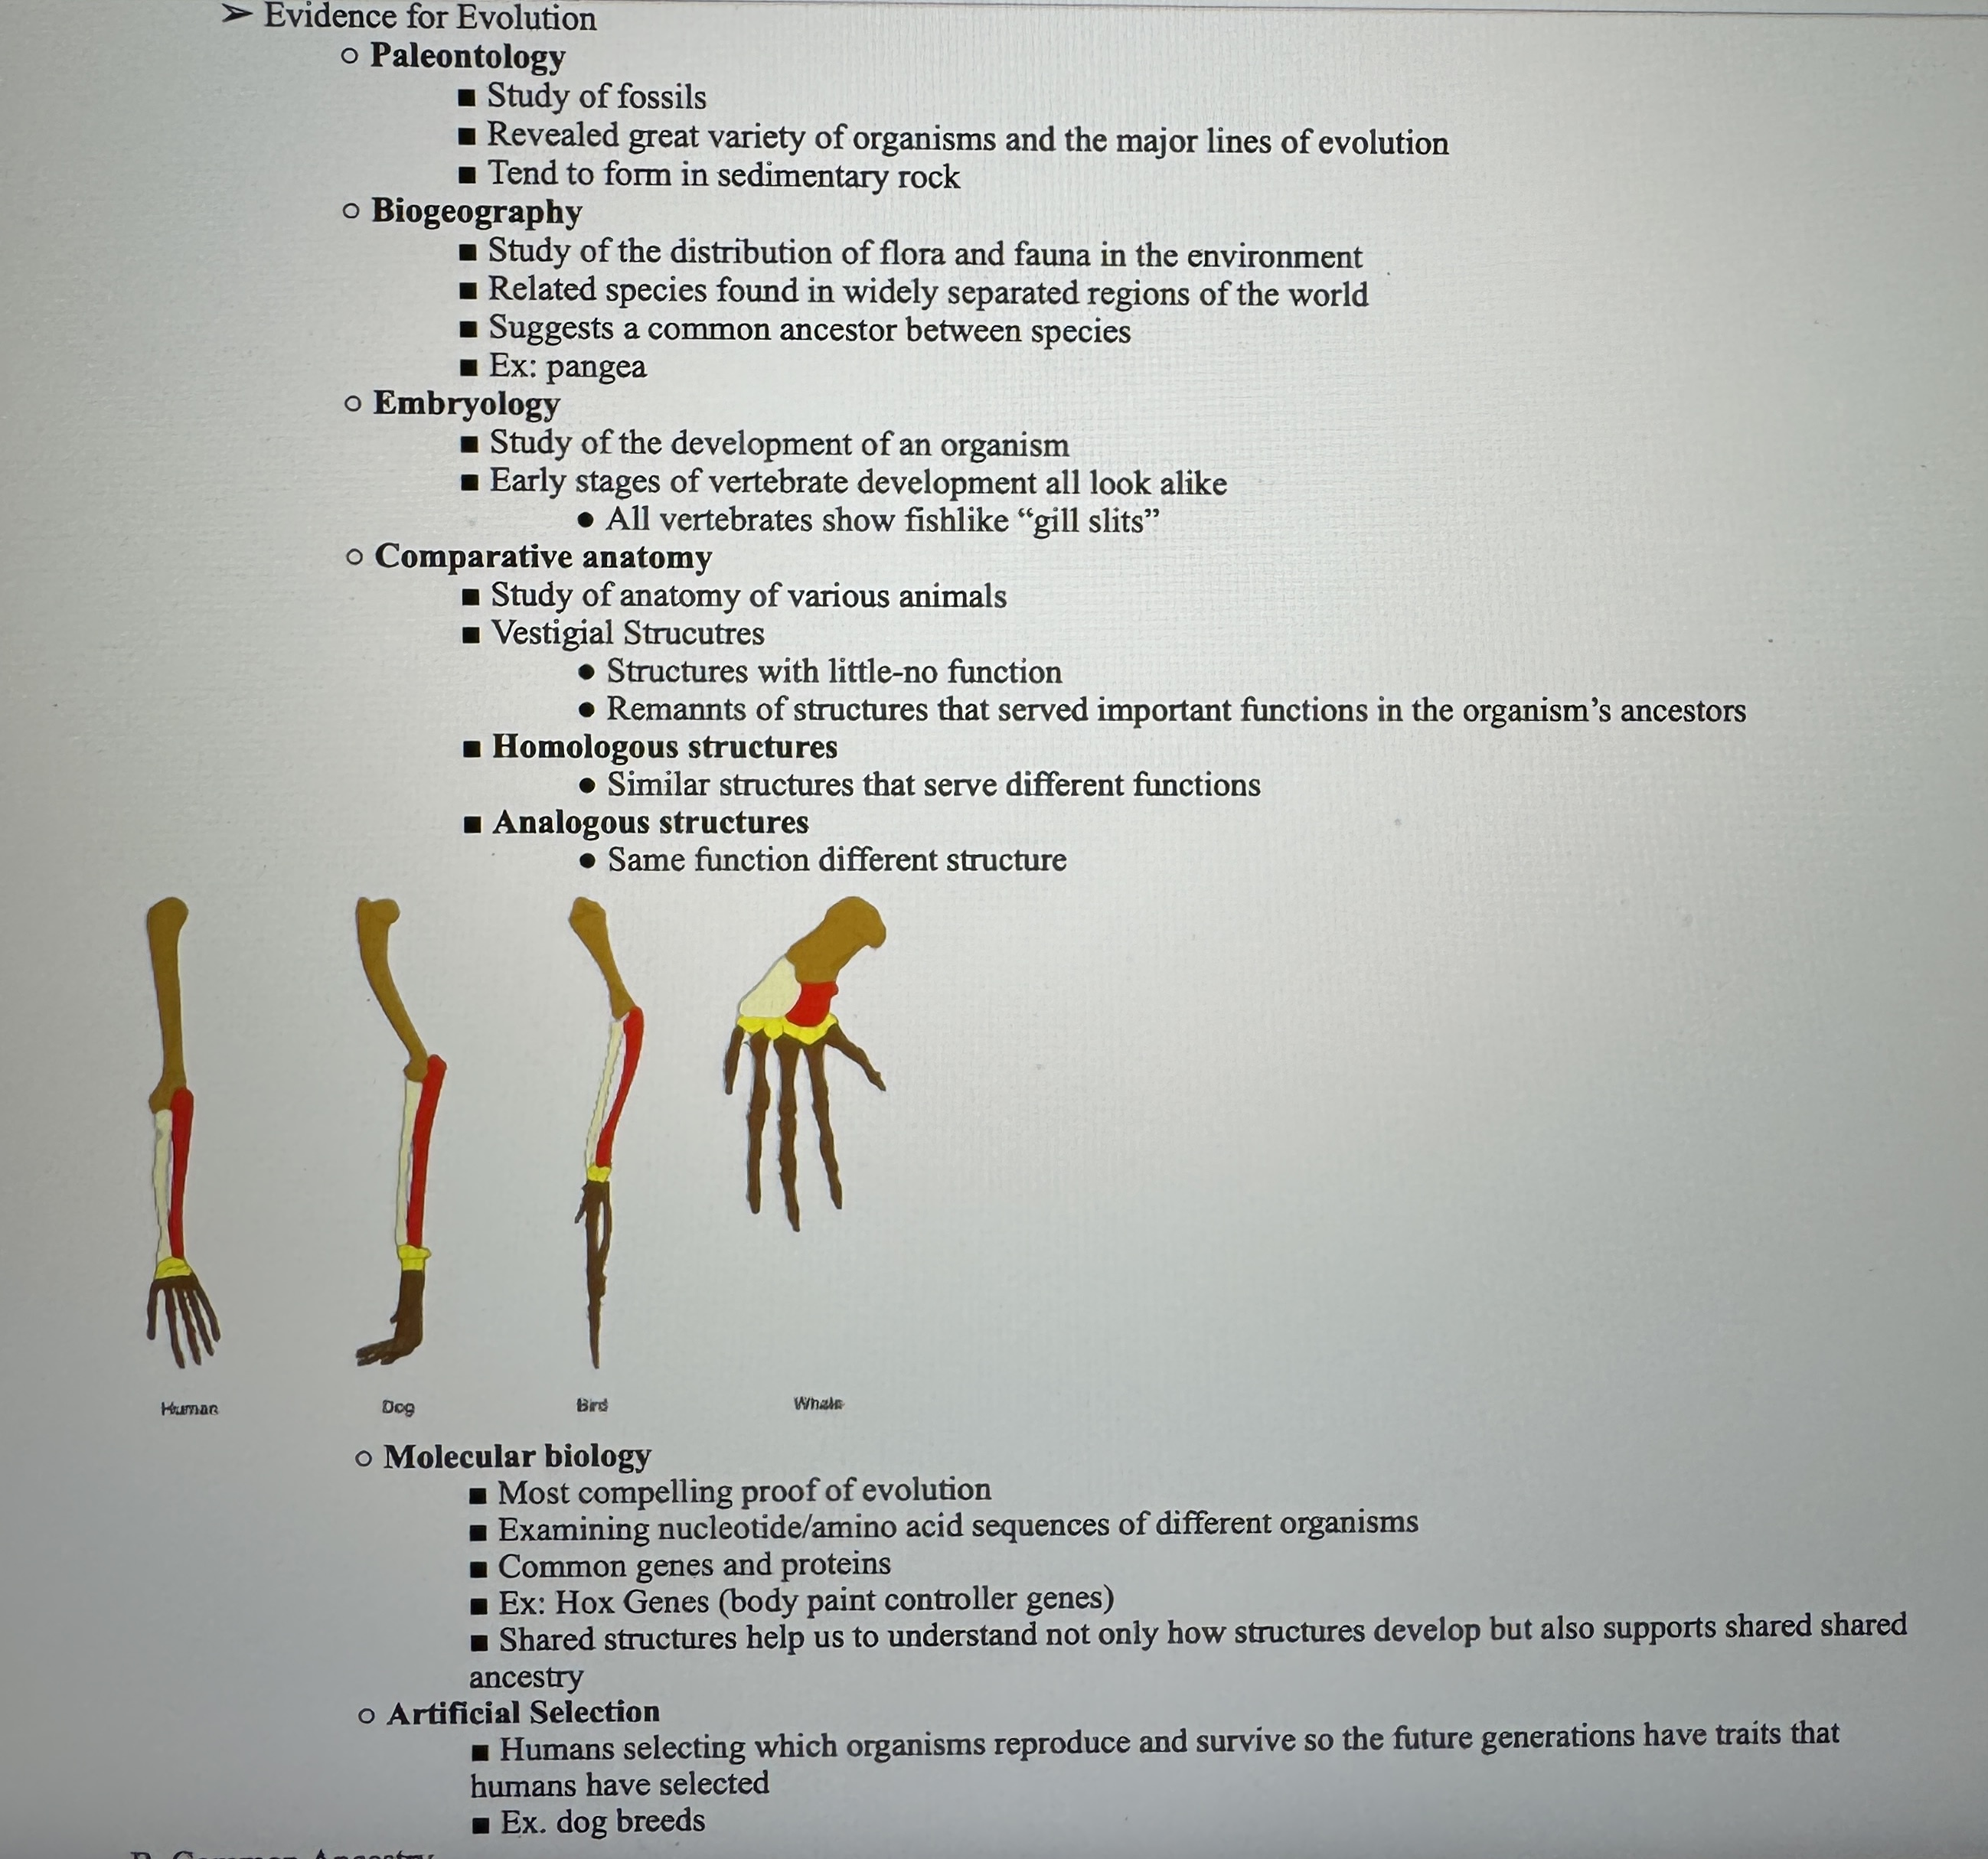
• Comparative Anatomy: Examines similarities in structure among different species, indicating common ancestry.
• Biogeography: Studies the geographic distribution of species, supporting evolutionary patterns.
• Genetic Data: Analyzes DNA sequences to reveal evolutionary relationships.
• Direct Observation: Documents observable evolutionary changes in contemporary populations.
• Biochemical Evidence: Investigates similarities in metabolic pathways and proteins across species.
Extra - Explain how data provides evidence organism change over time.
Morphological Evidence:
• Fossil Record: Fossils document the existence of now-extinct past species that are related to present-day species. 
Biochemical Evidence:
• DNA and Protein Similarities: Comparisons of DNA nucleotide sequences and protein amino acid sequences show evolutionary relationships between different species. 
Geological Evidence:
• Stratigraphy: The study of rock layers helps determine the relative ages of fossils, supporting evolutionary timelines. 
Fossil Dating Methods:
• Stratigraphic Dating: Determining the age of fossils based on the age of the rock layers where they are found.
• Carbon-14 Dating: Measuring the decay of carbon-14 isotopes in fossils to estimate their age.
DNA Sequence Comparison:
• Nucleotide Analysis: Comparing DNA sequences across species reveals genetic similarities indicative of common ancestry. 
Protein Sequence Comparison:
• Amino Acid Analysis: Examining similarities in protein sequences among species provides evidence for evolutionary relationships.
Extra - describe the fundamental molecular and cellular features shared across all domains of life
Fundamental Features Supporting Common Ancestry:
• Genetic Code Universality: All life forms share the same genetic code, indicating a common origin.
• Conserved Genes: Key genes involved in essential cellular functions are remarkably similar across all domains, highlighting evolutionary relationships.
• Membrane-Bound Organelles: Eukaryotes possess membrane-bound organelles, a structural feature suggesting a shared ancestry.
• Ribosomal RNA (rRNA) Sequences: Comparisons of rRNA sequences across diverse organisms reveal genetic similarities, supporting common ancestry.
• Metabolic Pathways: Similar biochemical pathways, such as glycolysis, are found in all domains, reflecting evolutionary conservation.
• Functional Proteins: Proteins like RNA polymerase exhibit functional similarities across species, providing evidence of shared ancestry.
Extra - Describe structural and functional evidence on cellular and molecular levels that provides evidence for the common ancestry of all eukaryotes
Structural and Functional Evidence for Common Ancestry of Eukaryotes:
• Membrane-Bound Organelles: Eukaryotic cells contain organelles like mitochondria and chloroplasts, which are absent in prokaryotes. These organelles have their own DNA and double membranes, supporting the endosymbiotic theory of eukaryotic evolution.
• Linear Chromosomes: Eukaryotes possess linear chromosomes with telomeres, unlike the circular chromosomes found in prokaryotes. This structural feature indicates a distinct evolutionary lineage.
• Introns in Genes: The presence of introns within eukaryotic genes is a distinctive feature not commonly found in prokaryotes, suggesting a unique evolutionary path.
Functional Evidence:
• Endomembrane System: Eukaryotes have an endomembrane system, including the nuclear envelope, which compartmentalizes cellular functions. This system is absent in prokaryotes, highlighting functional differences rooted in common ancestry.
Extra - Explain how evolution is an ongoing process in all living organisms.
1. Genomic Changes Over Time:
• Genetic mutations and horizontal gene transfer introduce genetic diversity within populations, driving evolutionary change.
2. Fossil Record Evidence:
• Fossils exhibit a continuous sequence of morphological changes over time, documenting evolutionary transitions between species.
3. Evolution of Resistance:
• Pathogens and pests evolve resistance to antibiotics, pesticides, herbicides, and chemotherapy drugs through natural selection acting on genetic variations.
4. Pathogen Evolution and Emerging Diseases:
• Rapid mutations in pathogens can lead to new strains, causing emergent diseases and highlighting ongoing evolutionary processes.
Extra - Describe the types of evidence that can be used to infer an evolutionary relationship.
Types of Evidence for Evolutionary Relationships:
• Morphological Evidence: Comparisons of physical structures among organisms reveal homologous features indicative of common ancestry.
• Molecular Evidence: Analysis of DNA sequences and protein structures shows genetic similarities that support evolutionary connections.
• Fossil Record: Fossils document historical life forms and their evolutionary transitions over time.
• Biogeographical Evidence: The geographic distribution of species provides insights into evolutionary processes and historical separations.
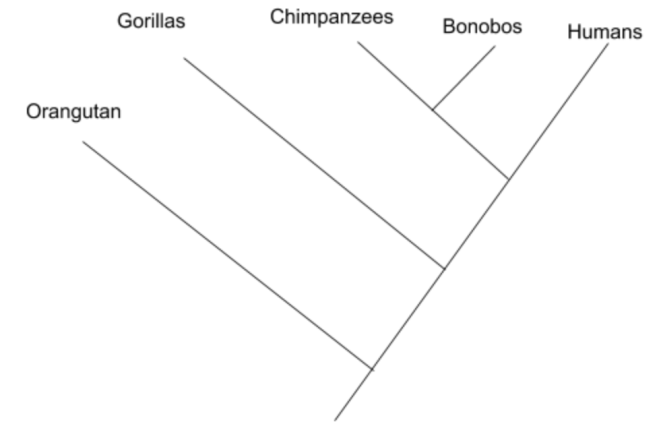
Phylogenetic Trees vs. Cladograms:
• Phylogenetic Trees: Diagrams that depict evolutionary relationships, illustrating common ancestors and divergence of species over time.
• Cladograms: Branching diagrams showing the relationships among species based on shared derived characteristics, without indicating evolutionary time scales.
Constructing Phylogenetic Trees and Cladograms:
• Shared Characters: Traits that are common among species, used to determine evolutionary relationships.
• Shared, Derived Characters (Synapomorphies): Traits that evolved in a common ancestor and are present in its descendants, crucial for defining clades.
• Outgroup: A species or group that is closely related to, but not part of, the group under study; used as a reference point to determine the direction of evolutionary changes.
• Identifying the Outgroup: In phylogenetic diagrams, the outgroup is typically placed outside the main branching pattern, serving as a baseline for comparison.
Reliable Data for Phylogenetic Analysis:
• Genetic Data: DNA sequencing provides precise information on genetic similarities and differences.
• Morphological Data: Physical characteristics offer observable evidence of evolutionary relationships.
• Fossil Evidence: Fossils provide historical context for evolutionary changes over time.
• Embryological Data: Comparisons of embryonic development stages can reveal evolutionary connections.
• Behavioral Data: Similarities in behavior patterns can also inform evolutionary relationships.
Extra - Explain how a phylogenetic tree and/or cladogram can be used to infer evolutionary relatedness.
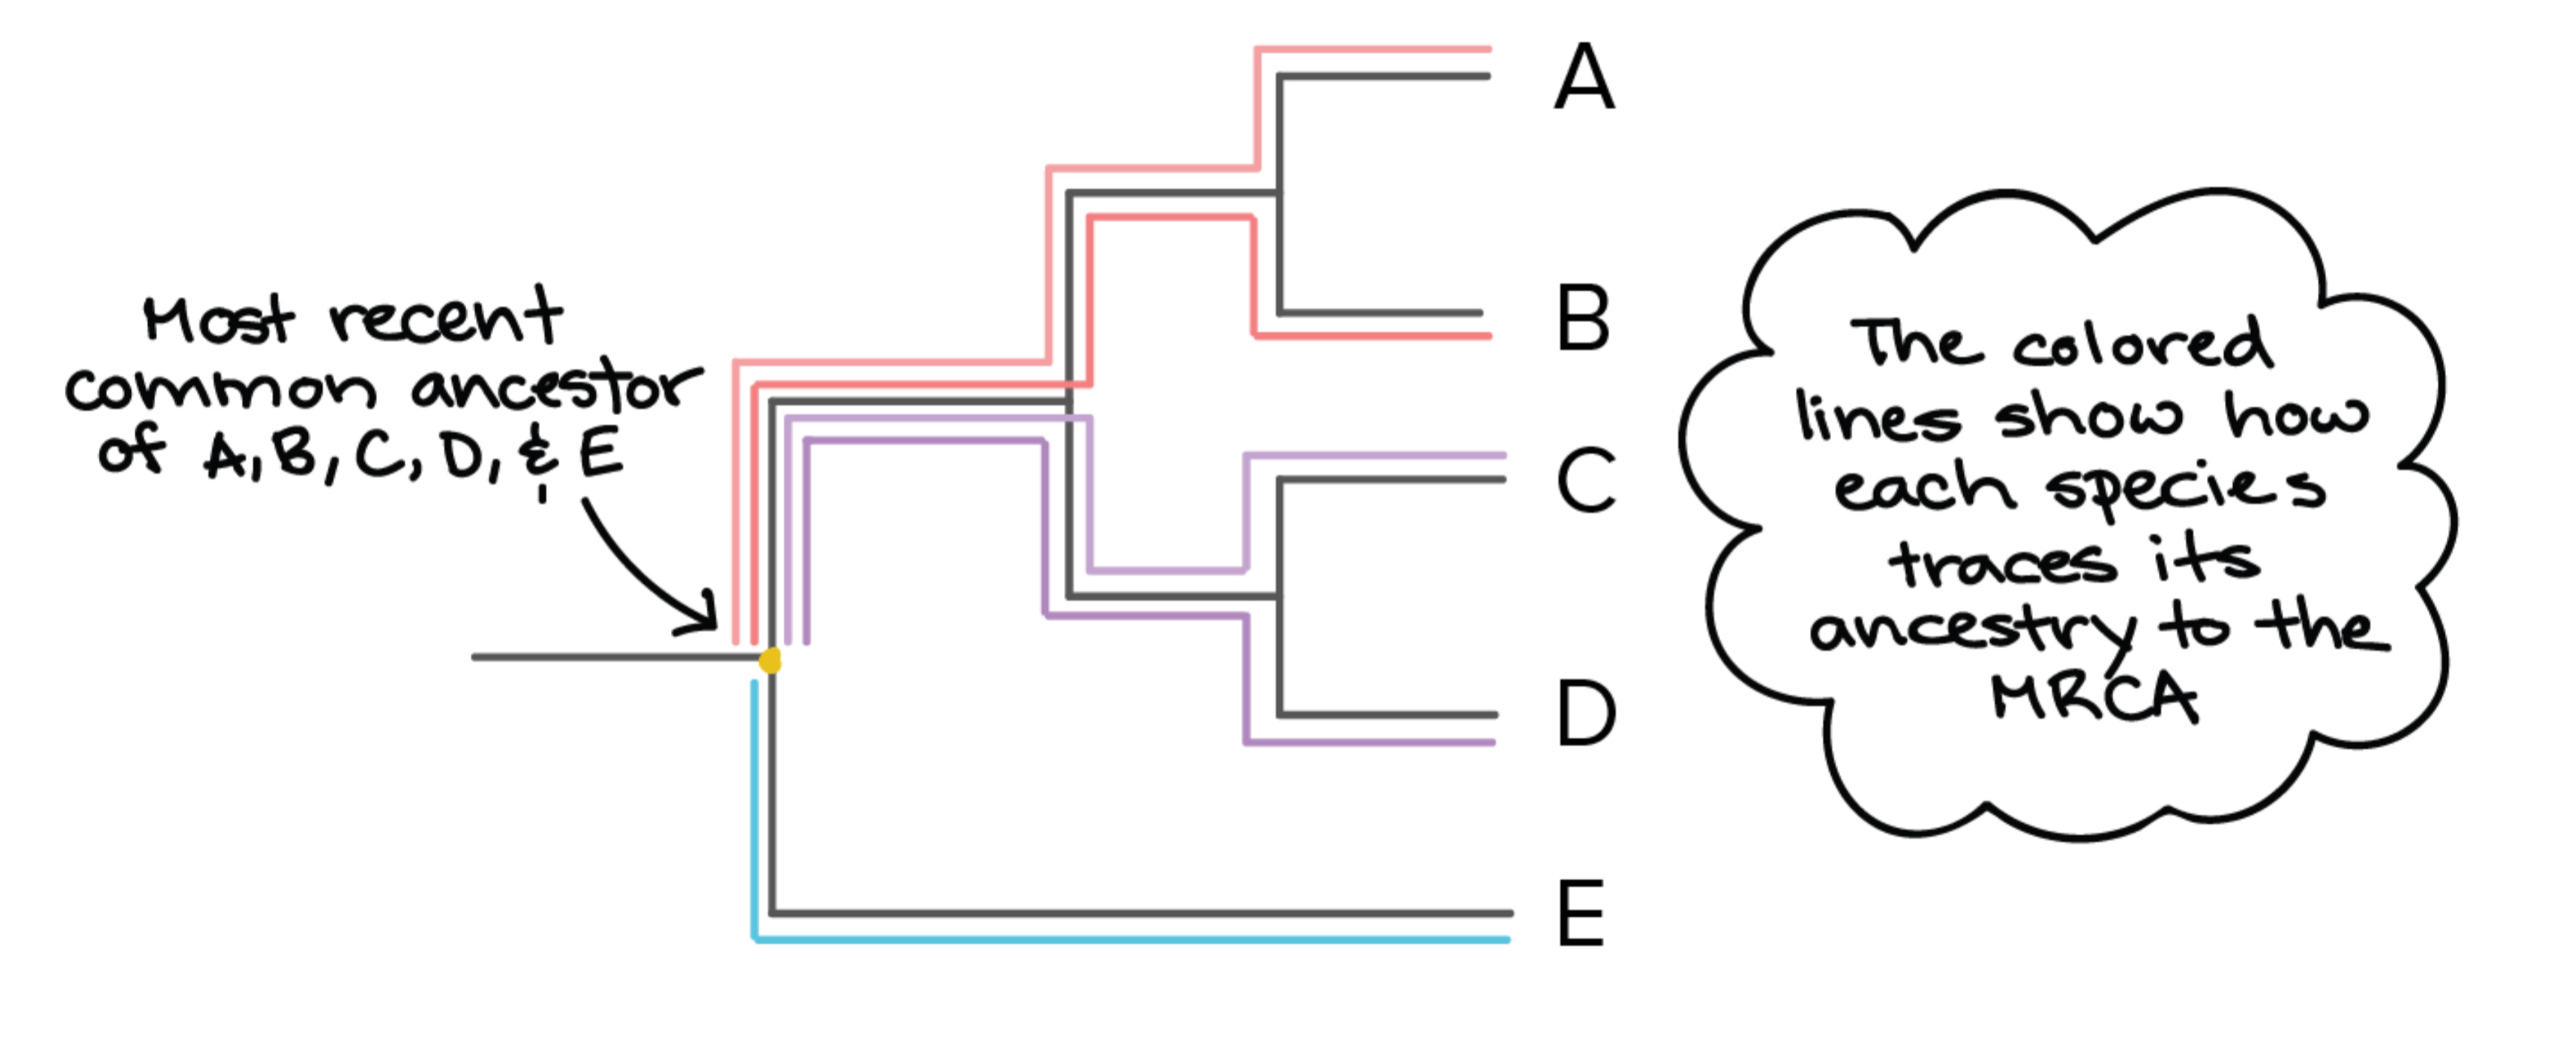
Interpreting Evolutionary Relationships:
• Phylogenetic Trees and Cladograms: These diagrams depict evolutionary relationships among species. By analyzing their branching patterns, we can infer common ancestors and the sequence of evolutionary events.
• Determining Speciation Events: Nodes (branch points) on these trees represent speciation events. The position of a node indicates when a common ancestor diverged into distinct lineages.
• Identifying Most Recent Common Ancestors (MRCA): The MRCA of two lineages is located at the node where their branches converge. This point signifies their last shared ancestor before diverging into separate species.
Constructing Phylogenetic Trees and Cladograms:
• Evidence Used:
• Morphological Data: Physical traits and structures are compared to determine evolutionary relationships.
• Genetic Data: DNA or protein sequences are analyzed to assess genetic similarities and differences. This method is particularly effective due to the vast amount of information DNA sequences provide.
• Fossil Evidence: Fossils offer historical context, showing how species have changed over time and aiding in placing species within the tree.
• Using DNA/Protein Sequences:
• Sequence Alignment: Aligning sequences from different species helps identify homologous regions, which are crucial for determining evolutionary relationships.
• Phylogenetic Analysis: Computational tools analyze these alignments to construct trees that reflect evolutionary histories.
• Revising Phylogenetic Trees:
• Incorporating New Evidence: As new data (e.g., genetic findings, fossil discoveries) become available, scientists update phylogenetic trees to reflect the most current understanding of evolutionary relationships.
• Methodological Advances: Improvements in analytical techniques allow for more accurate interpretations, leading to revisions of existing trees.
Extra - Describe the conditions under which new species may arise.
Speciation: Process by which new species arise when populations become reproductively isolated and diverge genetically.
• Reproductive Isolation: Barriers that prevent interbreeding between populations, leading to speciation.
• Biological Species Concept: Defines species as groups of interbreeding natural populations that are reproductively isolated from other such groups.
• Determining Same Species: If two organisms can interbreed and produce fertile offspring under natural conditions, they are considered the same species.
Extra - Describe the rate of evolution and speciation under different ecological conditions
Rate of Evolution and Speciation: Ecological factors, such as environmental changes and resource availability, influence how quickly species evolve and new species form.
• Punctuated Equilibrium: Evolution occurs in rapid bursts, followed by long periods of stability.
• Gradualism: Evolution proceeds through slow, continuous changes over time.
• Divergent Evolution: Species with a common ancestor evolve different traits, leading to speciation.
• Adaptive Radiation: A single ancestor species rapidly diversifies into multiple new species to exploit different resources.
Extra - explain the processes and mechanisms that drive speciation.
• Speciation: The process by which new species arise when populations become reproductively isolated and diverge genetically.
• Mechanisms Driving Speciation: Reproductive isolation mechanisms, such as prezygotic and postzygotic barriers, prevent gene flow between populations, leading to speciation.
• Results of Speciation: The emergence of new species that are genetically distinct and reproductively isolated from their ancestors.
• Sympatric Speciation: Speciation occurring within the same geographic area, often due to behavioral or ecological differences leading to reproductive isolation.
• Allopatric Speciation: Speciation resulting from geographic isolation, where physical barriers prevent gene flow between populations.
• Prezygotic Barriers: Reproductive barriers that occur before fertilization, preventing mating or fertilization from occurring.
• Habitat/Ecological Isolation: Populations occupy different habitats within the same area, reducing encounters.
• Temporal Isolation: Populations reproduce at different times, preventing mating.
• Behavioral Isolation: Differences in mating behaviors prevent recognition between species.
• Gametic Isolation: Mating occurs, but fertilization does not take place due to incompatible gametes.
• Geographical Isolation: Physical barriers prevent populations from interbreeding.
• Postzygotic Barriers: Reproductive barriers that occur after fertilization, affecting hybrid viability or fertility.
• Hybrid Breakdown: Hybrids are fertile but their descendants are inviable or sterile.
• Reduced Hybrid Viability: Hybrids do not develop properly or die early.
• Reduced Hybrid Fertility: Hybrids are sterile and cannot reproduce.
• Role of Reproductive Barriers in Speciation: Reproductive barriers prevent gene flow between populations, leading to genetic divergence and the formation of new species.
Extra - Describe factors that led to the extinction of a population
Factors Leading to Population Extinction:
Several interrelated factors can drive species to extinction:
• Habitat Loss: Destruction or alteration of natural habitats due to activities like deforestation, urban development, and agriculture diminishes the resources necessary for species’ survival.
• Introduction of Exotic Species: The introduction of non-native species can lead to competition, predation, or disease transmission to native species, often resulting in declines or extinctions of indigenous populations.
• Overharvesting: Unsustainable hunting, poaching, or fishing practices can severely reduce population sizes, sometimes leading to extinction.
• Climate Change: Alterations in climate patterns can disrupt habitats and food sources, challenging species’ ability to adapt or migrate to suitable environments.
• Pollution: Environmental pollutants can degrade habitats and directly harm species, contributing to population declines.
Historical Extinction Events:
Earth has experienced several mass extinctions, each significantly altering the course of evolution:
• Ordovician-Silurian Extinction (~440 million years ago): Approximately 85% of species, including many marine organisms, went extinct due to climate changes and glaciation.
• Late Devonian Extinction (~365 million years ago): Marked by a series of extinctions over several million years, this event primarily affected marine life, possibly due to widespread anoxia in oceans.
• Permian-Triassic Extinction (~252 million years ago): The most severe extinction event, eliminating up to 95% of species, including many marine and terrestrial organisms, likely caused by volcanic activity leading to climate shifts.
• Triassic-Jurassic Extinction (~201 million years ago): About 80% of species, including various dinosaurs, vanished, potentially due to volcanic activity and climate changes.
• Cretaceous-Paleogene Extinction (~66 million years ago): Notably marked by the extinction of non-avian dinosaurs, likely caused by asteroid impact and volcanic activity.
Impact of Ecological Stress on Extinction Rates:
Ecological stressors can significantly elevate extinction rates:
• Habitat Degradation: Loss of habitat quality and fragmentation can isolate populations, making them more susceptible to extinction.
• Invasive Species: The spread of non-native species can outcompete native species, introduce diseases, and alter habitats, leading to population declines.
• Pollution: Environmental contaminants can directly harm species and degrade habitats, contributing to population declines.
Extra - explain how the risk of extinction is affected by changes in the environment
Notecard 1: Impact of Environmental Changes on Extinction Risk
• Habitat Loss: Destruction or alteration of habitats (e.g., deforestation, urbanization) reduces living spaces, leading to population declines.
• Climate Change: Shifts in temperature and precipitation patterns can force species to migrate or adapt, increasing extinction risk if they cannot cope.
• Pollution: Introduction of pollutants can degrade habitats and directly harm organisms, contributing to population declines.
Notecard 2: Human Activities Driving Ecosystem Changes
• Deforestation: Clearing forests for agriculture or development leads to habitat loss and fragmentation.
• Urbanization: Expansion of cities alters natural landscapes, affecting local flora and fauna.
• Pollution: Release of pollutants contaminates air, water, and soil, disrupting ecosystems.
• Overexploitation: Unsustainable hunting, poaching, and overfishing deplete species populations.
• Invasive Species Introduction: Introducing non-native species can disrupt local ecosystems by outcompeting native species or introducing diseases.
Notecard 3: Ecosystem Changes Leading to Extinctions
• Habitat Fragmentation: Breaking up habitats isolates species, hindering movement and reproduction.
• Loss of Biodiversity: Decline in species diversity weakens ecosystem resilience, making it more susceptible to collapse.
• Altered Food Webs: Changes in species populations can disrupt food chains, leading to cascading effects.
• Disease Spread: Environmental changes can introduce new diseases, affecting species survival.
Extra - explain species diversity in an ecosystem as a function of speciation in extinction rates
Notecard 1: Species Diversity, Speciation, and Extinction Rates
• Species Diversity: Variety of species within an ecosystem; influenced by rates of speciation (new species formation) and extinction (species loss).
• Speciation Rate: Frequency at which new species arise; higher rates can increase diversity.
• Extinction Rate: Frequency at which species disappear; higher rates can decrease diversity.
• Balance Impact: Ecosystem diversity results from the balance between speciation and extinction rates.
Notecard 2: Predicting Diversity Changes Based on Speciation and Extinction Rates
• Increased Speciation Rate: If speciation rate surpasses extinction rate, species diversity rises.
• Increased Extinction Rate: If extinction rate surpasses speciation rate, species diversity declines.
• Dynamic Equilibrium: Ecosystems strive for a balance; significant changes in either rate can disrupt this balance, leading to diversity fluctuations.
• Influencing Factors: Geographical range sizes, environmental conditions, and ecological interactions can affect these rates, thereby influencing overall diversity.
Extra - Explain how extinction can make new environments available for added adaptive radiation
Notecard 1: Extinctions Opening Opportunities for Adaptive Radiation
• Vacant Niches: Extinctions can empty ecological niches, making them available for other species to exploit.
• Adaptive Radiation: The availability of these niches allows surviving species to diversify rapidly, adapting to new resources and environments.
• Example: Post-dinosaur extinction, mammals diversified to occupy niches previously held by dinosaurs, leading to the evolution of various new species.
Notecard 2: Impact of New Niches on Speciation
• Niche Exploration: Species migrating to and adapting to new niches can lead to genetic divergence from the original population.
• Isolation and Divergence: Occupying different niches can reduce gene flow between populations, leading to reproductive isolation and eventual speciation.
• Example: Colonization of islands by mainland species led to exploitation of new niches, resulting in morphological and behavioral adaptations, and eventually, speciation.
Extra - explain how the genetic diversity of a species or population affects its ability to withstand environmental pressures
Notecard 1: Genetic Diversity and Environmental Adaptability
• Enhanced Adaptability: Genetic diversity enables populations to adapt to environmental changes, increasing resilience to diseases and climate shifts.
• Increased Survival: Populations with diverse genetic traits have a higher likelihood of containing individuals suited to new or changing environments, reducing overall extinction risk.
• Reduced Extinction Risk: Low genetic diversity limits adaptive responses, heightening vulnerability to environmental pressures and elevating extinction risks.
Notecard 2: Impact of Genetic Diversity on Environmental Response
• Variable Responses: Different alleles can cause individuals to react uniquely to environmental factors, influencing fitness and survival.
• Environmental Sensitivity: Environmental conditions can affect gene expression, leading to phenotypic variations among individuals with the same genotype.
• Adaptive Potential: Genetic diversity provides the raw material for populations to evolve in response to environmental changes, ensuring long-term survival.
Extra - describe the scientific evidence that provides support for models of the origin of life on earth
Notecard 1: Origin of Life on Earth
• Earth’s Formation: Approximately 4.5 billion years ago, Earth formed from cosmic dust and gas.
• Primitive Earth: Early Earth had a hostile environment with high volcanic activity and meteor bombardment.
• Earliest Life Evidence: Fossilized microorganisms found in 3.7 billion-year-old rocks suggest life began around this time.
• Organic Molecule Formation: Experiments like the Miller-Urey experiment demonstrated that complex organic molecules can form from inorganic compounds under conditions simulating early Earth.
• RNA World Hypothesis: Proposes that self-replicating RNA molecules were precursors to current life forms, serving both as genetic material and catalysts.
Notecard 2: Geological Evidence Supporting Life’s Origin Models
• Zircon Analysis: 4.1 billion-year-old zircons contain carbon isotopes indicative of biological activity, hinting at early life.
• Asteroid Samples: NASA’s Osiris-Rex mission found organic compounds in asteroid Bennu samples, suggesting extraterrestrial contributions to life’s building blocks.
Notecard 3: Chemical Experiments Demonstrating Organic Molecule Formation
• Miller-Urey Experiment: Simulated early Earth conditions, producing amino acids from inorganic compounds, supporting abiogenesis theories.
• Microlightning Hypothesis: Research indicates that “microlightning” in water droplets could have facilitated the formation of essential organic molecules.
Notecard 4: Formation of Polymers from Monomers
• Polymerization: Under prebiotic conditions, monomers like amino acids and nucleotides can spontaneously link to form polymers such as proteins and RNA.
Notecard 5: RNA World Hypothesis
• Self-Replicating RNA: Suggests that RNA molecules capable of self-replication were precursors to current life forms, storing genetic information and catalyzing reactions.