Math 121 Exam 1 Questions fully solved & verified for accuracy(A+graded)
1/56
There's no tags or description
Looks like no tags are added yet.
Name | Mastery | Learn | Test | Matching | Spaced | Call with Kai |
|---|
No analytics yet
Send a link to your students to track their progress
57 Terms
Stratified sampling
grouping variable (ex, how women voted in the election, rural communities voted in the election, etc.) There is homogeneity within the sample and heterogeneity between the samples. Then, randomly sample within the group. This way tries to represent the results.
Random Sampling
The key technique employed by survey researchers, which operates on the principle that everyone should have an equal probability of being selected for the sample.
cluster sampling
Items are drawn from the population in groups, or clusters. This is useful when the population is too large and spread out for simple random sampling to be feasible. (Used by U.S. government agencies in sampling U.S population to measure sociological factors such as income and unemployment)
Convenience Sampling (voluntary response)
uses results that are easy to get (convenient for the person being asked, not the asker). Example: pop-up polls on social media. Another example, the Texas Roadhouse to-go survey. These results tend to be biased.
relative frequency
Relative frequency = frequency/sum of all frequencies
categorical data (qualitative data)
is a category, it comes in ordinal (limited number of possibilities) (there is an order to the categories) or non-ordinal (no order to the categories).
· Created a table for categorical data (one-way table)
· Also created a bar graph
· Created a pie chart (all with the same data)
P(A)
Probability A, happens
Experiment
how we get data
Sample space
the set of all possible outcomes (respresented by S) S= { yes, no, undecided, refuse to answer}
Probability
total number of ways a success happens/ total number of ways everything happens.
S= {HH, HT, TH, TT} (heads or tails of a coin that flips twice)
P(HH)= ¼
P(H.) (probability of flipping two coins) = 2/4 heads on first flip
or
mean addition
of
means multiply
and
means multiply
continuous data (quantitative data)
Data that can take any value (gpa, yearly income, commuter distance).
missing data
sometimes data can be randomly missing, and sometimes there is a story because they are missing. Informative data is when it is purposely missing. Ignorable data (when it is randomly missing).
systematic sample
The population items are ordered. So imagine walking alongside a line of people and choosing every third one.
Ordinal Data
data exists in categories that are ordered but differences cannot be determined or they are meaningless. (Example: 1st, 2nd, 3rd)
nominal data
Data which consists of names, labels, or categories.
sampling bias
Occurs when some members of the population are more likely to be included in the sample than others.
bins
The intervals that define the "bars" of a histrogram.
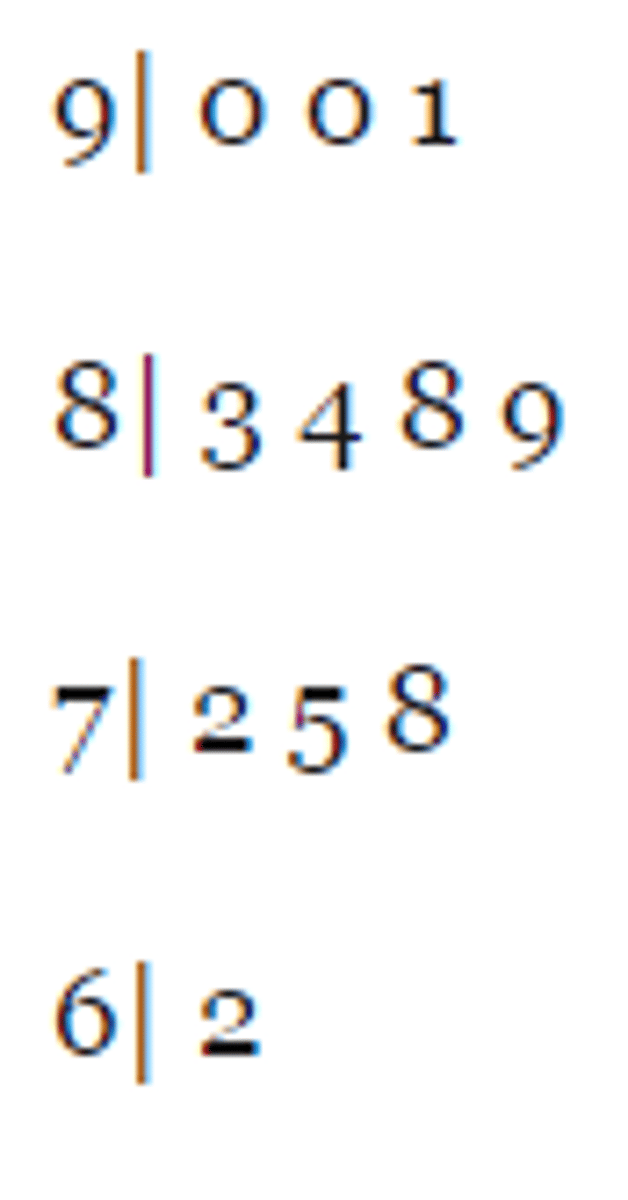
stemplots
(also called stem-and-leaf displays) are a kind of histogram that cleverly use the numerical data themselves to sort the data into bins, and to form the bars of the histogram.
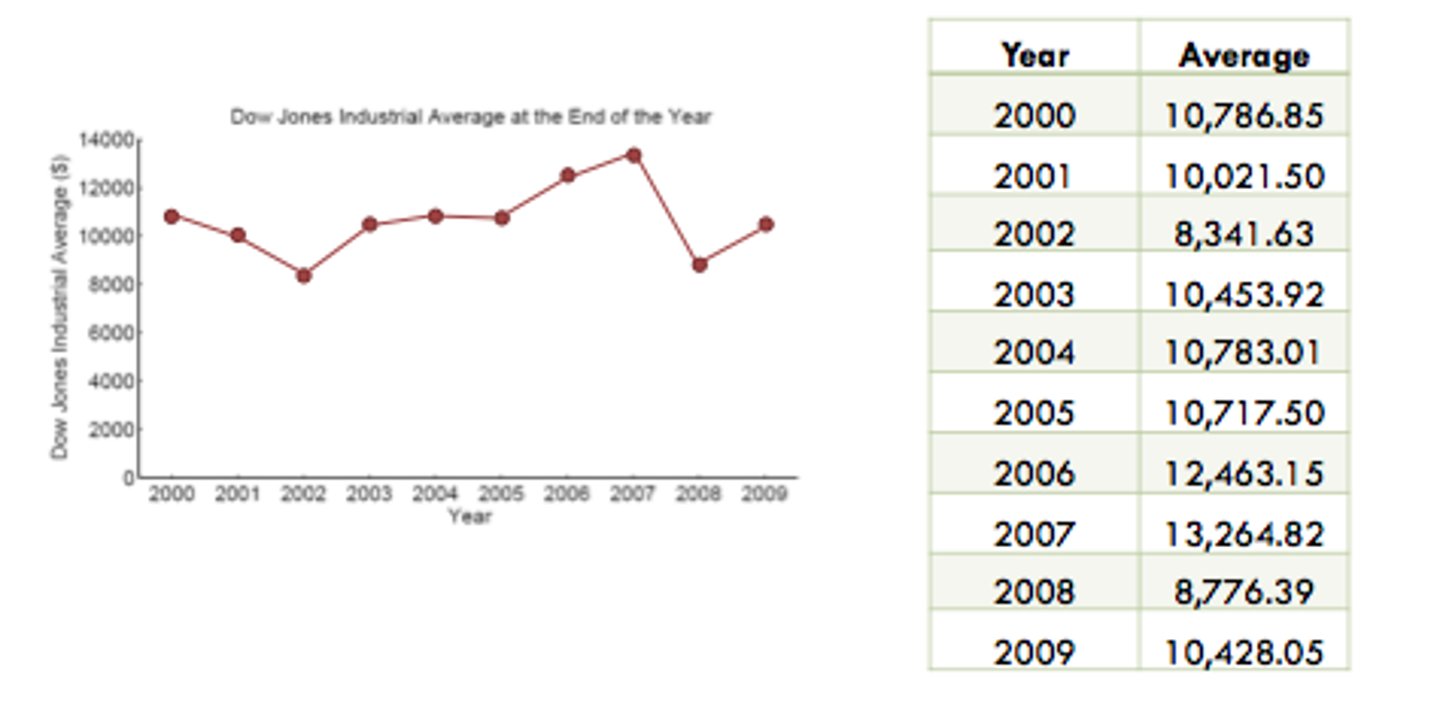
time plot
A time plot of a variable graphs the values of the variable against time.
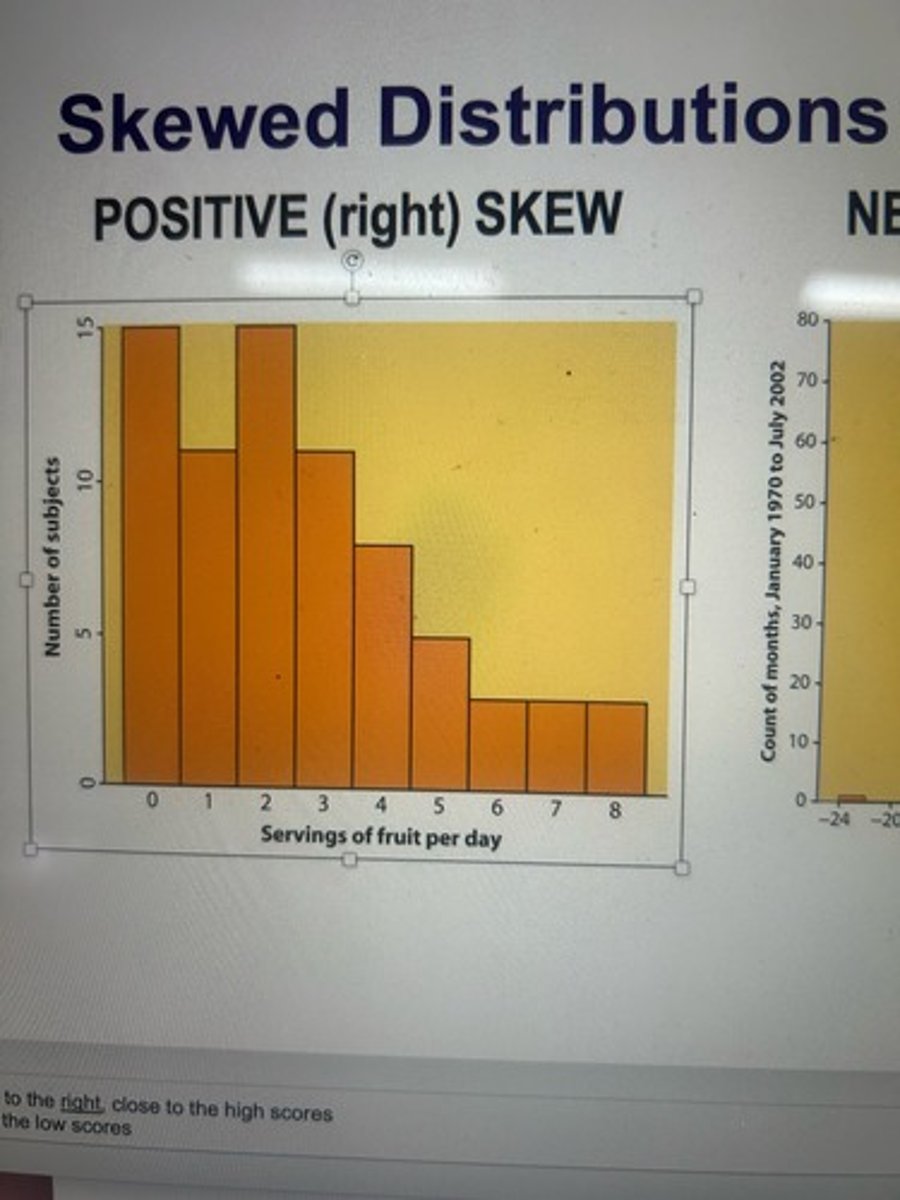
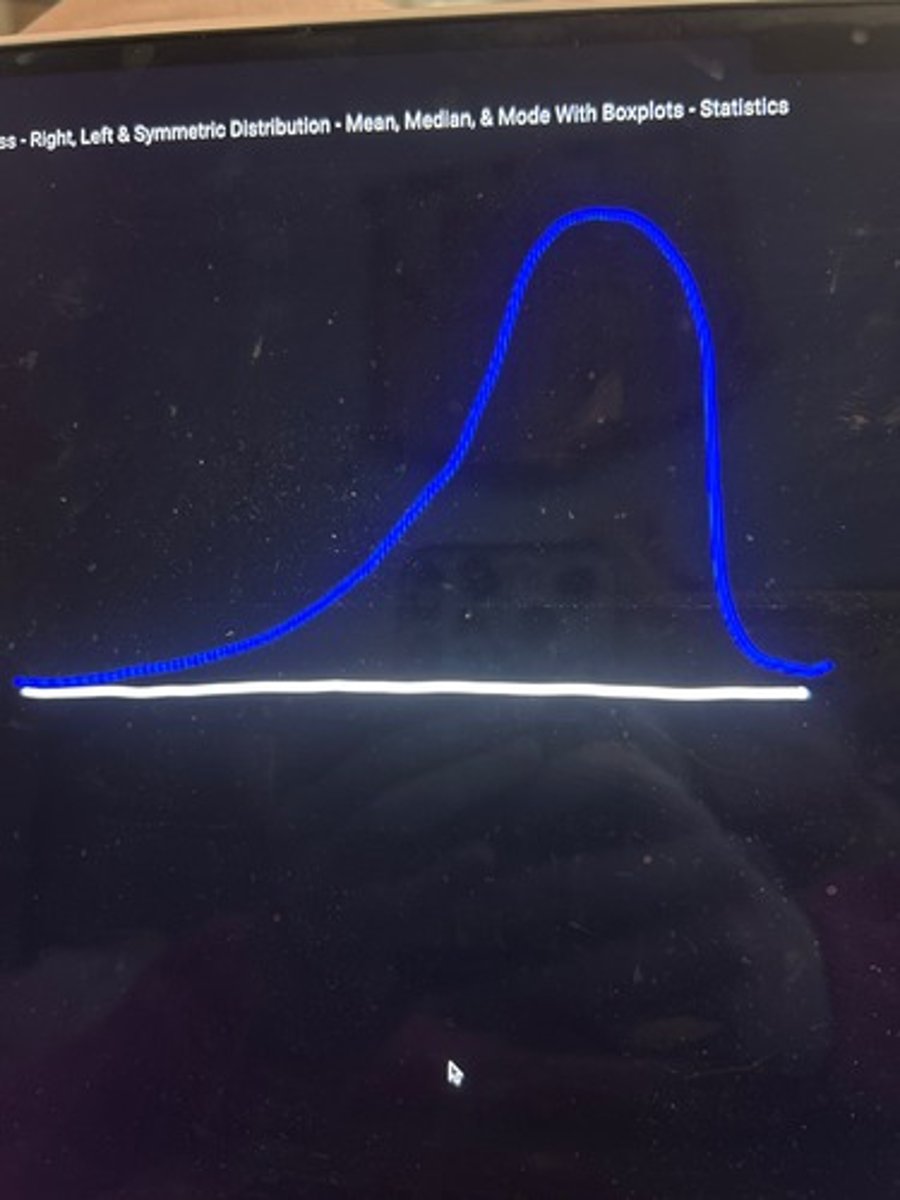
positive (right) skew
skewed distribution where data has many more scores toward the lower end of the distribution
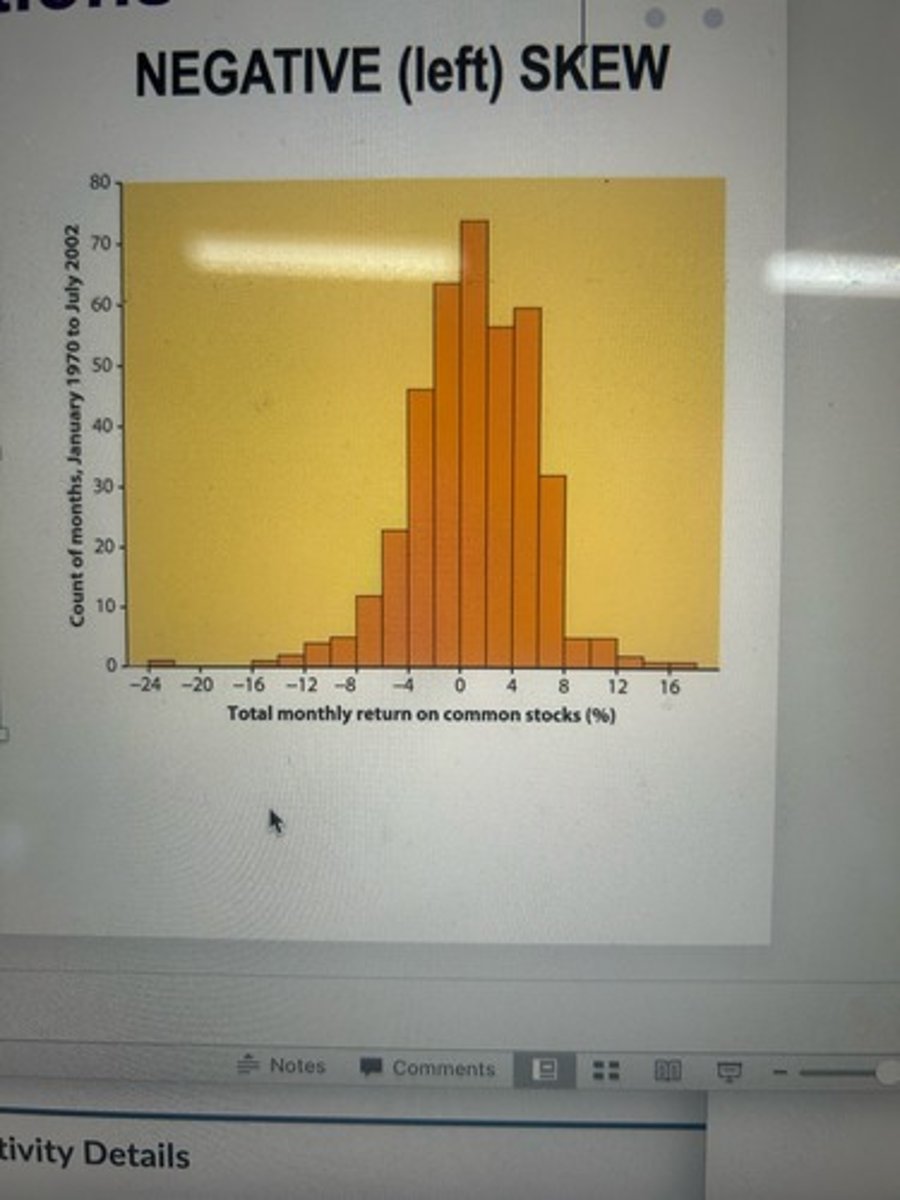
negative (left) skew
skewed distribution with many more scores on the higher end of the distribution
raw scores
Scores obtained by observation or from an experiment (i.e., the data)
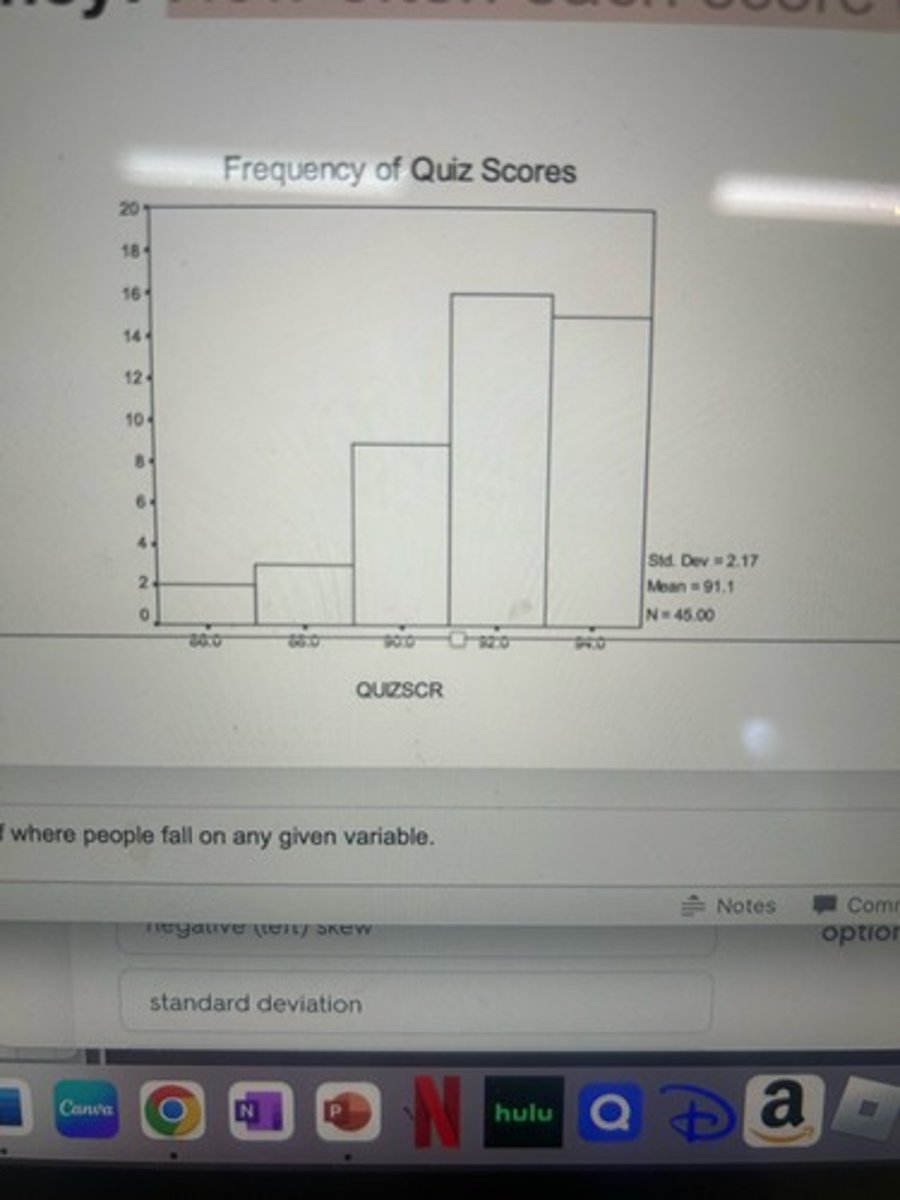
frequency
How often each score occurs
histograms
Frequency distribution graph of a quantitative variable with frequencies indicated by connected vertical bars.
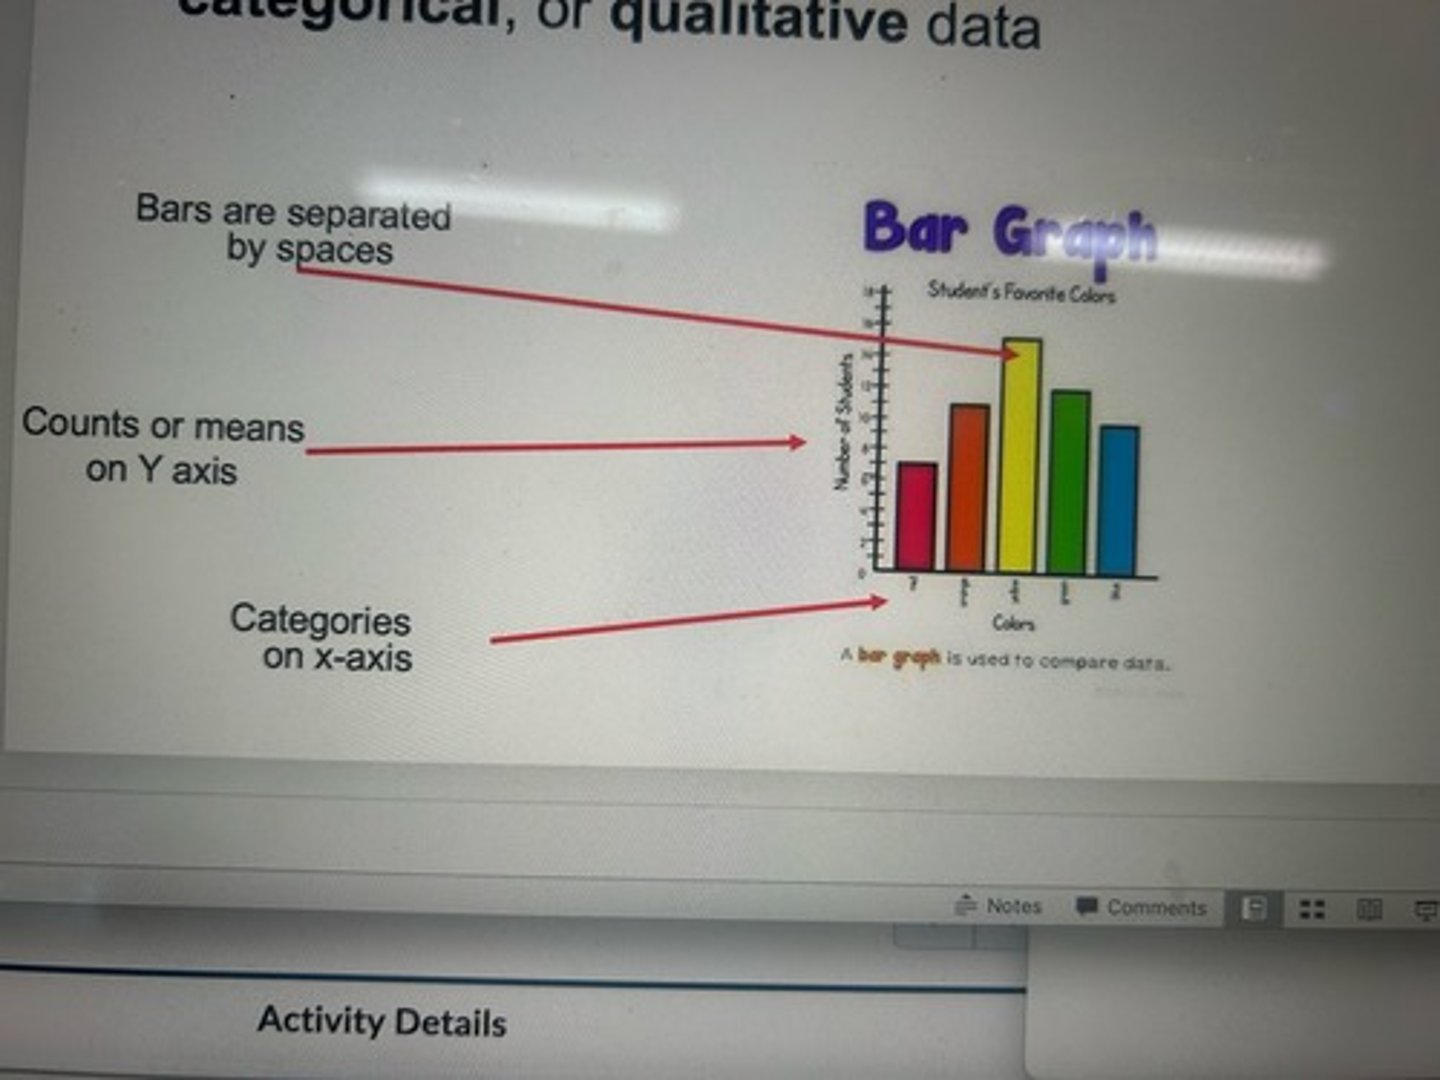
bar graph
frequency distribution of nominal, categorical, or qualitative data
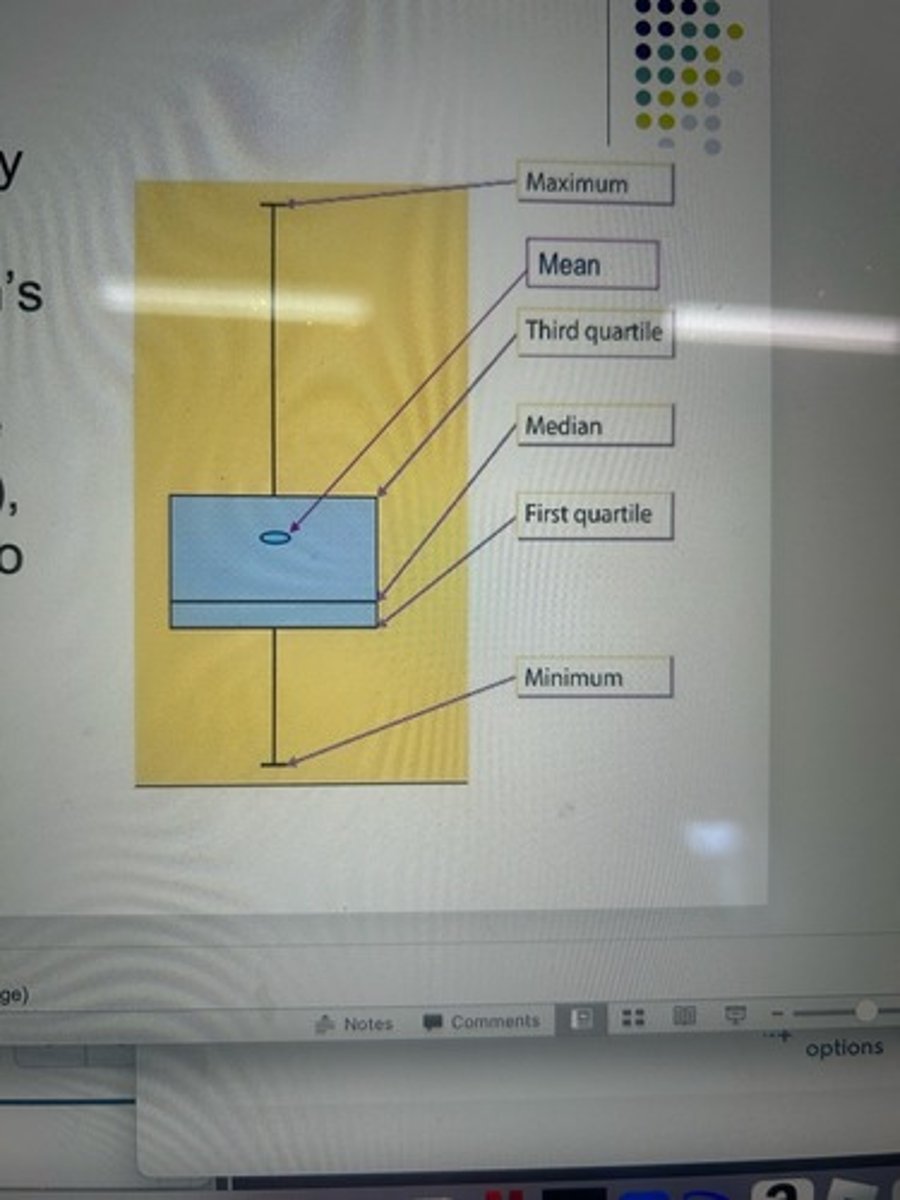
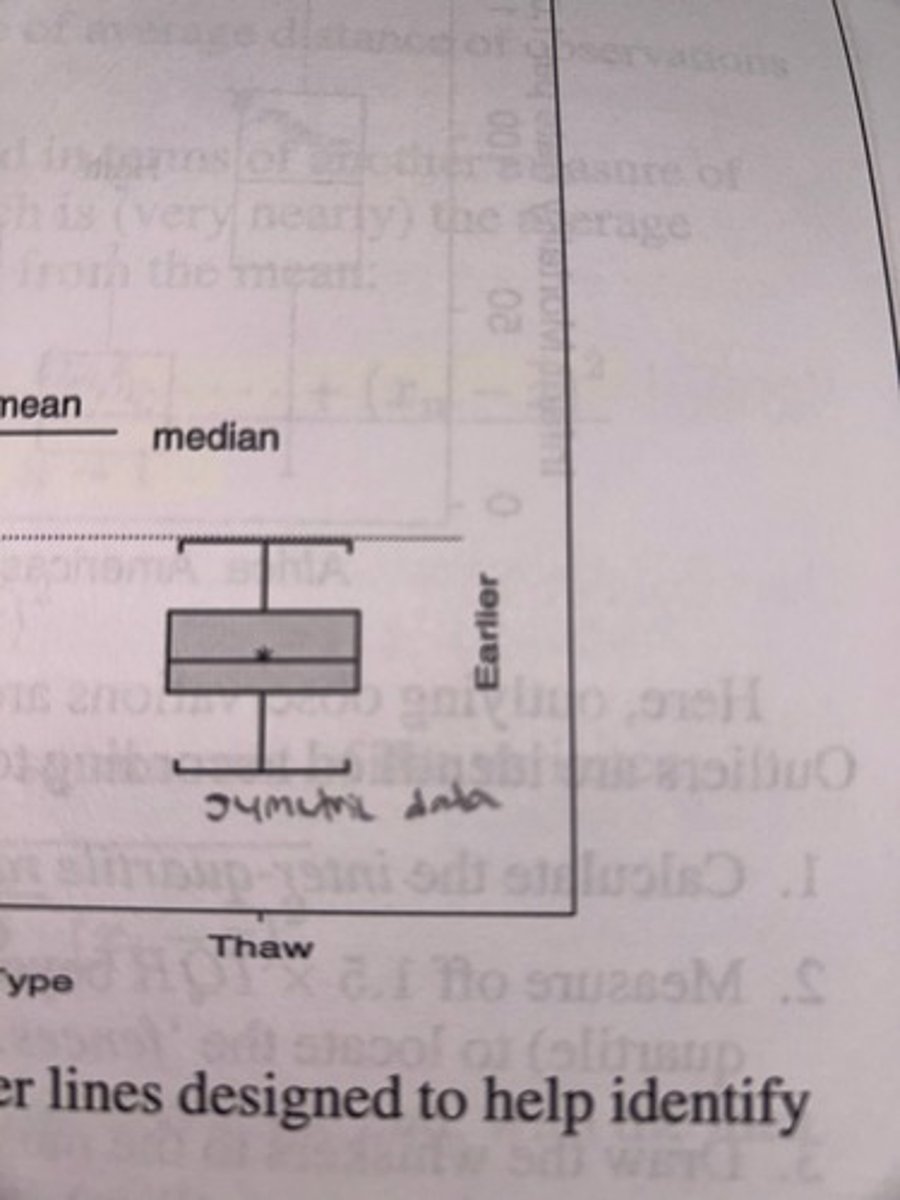
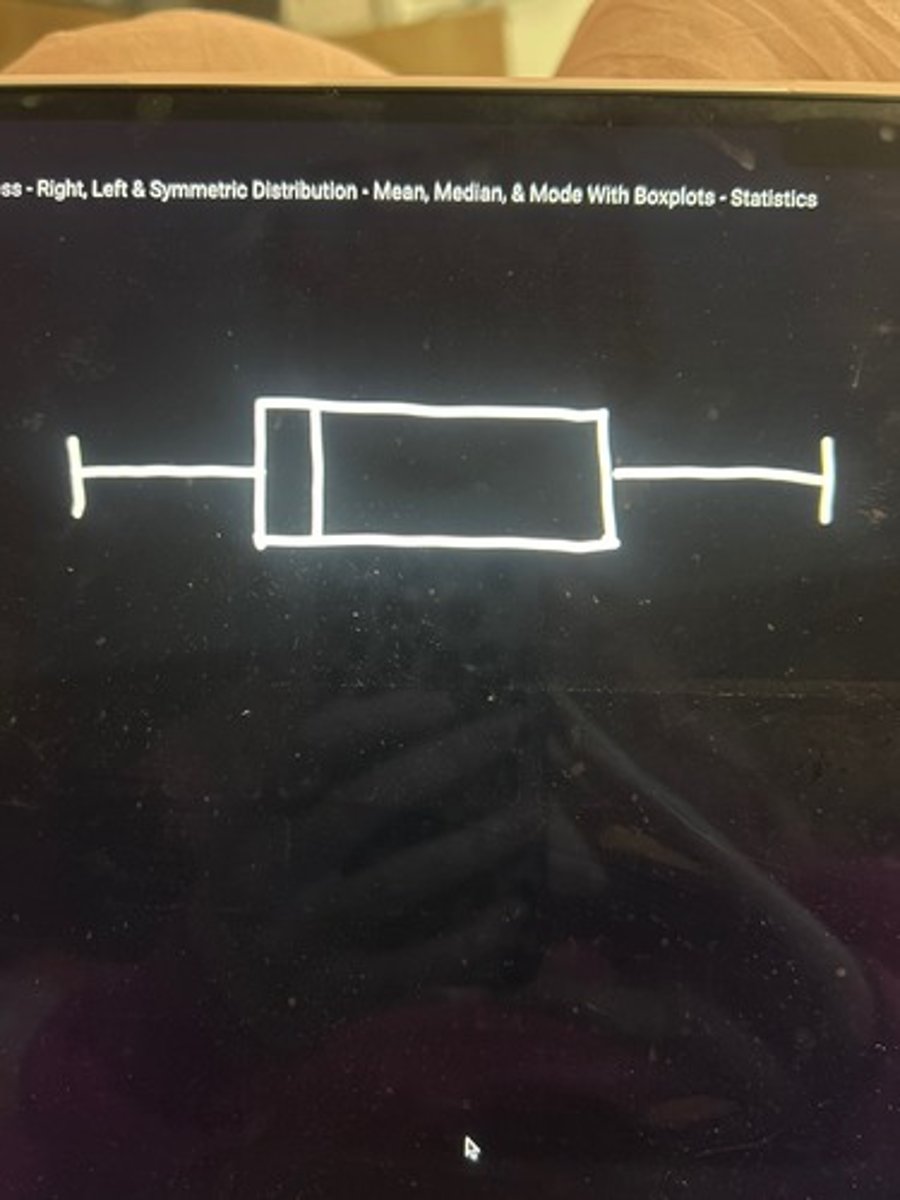
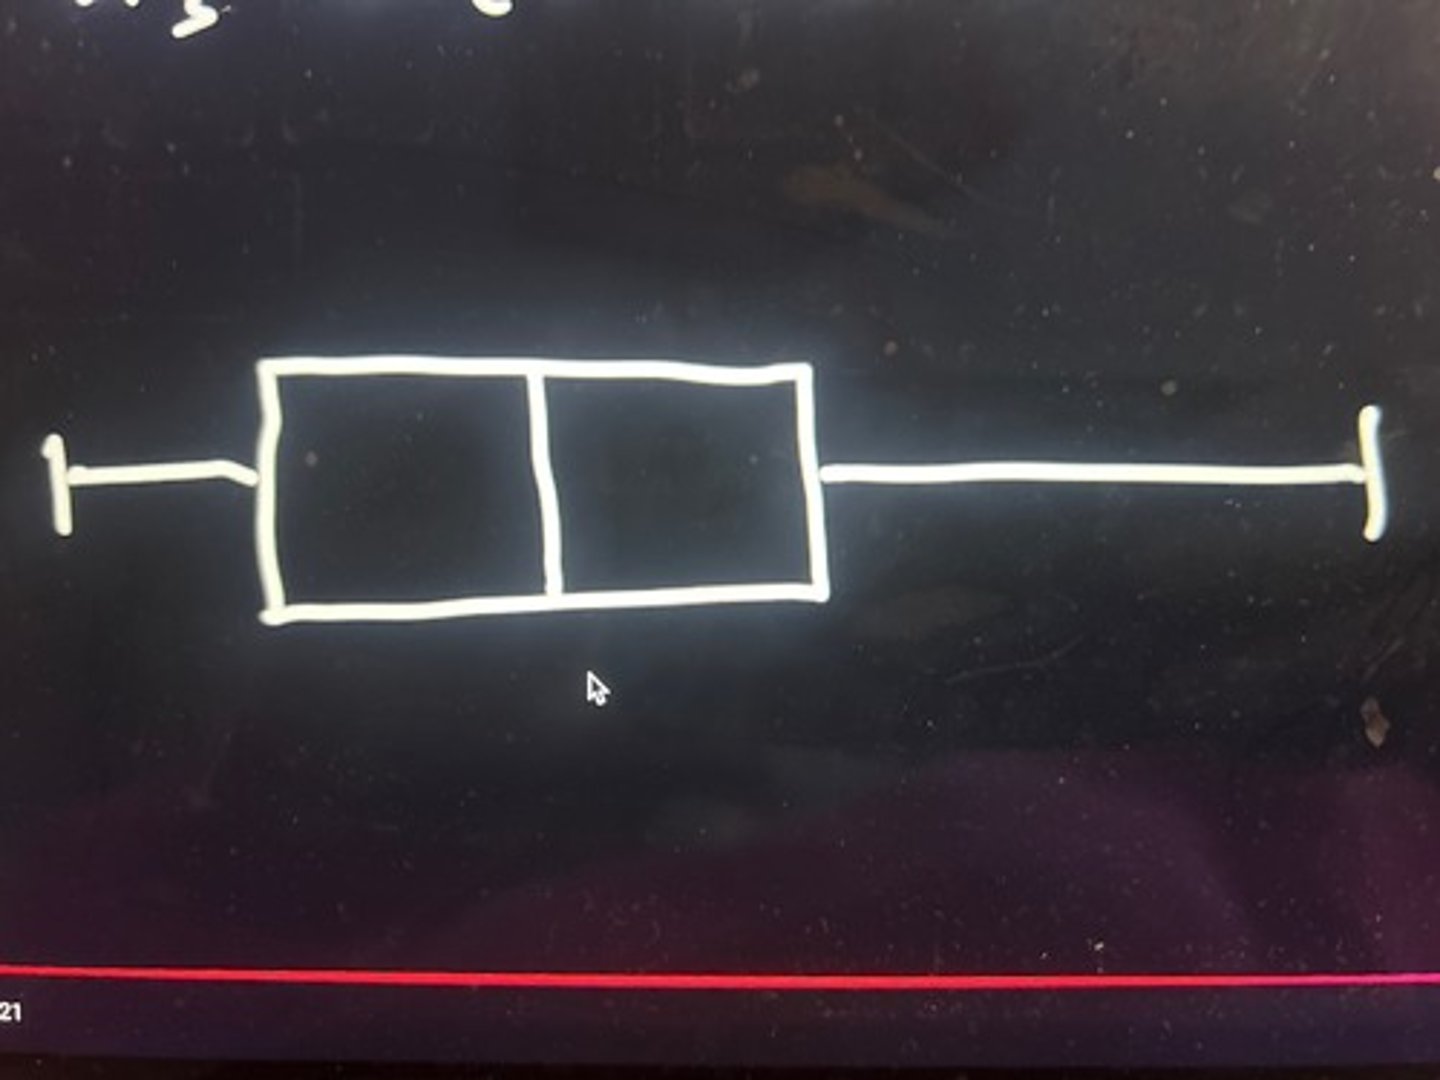
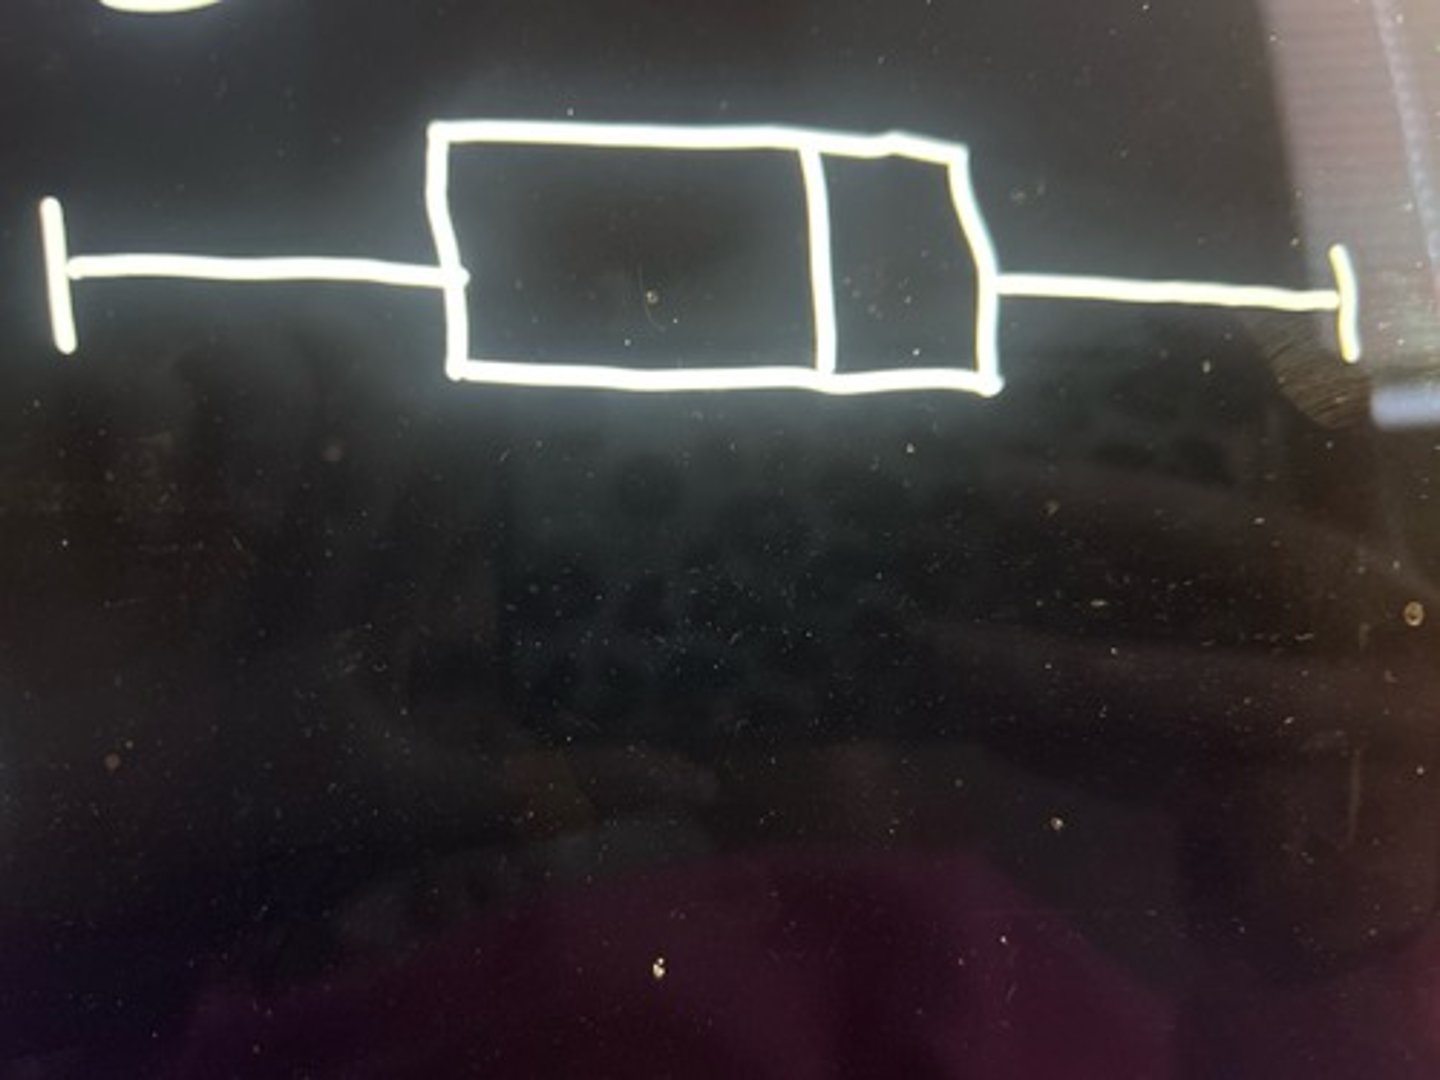
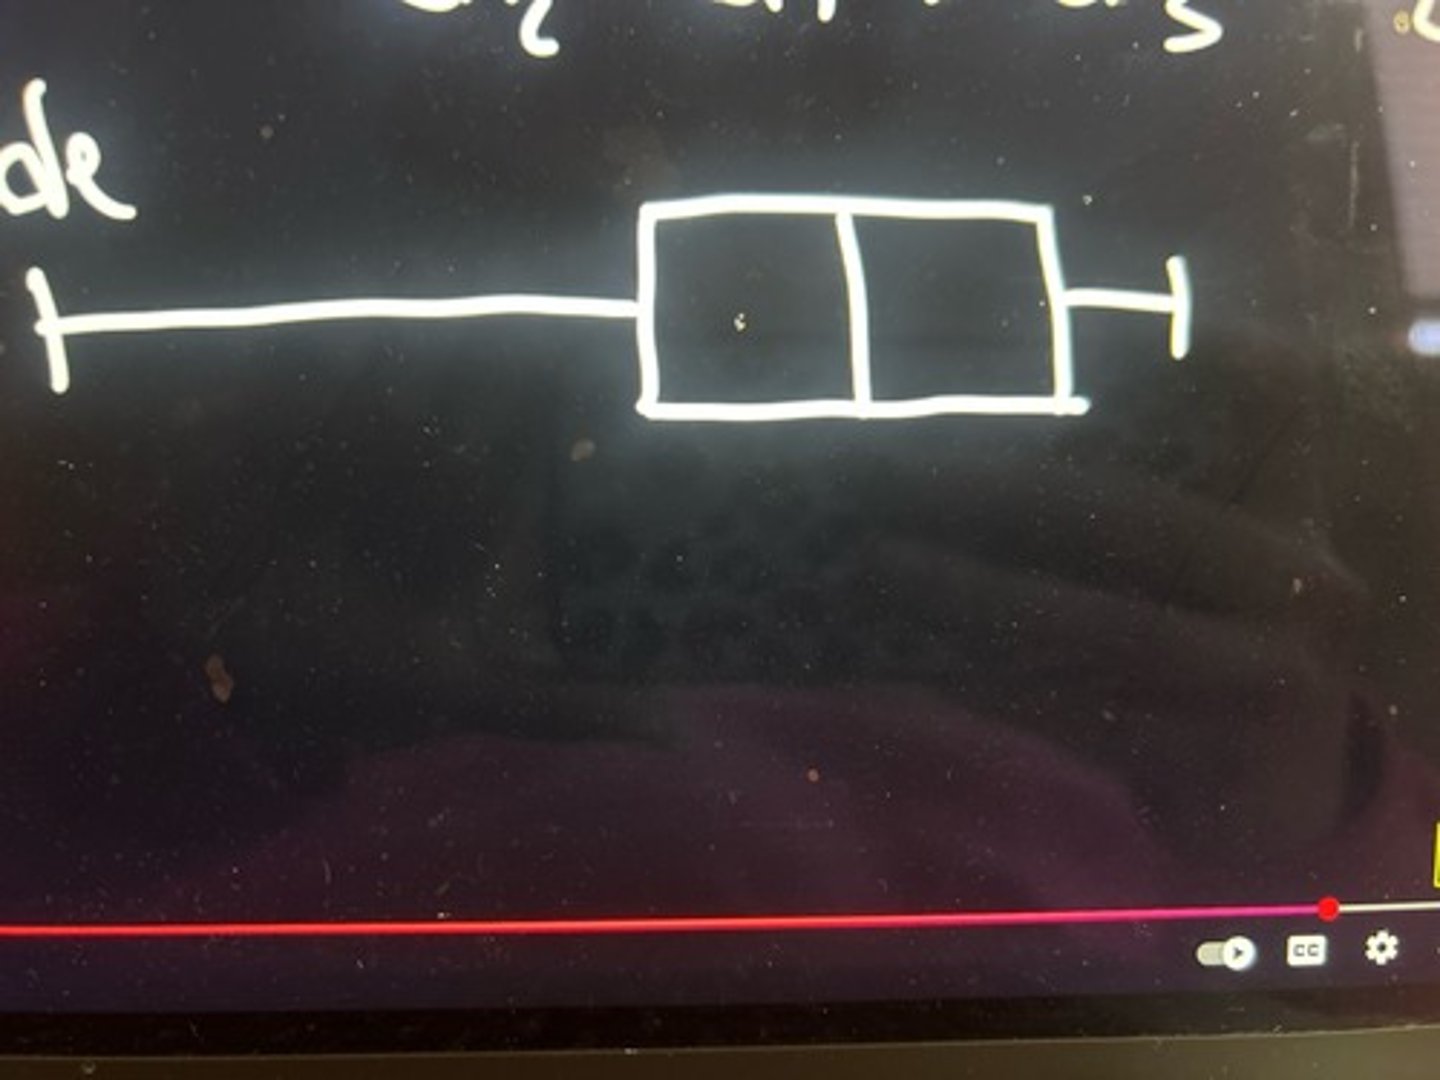
box plots
Five point summary of the data, which shows a distribution's range (min and max), interquartile range (Q1 and Q3), median, mean (also shows skew)
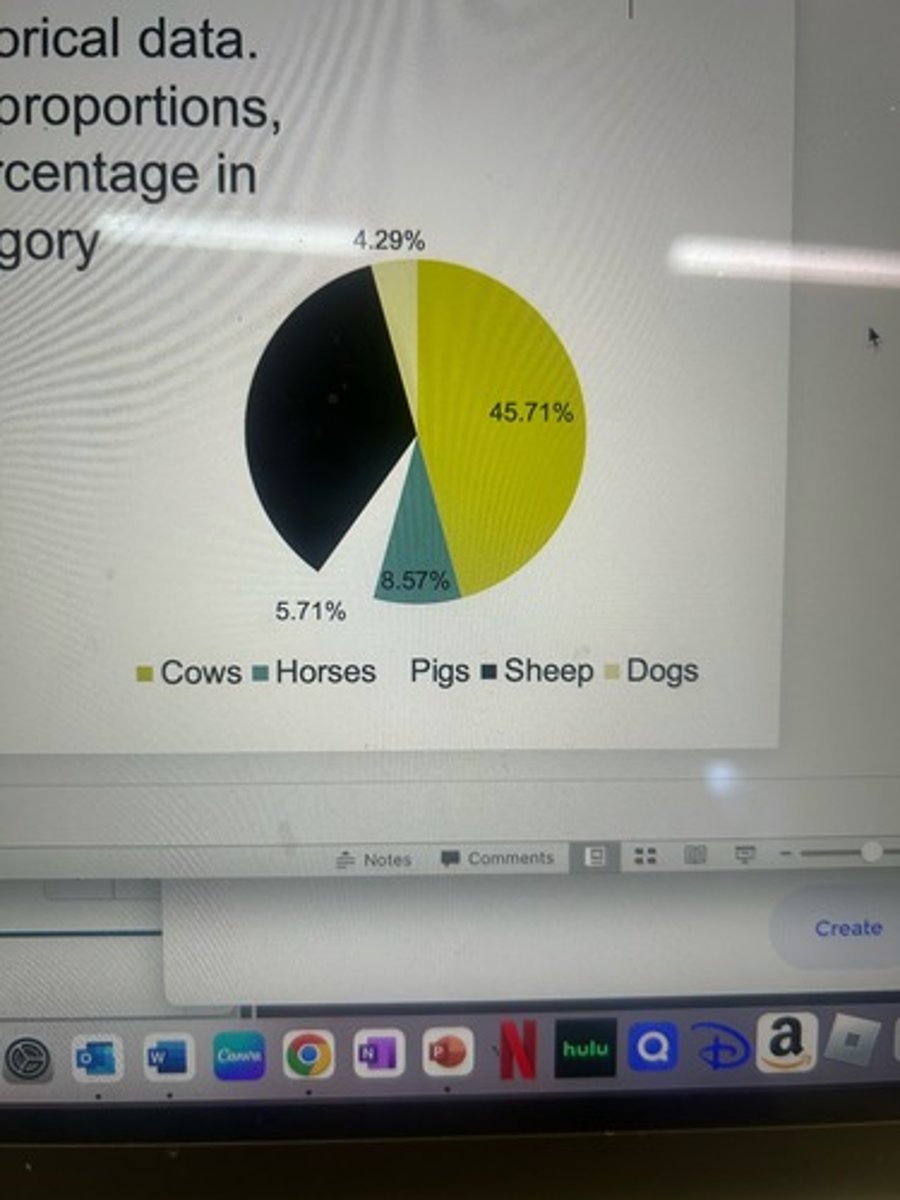
pie chart
Good with categorical data. Divides data into proportions, or shows the percentage in each category
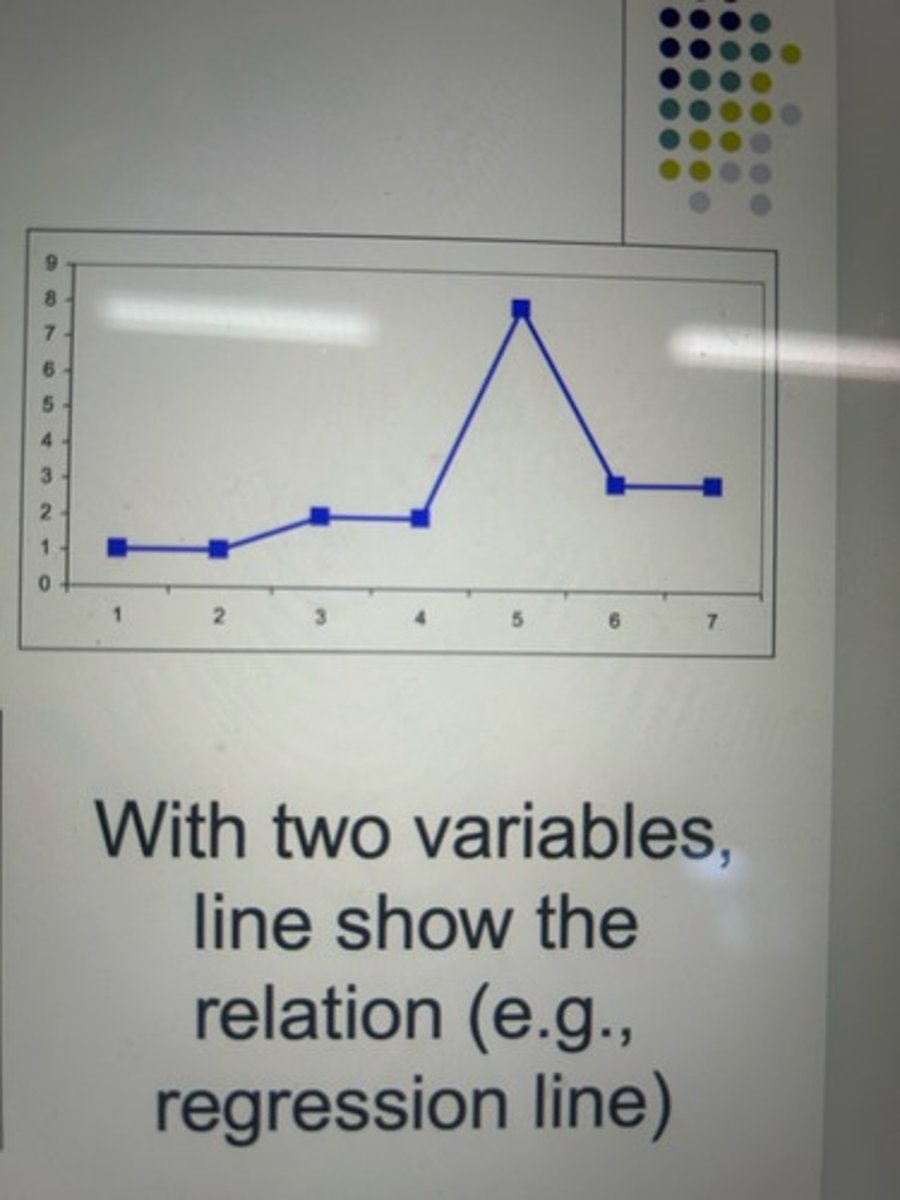
line graph
Multiple types. Basic one shows frequency of each score, connected by a line. With two variables, line show the relation (e.g., regression line)
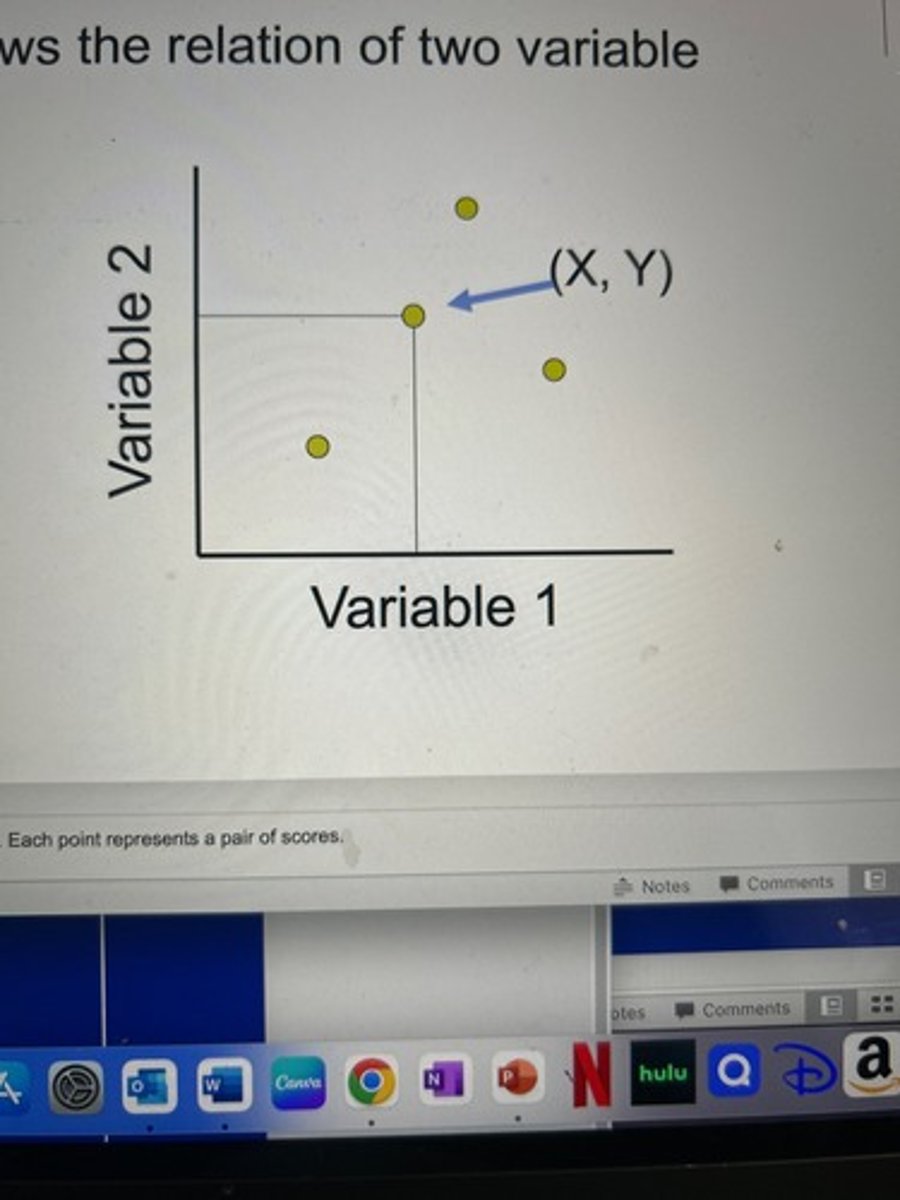
scatter plot
Shows the relation of two variable
mean
average
standard deviation
a measure of variability that describes an average distance of every score from the mean
median
the middle score in a distribution; half the scores are above it and half are below it
Mode
the most frequently occurring score(s) in a distribution
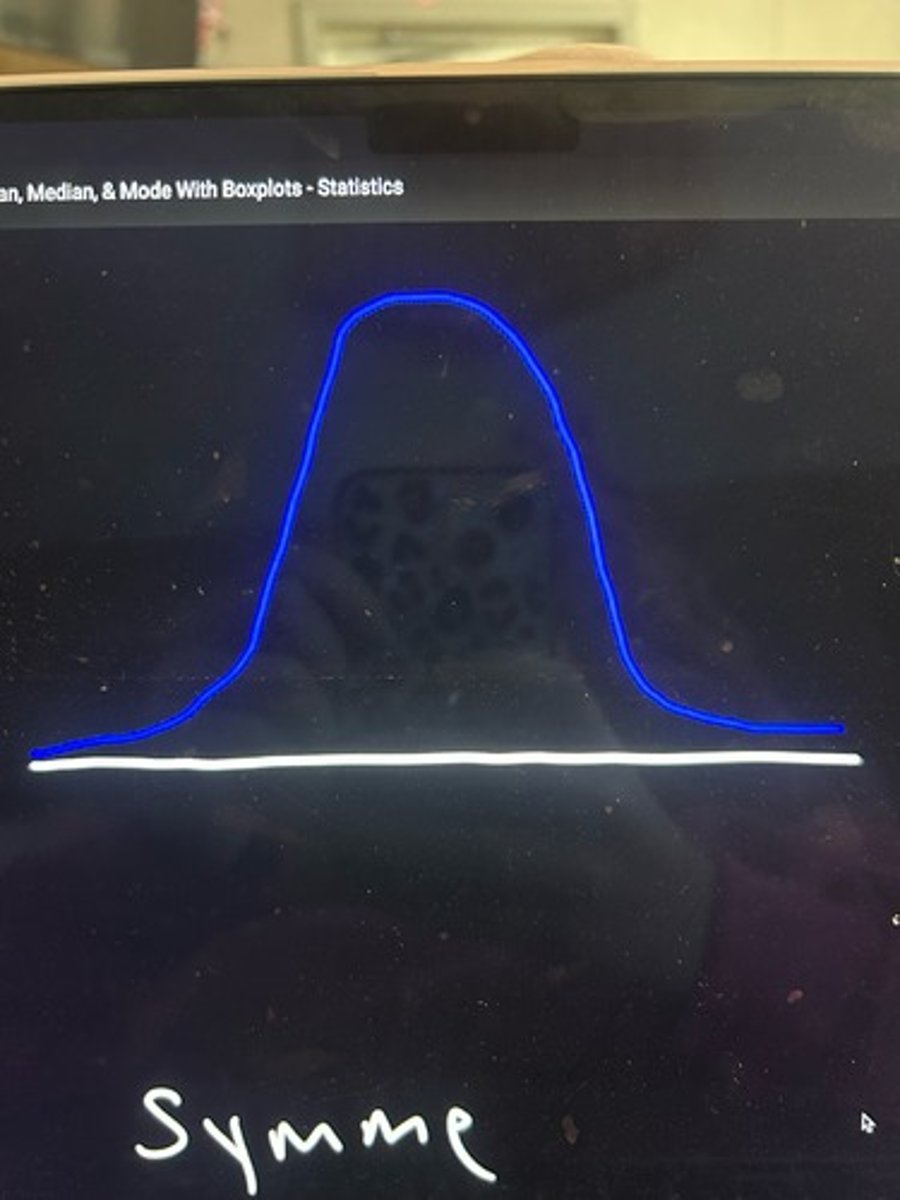
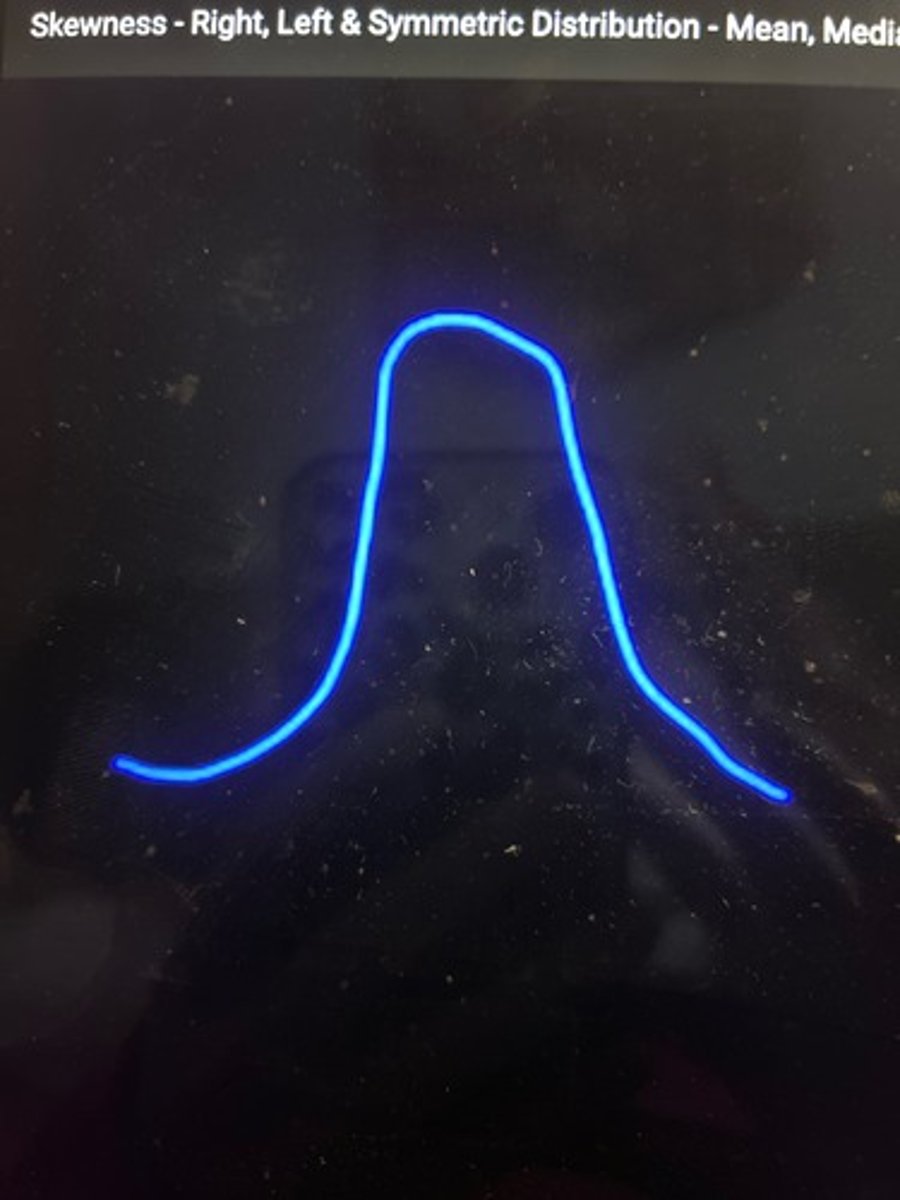
symmetric data
Is the data symmetric?
Yes
Is this data symmetric?
Unimodal
Unimodal or Bimodal graph?
Bimodal
Unimodal or bimodal graph?

skewed right (positive skew)
Skewed left or right?
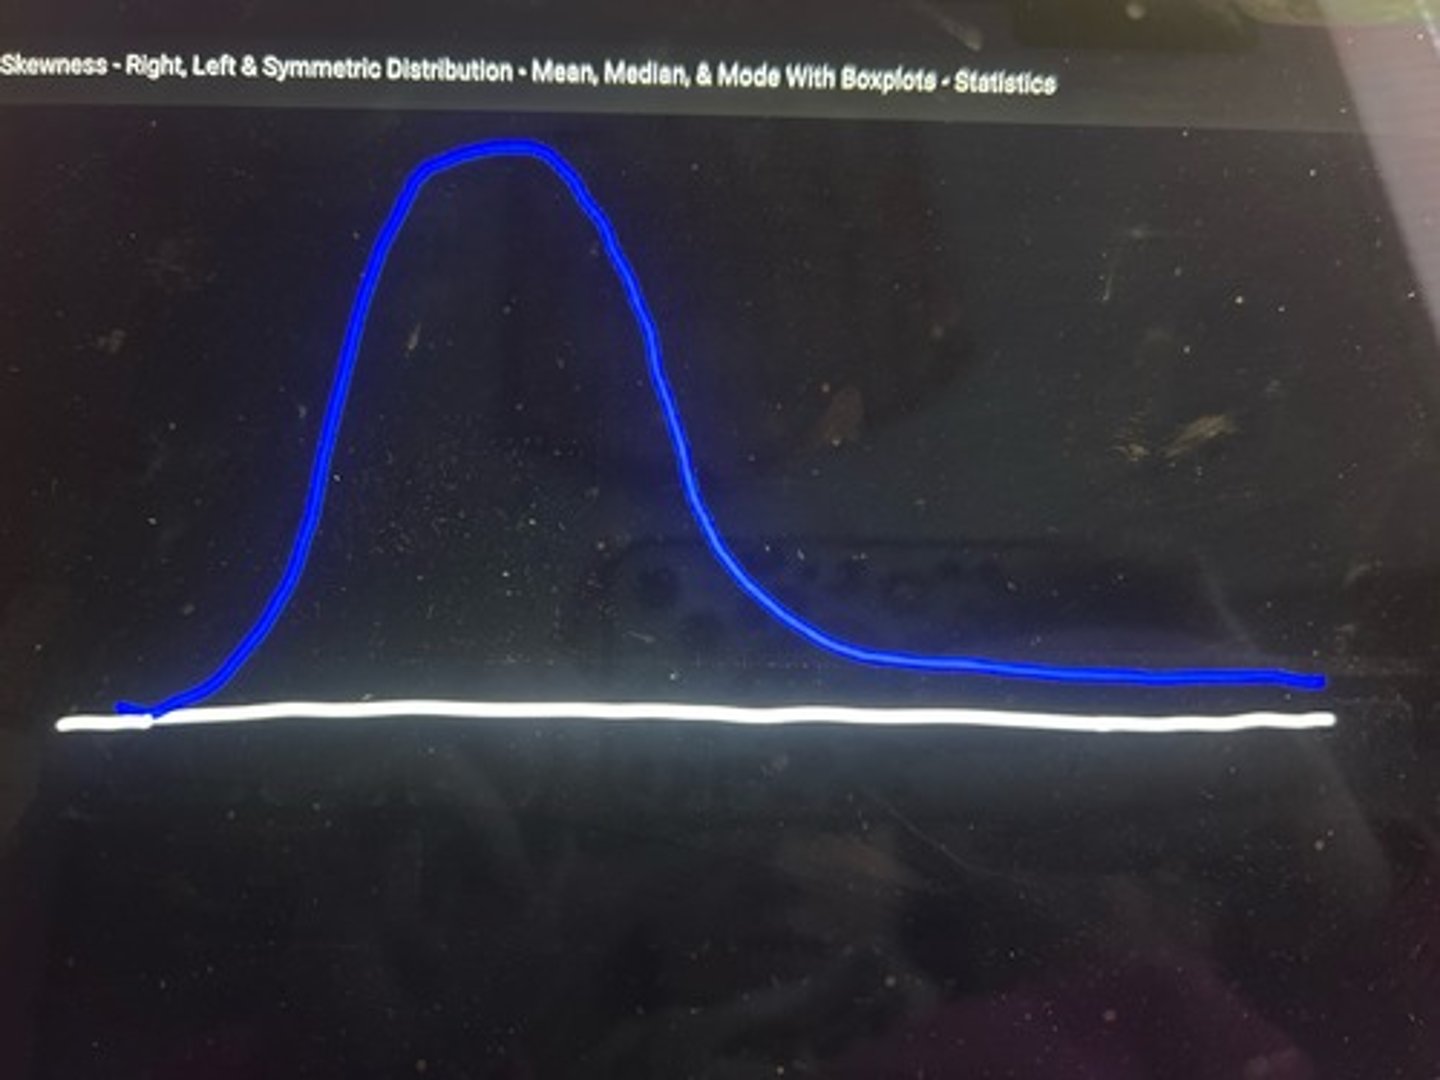
skewed right (positively skewed)
Skewed left or right?
skewed right (positively skewed)
Skewed left or right?
skewed left (negatively skewed)
Skewed left or right?
skewed left (negatively skewed)
Skewed left or right?
skewed left (negatively skewed)
Skewed right or left?
quanitative data
numerical data
qualitative data
Data associated with a more humanistic approach to geography, often collected through interviews, empirical observations, or the interpretation of texts, artwork, old maps, and other archives. (Categorical)
Statistics
Characteristics that describe a sample
Parameter
Characteristics that describe a population
Sample
A subset of the population, small portion of population. Contains individuals that are actually observed
Population
Is the entire collection of individuals about which information is sought
75%
At least ____ of the data lies within 2 standard deviations of the mean (Chebyshev's Theorem)
88.8%
At least ______ of the data lies within 3 standard deviations of the mean.(Chebyshevs Theorem)
The empirical rule
68%, 95%, 99.7%
Reliability
The thing you are measuring is an accurate inference (the numerical qualities is accurate representation of the ring you are trying to measure; repeats over and over if calculated again) example: weighing yourself on a scale
Validity
Actually measuring exactly what you intend to measure (if you are trying measure iq, you should do an iq test not a survey)