ap microeconomics
1/37
There's no tags or description
Looks like no tags are added yet.
Name | Mastery | Learn | Test | Matching | Spaced |
|---|
No study sessions yet.
38 Terms
What is imperfect competition?
A market structure where firms have some control over price and products may be differentiated.
What are the three types of imperfect competition?
Monopoly, monopolistic competition, and oligopoly.
What is a monopoly?
A market with one firm that is the sole seller of a unique product with no close substitutes
What is a price maker?
A firm that has control over the price it charges (like in a monopoly or oligopoly).
What is monopolistic competition?
A market with many firms selling similar but not identical products, with low barriers to entry.
What is non-price competition?
Competing through advertising, product quality, branding, and other factors not related to price.
What happens to economic profit in the long run in monopolistic competition?
It goes to zero because of easy entry and exit of firms.
What is an oligopoly?
A market dominated by a few large firms, often with significant barriers to entry.
What is interdependence in an oligopoly?
Firms' decisions affect one another — they have to consider competitors' reactions.
What is game theory?
The study of strategic decision-making used to predict firm behavior in oligopolies.
What is a dominant strategy?
A strategy that is best for a player no matter what the other player does.
What is the Nash Equilibrium?
A situation where no player can improve their outcome by changing strategies alone.
What is a cartel?
A group of firms that collude to act as a monopoly and control prices (often illegal).
What is excess capacity?
When a firm is producing less than the quantity that minimizes average total cost (common in monopolistic competition).
Are monopolies allocatively efficient?
No — they produce less than the socially optimal quantity, creating deadweight loss.
What does "MR < Price" mean in a monopoly?
Marginal revenue is less than price because the firm must lower the price to sell more.
What causes deadweight loss in imperfect competition?
Firms underproduce or overprice compared to the allocatively efficient point.
What does it mean to be productively efficient?
Producing at the lowest possible cost (minimum ATC).
Do firms in monopolistic competition advertise?
Yes — a lot — to differentiate their products from others.
Why do oligopolies sometimes cheat on agreements?
To increase individual profit — leads to breakdowns in collusion (like in the prisoner's dilemma).
On a monopoly graph, what curve is always above the marginal revenue (MR) curve?
The demand (D) curve.
On a monopoly graph, where is the profit-maximizing quantity?
Where MR = MC.
On a monopoly graph, how do you find the price the firm will charge?
Go up from MR = MC to the demand curve, then over to the price axis.
On a monopolistic competition graph in the long run, where is price set?
At the point where demand is tangent to ATC (no profit).
On a monopolistic competition graph, what happens to the firm’s demand curve in the long run?
It shifts left until the firm makes zero economic profit.
On an oligopoly graph, what shape is the kinked demand curve?
it has a sharp bend — flat on top, steep underneath — showing price rigidity.
In monopolistic competition, what does the vertical gap between ATC and demand at Q* represent (if ATC is below D)?
Economic profit in the short run.
What does it mean if MR is below MC?
The firm is producing too much — it should decrease output.
In a monopoly graph, where is the area of economic profit?
Between the price (on demand curve) and the ATC, from 0 to Q.
What does the shaded triangle between demand and MC beyond Q* represent?
Deadweight loss — inefficient production level.
In a monopolistic competition graph, what does excess capacity look like?
Quantity produced is less than the productively efficient quantity (where ATC is at its minimum).
On any graph, what does MR = MC tell us?
The profit-maximizing output.
Why does the MR curve for a monopoly slope down faster than the demand curve?
Because the firm must lower price on all units to sell more, not just the extra one.
Where is the allocatively efficient point on a monopoly graph?
Where D = MC — not where the monopoly actually produces.
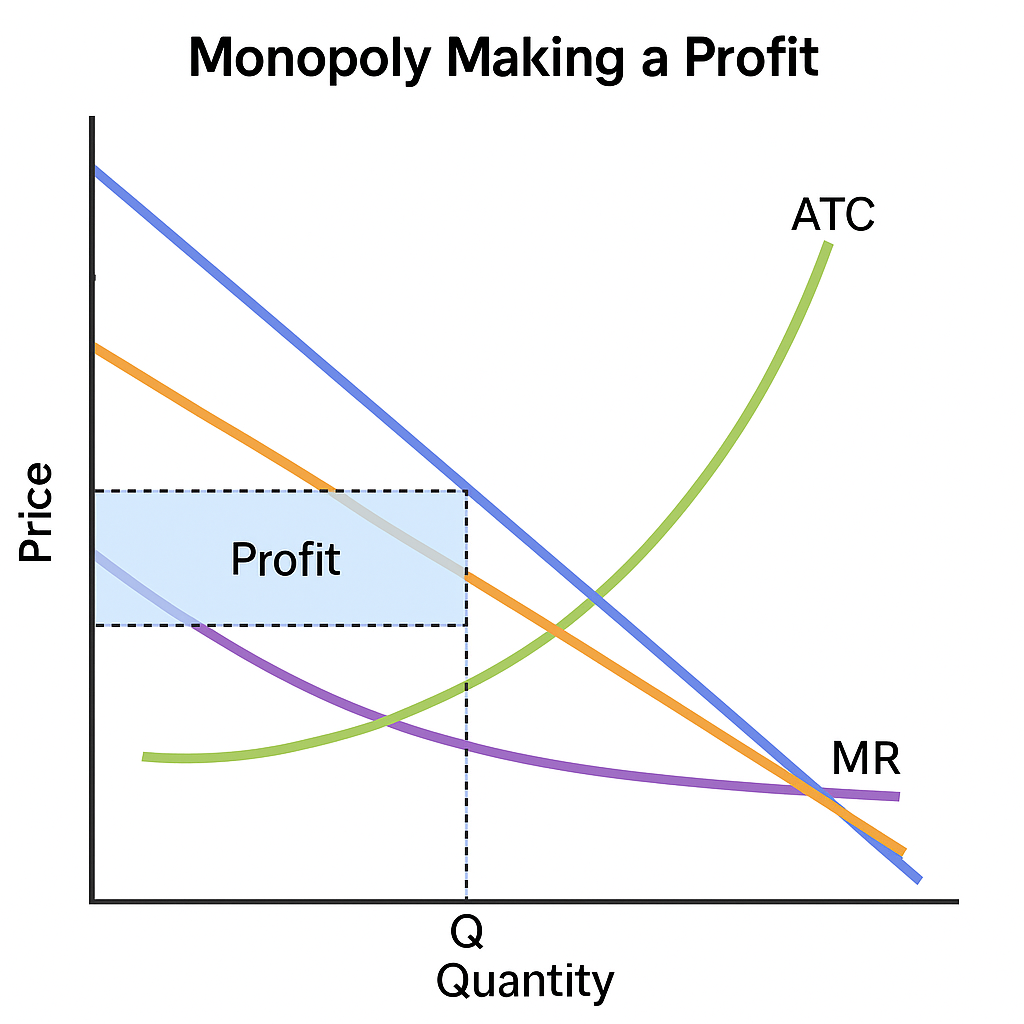
Draw and label a monopoly making a profit
his shows a monopoly earning profit because total revenue (Price × Quantity) is bigger than total cost (ATC × Quantity).
→ the rectangle between the price and ATC (multiplied by quantity) is economic profit.
💡 key visual clue: demand curve is higher than ATC at the quantity the firm chooses to produce.
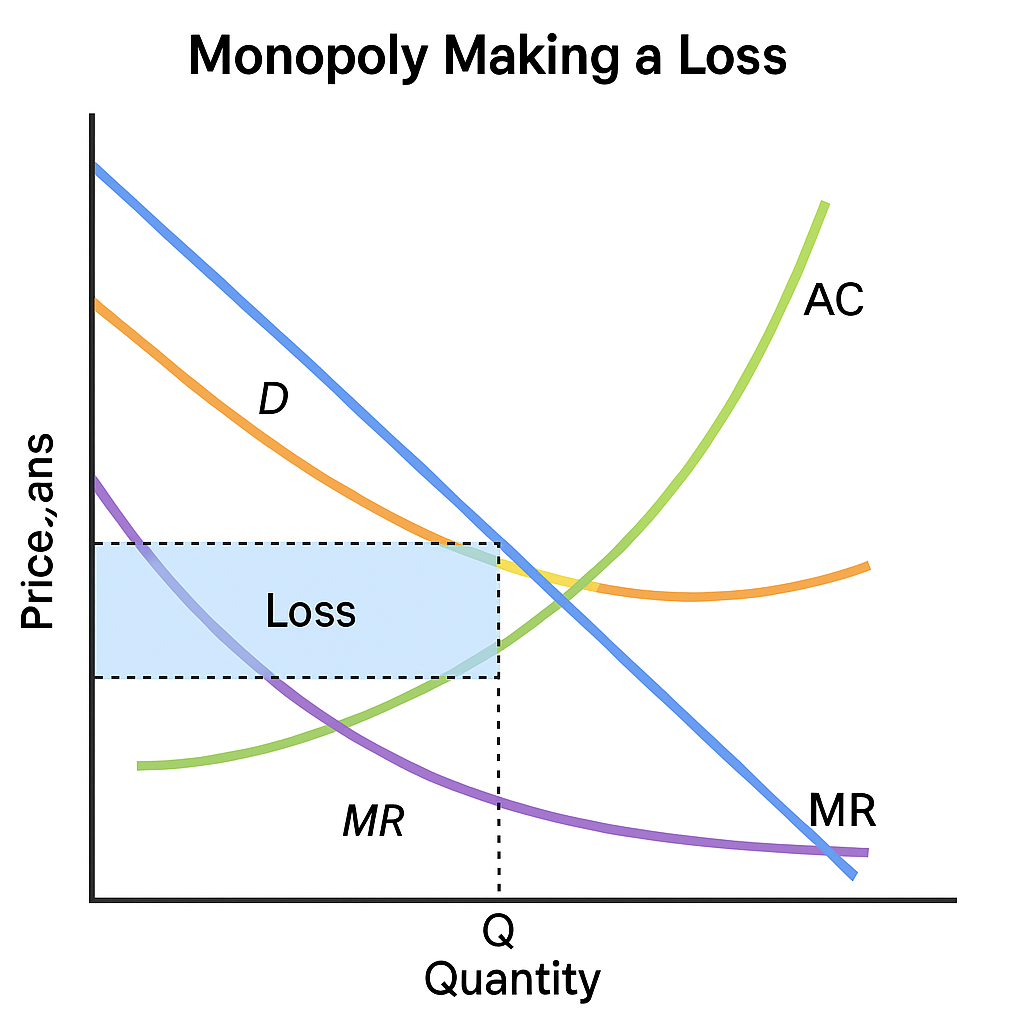
Draw and Label Monopoly making a loss
this firm is selling its product for less than it costs to make each one, meaning they’re taking an L.
→ the vertical gap between price and ATC (times Q) shows economic loss.
💡 key visual clue: ATC above D at the Q the firm chooses — pain. 🙃
draw demand marginal revenue and total revenue for an imperfectly competitive firm
imperfect competition, when a firm wants to sell more, it has to lower price for all units → this causes MR to fall faster than demand.
→ the TR curve rises when MR is positive, peaks when MR = 0, and falls when MR goes negative.
💡 key visual clues:
MR always below D in imperfect competition
TR curve peaks where MR = 0
helps connect the idea that TR is maxed out when MR = 0, which is a major 🔑
why is demand > marginal revenue for all imperfectly competitive firms?
when a firm in imperfect competition (like a monopoly, monopolistic competition, or oligopoly) wants to sell more units, it can't just sell those extra units at the same price.
it has to lower the price — not just for the extra unit, but for all units sold