Stratford Fieldwork - Investigating Dynamic Urban areas
1/48
There's no tags or description
Looks like no tags are added yet.
Name | Mastery | Learn | Test | Matching | Spaced |
|---|
No study sessions yet.
49 Terms
What is our enquiry question?
Investigate how and why quality of life varies within urban areas
What is our hypothesis?
The quality of life will vary between Carpenter’s Estate & East Village.
Define ‘quality of life’:
The level of social, psychological, environmental & economic wellbeing being experienced by individuals & communities.
What are the logistics of getting to Stratford?
Takes 1hr 5mins on public transport from our school.
How accessible is Stratford?
Accessible via public transport
In England - no language barrier
We have pre-existing knowledge of the site
What is the relevance of Stratford?
There is evidence for variations in quality of life
East Village, developed for the 2012 Olympics features modern housing, green spaces & various amenities, attracting higher income residents - providing higher quality of life.
Carpenters Estate, an older social housing area has aging infrastructure, fewer amenities and therefore lower average income levels
So why were our 2 locations suitable to study?
East Village & Carpenter’s Estate have large contrasts in rates of deprivation. EV - been regenerated & invested in, CE is an old council housing estate
We expected to see differences in QoL due to regeneration in EV - would help us answer our enquiry question
Two sites were in walking distance of each other - suitable due to our time constraints, we only had 1 day to collect data
How does housing quality show how quality of life varies in urban areas (in Stratford)?
East village has high quality, eco-friendly housing, modern apartments with efficient insulation, energy systems and has green spaces - contributes to comfort, health & happiness.
Carpenters estate is older, buildings need repair & renovations, residents experience lower living standard due to maintenance issues - affect health & comfort negatively due to dampness & poor insulation
How does environmental quality show how quality of life varies in urban areas (in Stratford)?
East Village designed for sustainability, has abundant green spaces, landscaped park, playground, low-emission zones - creates pleasant environment & enhances mental & physical wellbeing + promotes active lifestyle
Carpenters estate is close to green spaces (Queen Elizabeth olympic park) but has fewer green spaces in estate itself, area is close to busy roads + industrial sites so experiences higher pollution levels - impacting residents mental & physical health
How does Employment & economic opportunities show how quality of life varies in urban areas (in Stratford)?
East Village has newer infrastructure & is closer to Stratford International station & Westfield, also attracts more young, affluent residents who work in higher-paying jobs in nearby business districts - economic stability raised QoL
In Carpenter’s Estate residents may face higher unemployment rates or work in lower-paying jobs due to socio-economic factors like aging infrastructure & limited investment in repairs - is less appealing for potential businesses - affecting the area. Economic hardship reduces QoL - harder to afford basic needs & services
How does social & community cohesion show how quality of life varies in urban areas (in Stratford)?
East village is a newer development w many rented apartments, leads to transient population w fewer long terms residents - can impact community cohesion & deep-rooted community is harder to build despite social events and facilities
Carpenters estate has many long-term residents, so has a strong sense of community with caring neighbors. But issues like poverty & redevelopment pressures may impact their sense of security & belonging - affecting QoL
What type of secondary data did we collect?
Crime statistics
Index of Multiple Deprivation
2021 Census data
What percentage of the populations of East Village & Carpenters Est. have a second address outside the UK? How does this support our hypothesis?
East Village - 5.4%, Carpenters Estate - 1.4%
5.4% figure in East Village suggests that a larger proportion of its residents can afford such an expense, indicating a generally higher level of wealth & economic stability - associated with a higher QoL. Also suggests they have job security/ remote work options common in higher-paying roles
Lower % in Carpenter’s Estate (1.4%) suggests fewer residents have financial means for 2nd address, lower economic capacity aligns with lower disposable income levels - leads to a reduced QoL due to financial constraints on leisure, education etc. Suggests they have less flexible jobs or responsibilities that don’t allow for travel - lower QoL.
What percentage of households in East Village & Carpenters Est. are deemed ‘not deprived in any dimension’? How does this support our hypothesis?
East village - 67.3%, Carpenters Estate - 56.1%
In East village the majority of households meet this criteria, implying they are comfortable, safe and have adequate space & functionality - contributes to a higher QoL. Most households being free from deprivation suggests higher access to stable employment & steady income
In Carpenter’s estate almost half of households are deprived to some degree, suggesting many households struggle with overcrowding, poor insulation & outdated infrastructure, leads to unhappy and unhealthy residents that may struggle with employment and job security - lower QoL.
Secondary data showed crime is higher in East Village, why might this be the case?
Although EV has a strong police force & is patrolled more & is better maintained, crime is still higher due to higher value of goods. EV has a high rate of theft-related crimes due to higher value of goods that are available there. Also a lot of nightlife & shopping attracting lots of people and therefore
There might be less crime in CE due to lack of commercial activity & nightlife as well as lower population density.
What are the techniques we used for data collection in Stratford?
Epitome words
Environmental Quality Survey (EQS)
Field Sketch
Questionnaire
Index of decay
What are epitome words? Quantitative or Qualitative?
A simple way to gauge how people perceive a place by choosing a single word/words that summarise an area. Qualitative.
Describe the method for epitome words:
View sample area
Note down 4 words that summarise the site you are studying
What kind of sampling was used for the epitome words?
Systematic.
Strengths of epitome word data collection:
I selected my words quickly & judiciously to capture my immediate feelings.
I visited the sites on the same day, keeping environmental variables consistent & ensuring the epitome words reflect the sites themselves rather than situational factors - increases accuracy
Weaknesses of epitome word data collection:
We couldn’t see every inch of both areas & every site so we couldn’t give an entirely comprehensive word
Very subjective and relies on personal perceptions, different people may interpret the same site in different ways (e.g. one may say busy, another may say chaotic) - lead to inconsistencies in choice of words
Oversimplifies complex area, a site could have a mix of qualities
We asked others in our groups for ideas - makes it not a first impression or exact to your perception of the area
What is an Environmental Quality Survey (EQS)? Quantitative or Qualitative?
A survey that uses an observer’s judgement to assess environmental quality using a range of indicators. Quantitative.
Describe the method for EQS:
Observe area you’re studying
Decide where the quality you’re observing falls on the scale (+2 High, -2 = Low)
Repeat for all the qualities you’re observing
What kind of sampling was used for the EQS?
Systematic & pragmatic.
Strengths of EQS data collection:
Used systematic sampling preventing accidental overrepresentation of certain areas, ensure all parts of East V & Carpenters est. are equally considered.
The objective criteria for each aspect of environmental quality limits personal biases - each site is evaluated according to the same standards, leading to more accurate results.
We conducted the survey on the same day, around the same time - leading to more reliable comparisons
Data is quantitative, giving a numerical result that can be used as an objective, clear & precise statistic
Weaknesses of EQS data collection:
Subjectivity and bias when scoring, we may have looked for bad/good aspects specifically just so it proved our hypothesis, different people may interpret areas differently - reduce reliability and accuracy
Sites are large so it was practically impossible to take into account the quality of every house/infrastructure etc
What is a field sketch? Quantitative or Qualitative?
A simple drawing of a place, typically outdoors, that record observations made during fieldwork. Qualitative.
Describe the method for field sketch:
Record longitude & latitude of location where data was taken
Draw the horizon & any major features in the background
Add in additional detail & annotate key features that relate to your enquiry question
Add a title
What kind of sampling was used for the Field sketch?
Systematic & pragmatic.
Strengths of Field sketch data collection:
I annotated key details to help capture important physical differences that would answer the enquiry question & prove my hypothesis - like parks, state of buildings, whether there was large amounts of litter due to no bins available etc - offers a clear & visual representation of the area
I spent a few minutes observing the site before starting the sketch to help ensure key elements aren’t missed and also reducing bias as i didn’t immediately start sketching whatever drew my eye
Weaknesses of Field sketch data collection:
Sketch is easily biased, I found myself being selective with certain details, also meant I couldn’t include every building - reduces comprehensiveness & reliability
We only did 1 sketch for East Village and Carpenter’s estate, only captured one perspective of the overall site, may have missed important details. Also only 1 sketch means there is no opportunity for replication or cross-checking so inaccuracies would go unchallenged - leading to less reliable data
Qualitative - don’t provide exact measurements, distances, amounts or sizes of objects so it can be hard to assess the scale or layout and therefore the sketches are open to interpretation - difficult to make substantial comparisons between EV & CE
What is a Questionnaire? Quantitative or Qualitative?
A list of questions used to collect information from respondents in fieldwork. Qualitative or Quantitative.
Describe the method for Questionnaires:
Select individuals to survey
Ask individuals pre-planned questions
Note down responses
What kind of sampling was used for the Questionnaire?
Random sampling.
Strengths of Questionnaire data collection:
We asked a variety of approachable looking people to fill out questions on a Microsoft form, giving us data from people who know the area better than us & a broad view of the area socially
Standardized responses: Every participant has the same questions in the same order, ensuring consistency in data collected & making sure responses are related to our enquiry question, also reduced bias - we didn’t ask different questions due to our personal biases. Allowed for more reliable data.
We used close-ended questions (agree/disagree) as it makes data specific and focused - also makes it easier for respondents to answer quickly & clearly, and therefore have more truthful, accurate responses + reduces bias.
Weaknesses of Questionnaire data collection:
Not all people were residents (2/5 were) - non-locals may not have accurate or comprehensive views about long-term issues and their views are based on temporary experiences, this leads to less reliable & valid responses
We had a small sample size which can lead to statistical errors and may not fully capture the feelings of the broader population - reliability is compromised and makes it harder to detect patterns or trends in data
We were unable to conduct questionnaire at CE due to safety concerns and lack of people - meant we have no comparative data so we are unable to understand how both areas differ in that aspect
What is an Index of decay? Quantitative or Qualitative?
A survey that uses an observer’s judgements to assess deprivation against a range of indicators. Quantitative.
Describe the method for Index of decay:
Observe the area you’re studying
Decide where the quality you’re observing falls on the scale (-3 = negative, +3 = positive)
Repeat for all qualities you’re observing
What kind of sampling was used for the Index of decay?
Systematic & pragmatic.
Strengths of Index of Decay data collection:
It was easy to conduct due to its clear criteria that helps eliminate ambiguity in data collection, as there is less room for misinterpretation, data is reliable & consistent
Standardized scoring system (-3-3), so allows for specific, clear and precise data that answers our enquiry question. All surveyors score the same features, ensuring personal opinions or preferences don’t influence the results or drift from the enquiry question
Quantitative aspect, numerical values are used to assess each site - giving precise, measurable data that can be easily analyzed and compared. Numbers are less open to personal interpretation than descriptive words - increasing overall accuracy of my conclusions
We conducted the survey on the same day, around the same time - more reliable comparisons
Weaknesses of Index of Decay data collection:
Subjectivity and bias when scoring, we may have looked for bad/good aspects specifically just so it proved our hypothesis, different people may interpret areas differently - reduce reliability and accuracy
Sites are large so it was practically impossible to take into account the quality of everything being assessed
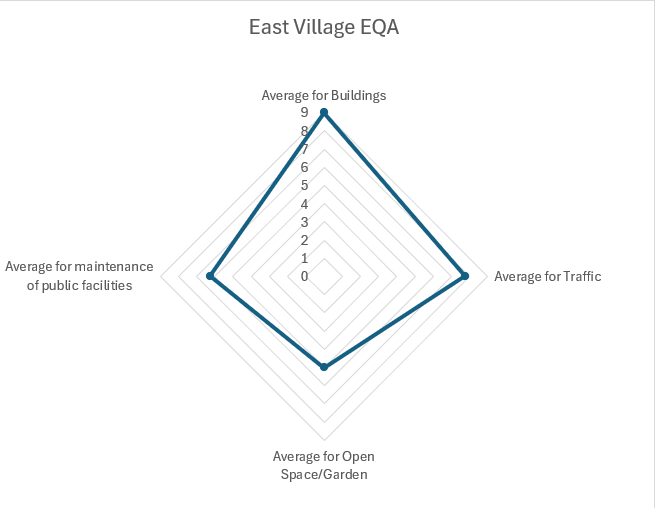
Justify the use of radar graph for EQS:
It can display data on several different variables, making it a good way to compare the characteristics of an area.
Justify the use of Bipolar bar graphs for Index of Decay:
They clearly display positive and negative variations of decay, making it easy to see which areas are well-preserved and which are deteriorating - allowing for quick comparisons.
Justify the use of bar charts for questionnaire:
They make it easy to compare responses across different categories or questions at a quick glance. As we had agree/disagree categorical data, using a bar chart made the data simple to read and interpret.
Give 2 examples of ways we attempted to reduce inaccuracies in our data collection:
We used 4 sites within each location allowing us to collate more data and see more of each location. Allowing our opinions, and data set to be more representative of the two contrasting areas of Stratford - also enabled us to identify anomalies within our data
We used QR codes for questionnaire & epitome words and tested them beforehand to ensure it worked and that our data collection would therefore be efficient. By having QR codes (& therefore preset questions) for questionnaire, we avoided biased and subjective questions and issues like having to decipher our handwriting - could’ve lead to inaccuracies
Give 2 examples of ways there may have been inaccuracies in our data collection:
We randomly selected people for our questionnaire, rather than purposefully selecting people from inside businesses, near homes or at regular intervals. This meant not all people we interviewed were residents or even were appropriately familiar with the area, this meant that they couldn’t give comprehensive answers to long term issues & their views were based on temporary experiences - less accurate & valid data responses
Data was collected across the whole year, so different students may have different perceptions of the area - for the epitome words for example, giving inaccurate data - there is also a higher chance of error when entering the data if there are more students
Give 2 examples of ways we attempted to make our data reliable through data collection:
The weather on the single day we performed the data collection was very pleasant & so people were more willing to spend the time responding to questionnaires. This allowed us to have well-thought out responses that weren’t rushed & therefore representative of the two contrasting areas of Stratford and typical for how people would respond when in good moods, rather than if it were a bad day and they rushed their responses.
We had 4 sites chosen systematically, providing effective coverage of the areas and therefore giving us a large sample size as well as reducing the chance of bias towards any one site in the areas. This improves the reliability of the results by minimizing the influence of outliers or anomalies that might appear if only a few locations were sampled.
Give 2 examples of ways there may have been less reliable data due to our data collection:
We collected plenty of secondary data beforehand, giving us preconceived notions of what the areas would be like - contributing to an element of bias when collecting qualitative data (e.g epitome words) as we instinctively wanted to strengthen the patterns shown in secondary data with our primary data
We went during working hours (midday) and on a Wednesday, limiting the reliability of the data by only capturing conditions typical of that specific day & time, rather than broader trends in QoL. Midday on a weekday is usually quieter w less traffic, noise & congestion as residents are at work/school - so scores were more positive for EQS. If it had been during rush hours/ weekends, scores for traffic & noise pollution would be more negative, providing a more balanced view of challenges residents might face.