Entire Unit 1 vocab
 Call Kai
 Learn
Learn Practice Test
 Spaced Repetition
 Match
Match Flashcards
 Knowt Play
1/62

Earn XP
Name | Mastery | Learn | Test | Matching | Spaced | Call with Kai | Chat |
|---|
No analytics yet
Send a link to your students to track their progress
63 Terms
Physical geography
Study of the earth,
-think LAND, PLANTS, ANIMALS, anything on earth
Human geography
How we shape the environment
Spatial perspective
where something occurs
Ecological perspective
perspective of living things and the environment
Location
Where something is, exactly
similar to absolute location
opposite of site
things that are surrounding it
ex. close by a large hut
Absolute location
Where something is, exactly
Relative location
where something is in relation to something else
place
Where something is, descibed by the things around it
Site
Where something is, exactly
same as absolute location
Defined by physical characteristics,
ex. trees
Situation
where something is in relation to another thing
same as relative location
Space
An area within two or more things
Distributed (distribution)
The way things are arranged
Environmental determinism
The environment shapes us
Possibilism
anything is possible, regardless of the problem
we shape the environment
opposite of environmental determinism
Sustainability
Making sure things can last for the future
Built Environment
An environment created by humans
Distance decay
As things spread apart; the less they interact
opposite of toblers law
Tobler’s first law geography
The closer things are; the more they are related
Friction of distance
moving or communicating requires time, money, and effort
similar to time-space compression
Time-space compression
Idea that with using technology like cars can reduce the time it takes to get from place to place
Scale
The area that is studied
small scale maps, cant see much
large scale maps, see a lot more detail
Scale of analysis
The scale from where you view things
regional, national, local
Region
An area that has stuff that SETS IT APART from another place for a reason
Formal region
An area that shares traits
Functional region
A region that has a FUNctional area
an area that HAS a cell tower
Node
The middle/important part of a region
a cell tower of a town
Perceptual/ Vernacular region
A region that is defined on PERSPECTIVES
Globalization
The spread of ideas
trade, religious practices, and more
Theory
(ideas) that explain something
World systems theory
A theory that there is CORE, SEMI-PERIPHERY, and PERIPHEY countries
Core
The highest of countries
Periphery
The lowest of countries
Semi-periphery
Countries that are INBETWEEN core and periphery
Sustainable development
changes that help the present without having potential to interfere with the future
Quantitative
data that depends on numbers
QUANTITY
Qualitative
Data that depends of obserations, media reports, and travel
QUALITY of life
Census
population; amount of people in an area
Geographic Information Systems (GIS)
Info about the area around you
layers of data
lasagna
Topography
shapes and features of land
Remote sensing
Collecting data without any interactions, without going anywhere
Global Positioning System (GPS)
Tells you EXACTLY where you are
Cartographers
People who collect, analzye, and interept geographic info in order to design, create, and update maps
people who make maps
Absolute distance
describing a distance using DIRECT measurments such as miles or kilometers
Relative distance
Distance measured in terms of money or time
Ex. -When you are describing an distance and you say “it is 30 mins away”
Absolute direction
given directions that ARE EXACT
North, East, South, West
Relative directions
Given directions that are NOT exact
left,right, up, down
Map scale
when you are describing a map with two types of dimensions
ex small scale maps VS large scale maps
Reference maps
maps that focus on LOCATION

Thematic maps
Maps that have a certain THEME
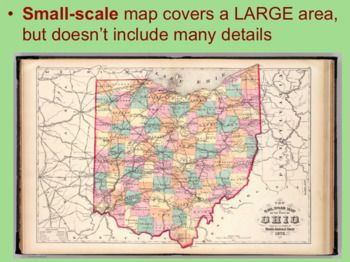
Small scale
A map/scale that interprets LESS detail
-covers a LARGER area but has less detail
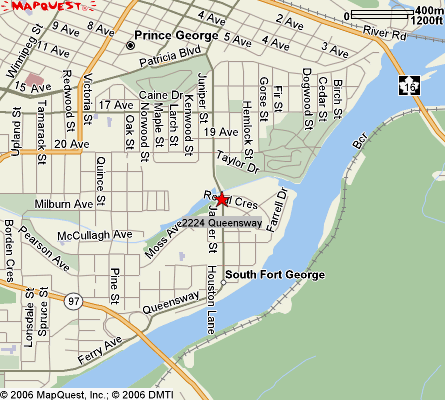
Large scale
A map/scale that interprets MORE detail
-covers a smaller area but has more detail
Mercator Projection
good for NAVIGATION
distorts size
rectangular edges


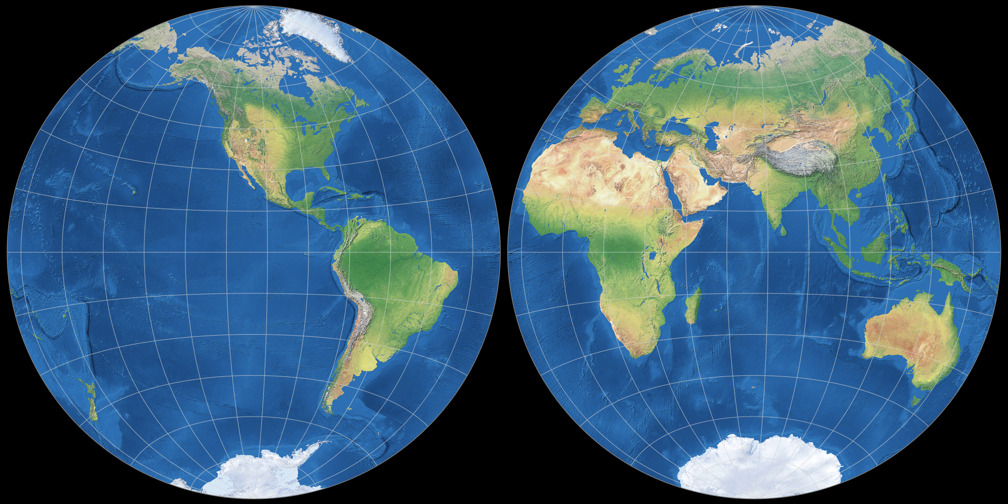
Azimuthal Projection
Can commonly be seen as just the top of the area or cut in half
can only see half of the earth at a time
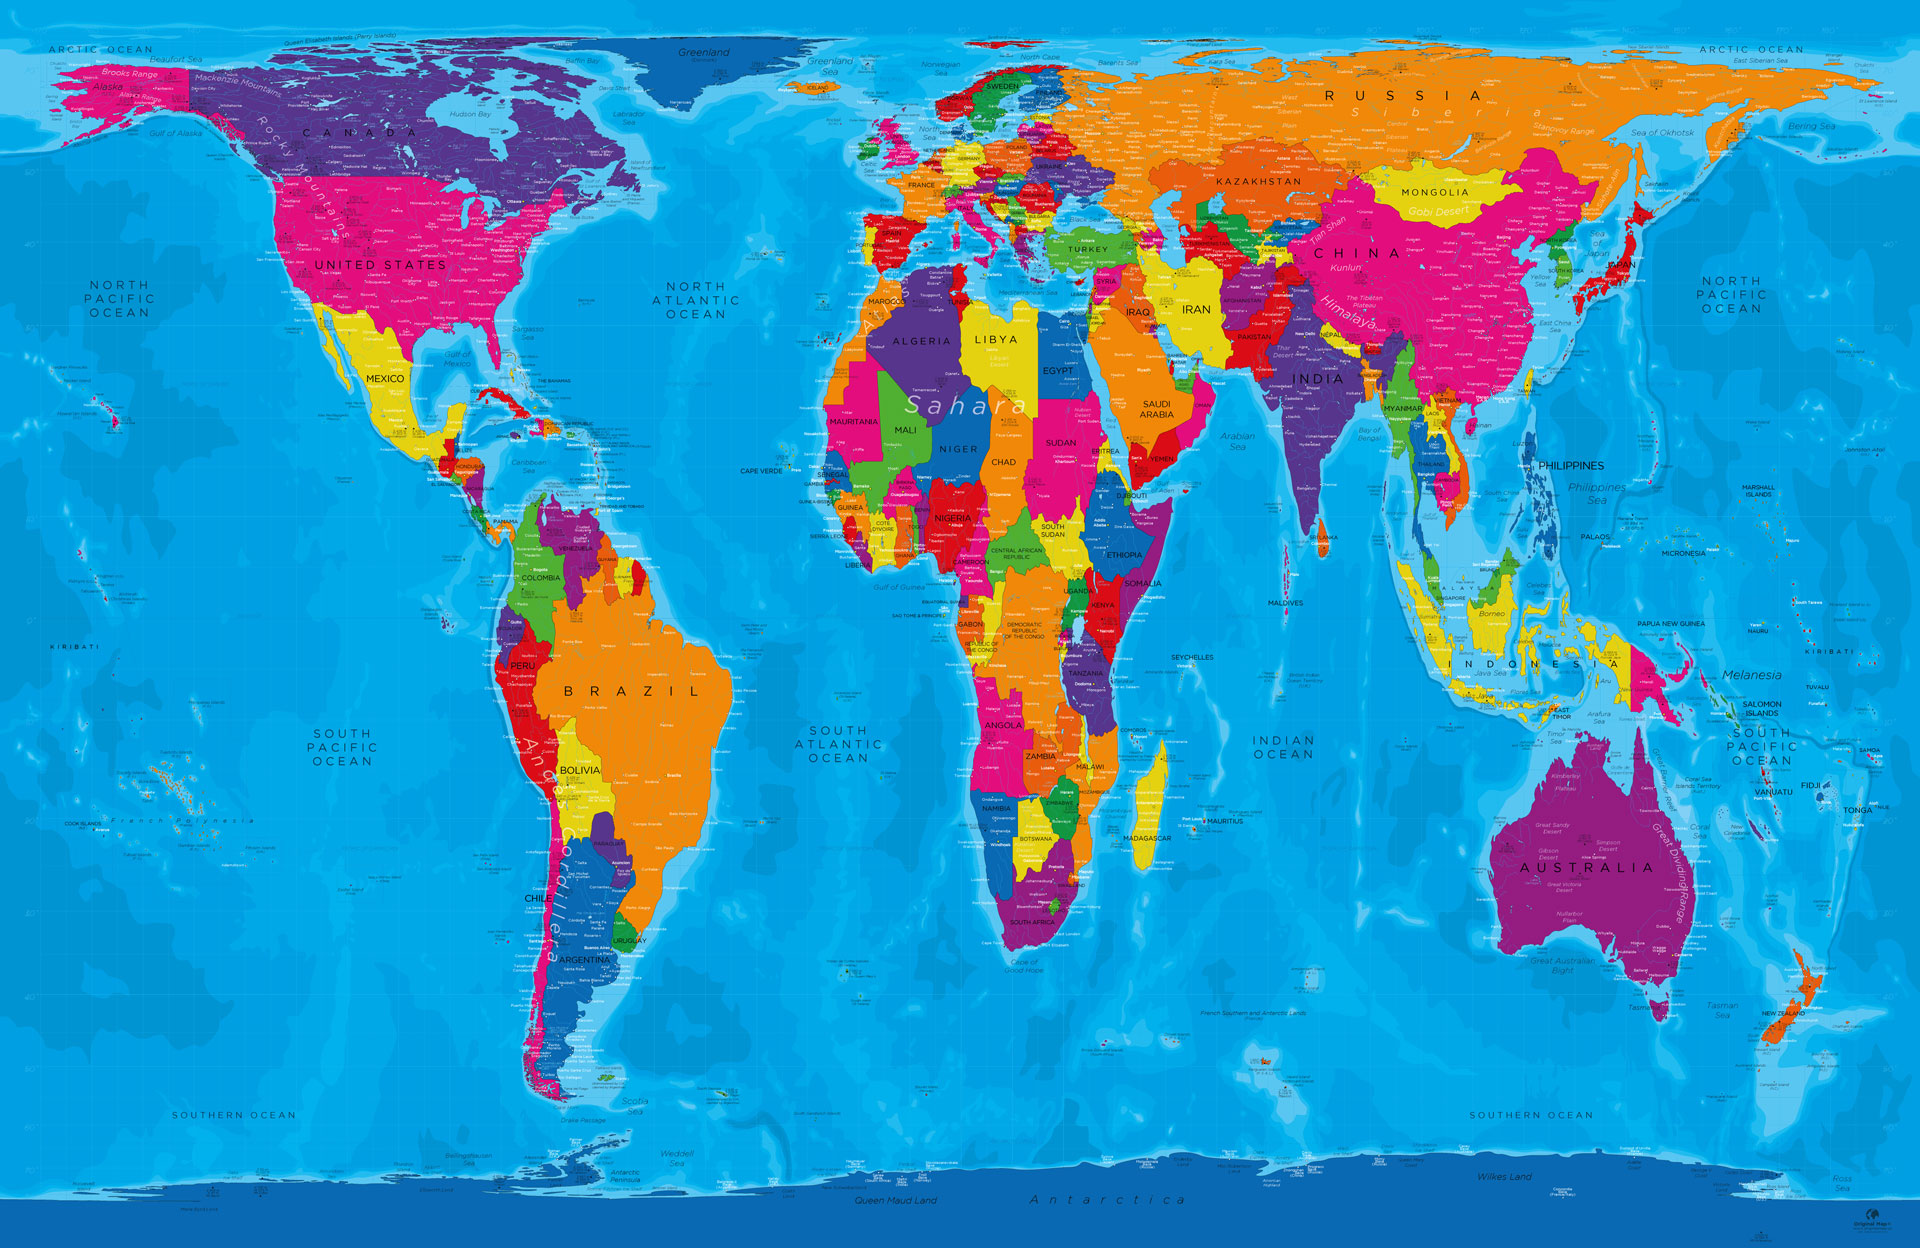
Gall- Peters Projection
Used for size but SHAPE is distorted
See how Africa is more elongated
Robinson Projection
Attempts to balance distortion across all four given areas by rounding lines of longitude
-has ROUNDED EDGES!!!!!!!

Choropleth Map
Uses COLOR to interpret data
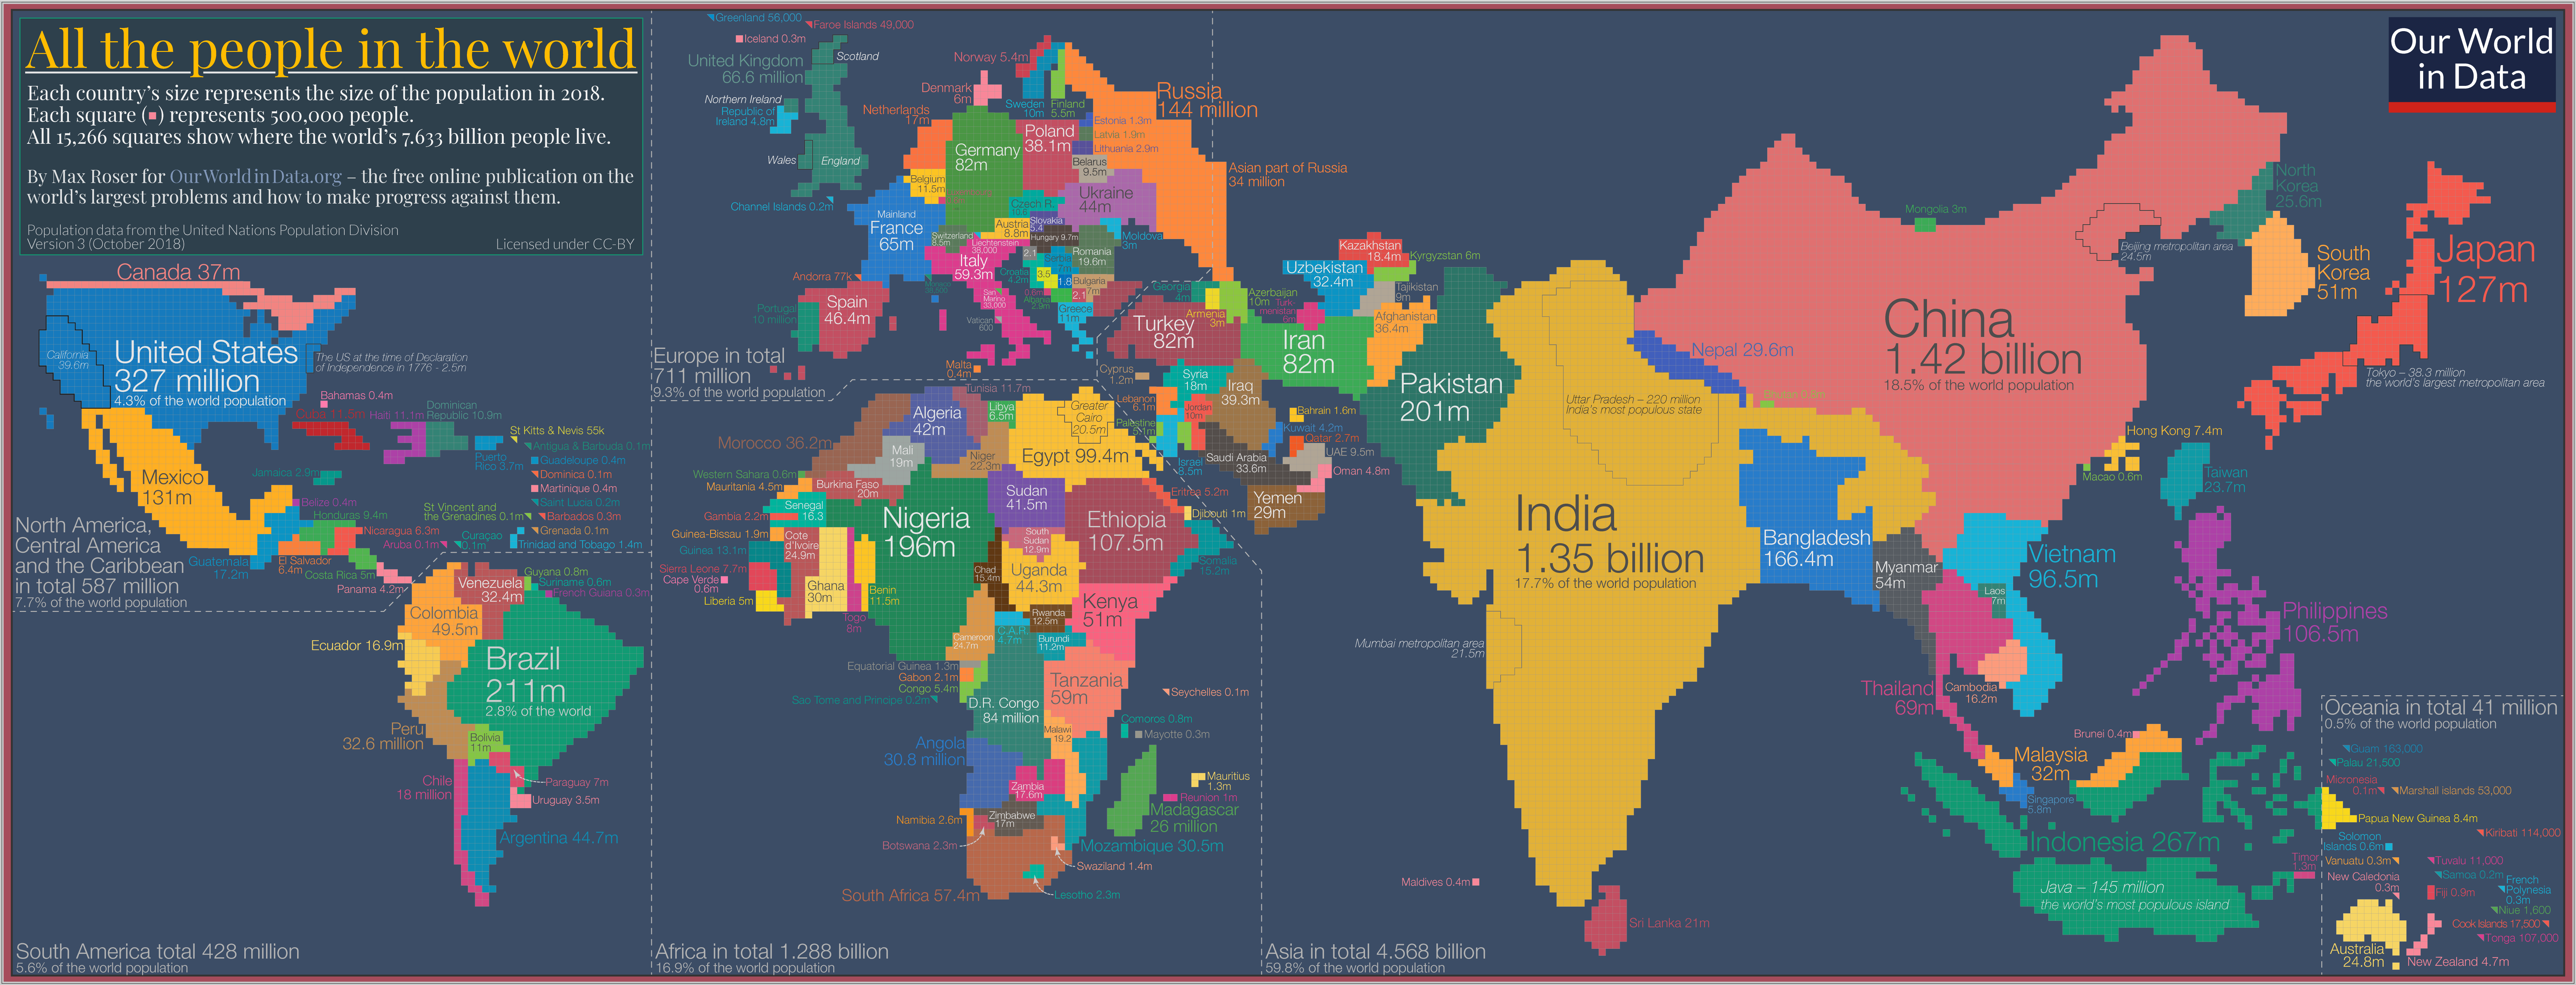
Cartogram
A map that changes the size of the given area to interpret data
Isoline Map
A map that uses LINES to connect line points of data
Dot Map
A map that uses DOTS to interept data.
Proportional/ graduated symbol map
A map that uses symbols such as shapes or another symbol else to interept data, changing the SIZE of the symbols depending on the AMOUNT of data.
Density
The frequency with which something occurs in a given area
EX. Chicago is a densely packed area
Concentration
How data is arranged
Pattern
A repeated design or arrangement observed in a dataset, often used to identify trends or relationships within spatial data.