Math 3020 lesson 3
 Call Kai
 Learn
Learn Practice Test
 Spaced Repetition
 Match
Match Flashcards
 Knowt Play
1/20

There's no tags or description
Looks like no tags are added yet.
Name | Mastery | Learn | Test | Matching | Spaced | Call with Kai | Chat |
|---|
No analytics yet
Send a link to your students to track their progress
21 Terms
descriptive statistics
numerical and graphical methods
Exploratory Data Analysis or descriptive statistics consists of
Organizing and Summarizing Raw Data
Discovering Features/Patterns and Deviations from those Features/Patterns
Interpreting findings IN CONTEXT
Exploratory Data Analysis or descriptive statistics are useful for
Describing Distributions
Investigating Relationships
Checking Data for Errors
Checking Assumptions for more complex analyses
Distribution of a variable
What values does the variable take?
How often does the variable take those values?
Measures of center
mean and median
measures of variance
standard deviation, variance, range, and IQR
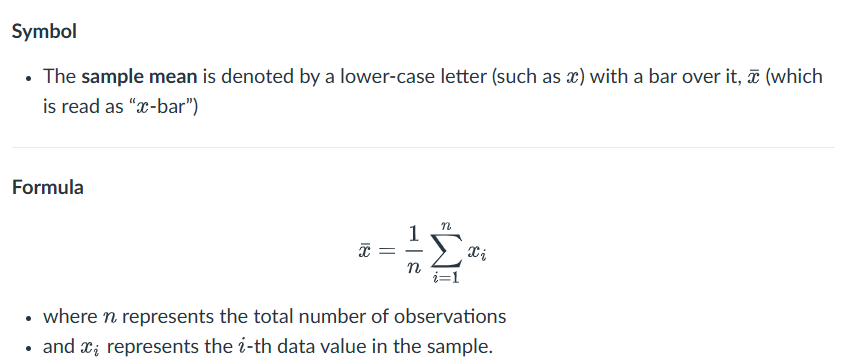
sample mean
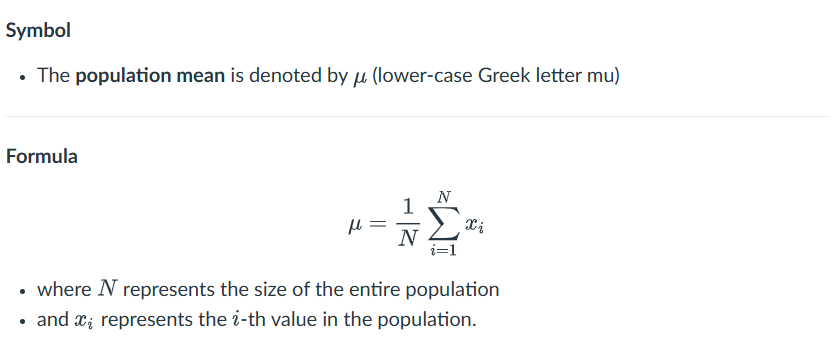
population mean
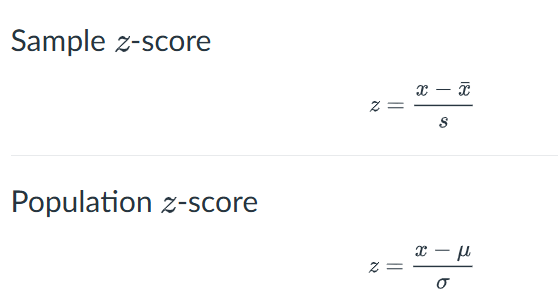
Z-score
z-score definition
The z-score for a given observation represents how far that observation is from the mean in standard deviations. The sign of the -score indicates the direction (above or below the mean).
Measures of position
Z-Scores
Percentiles
Quartiles
IQR
Q3 - Q1
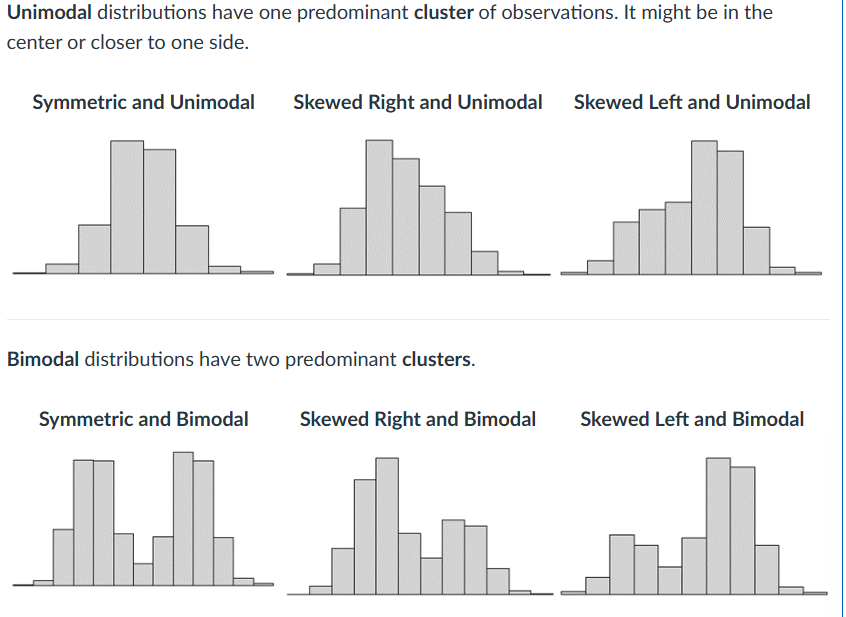
Histogram
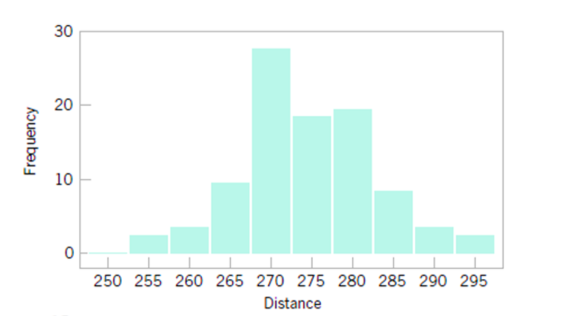
Graphical displays
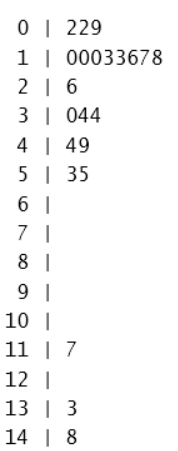
Stem-and-Leaf [R: stem]
Histogram [R: hist]
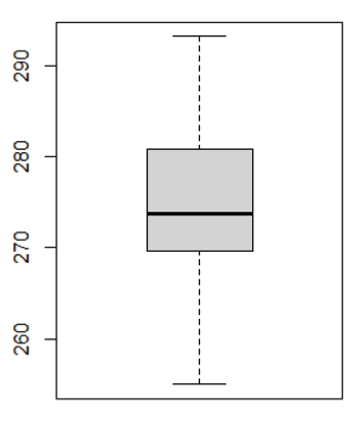
Boxplot [R: boxplot]
Boxplot
Stem and leaf plot
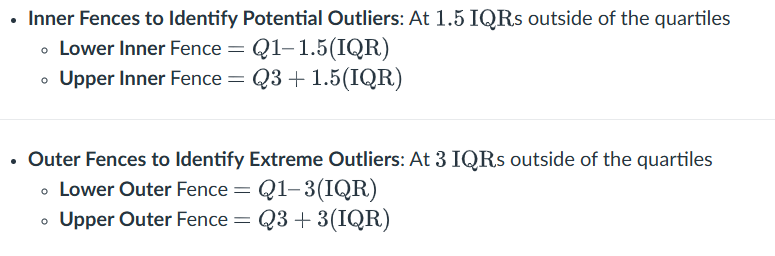
Fences
Degrees of freedom
n - 1
Standardization
the process of converting different variables to a common scale. It transforms raw data into z-scores by centering the mean at 0 and scaling the standard deviation to 1. This allows for the fair comparison of variables measured in different units or ranges. [1, 2, 3, 4, 5]
Five-Number Summary
The minimum
Q1 First quartile 25th Percentile
Q2 Median or Second quartile 50th Percentile
Q3 Third quartile 75th Percentile
The maximum.
histogram modality