Chapter 10- Population Dynamics
1/75
There's no tags or description
Looks like no tags are added yet.
Name | Mastery | Learn | Test | Matching | Spaced |
|---|
No study sessions yet.
76 Terms
Population Dynamics
Study of how populations change over time.
Exponential Growth
Growth rate increases proportionately with population size.

Geometric Growth
Population growth occurs at specific intervals, like a ladder.
Logistic Growth
Growth accelerates then slows as resources become limited.
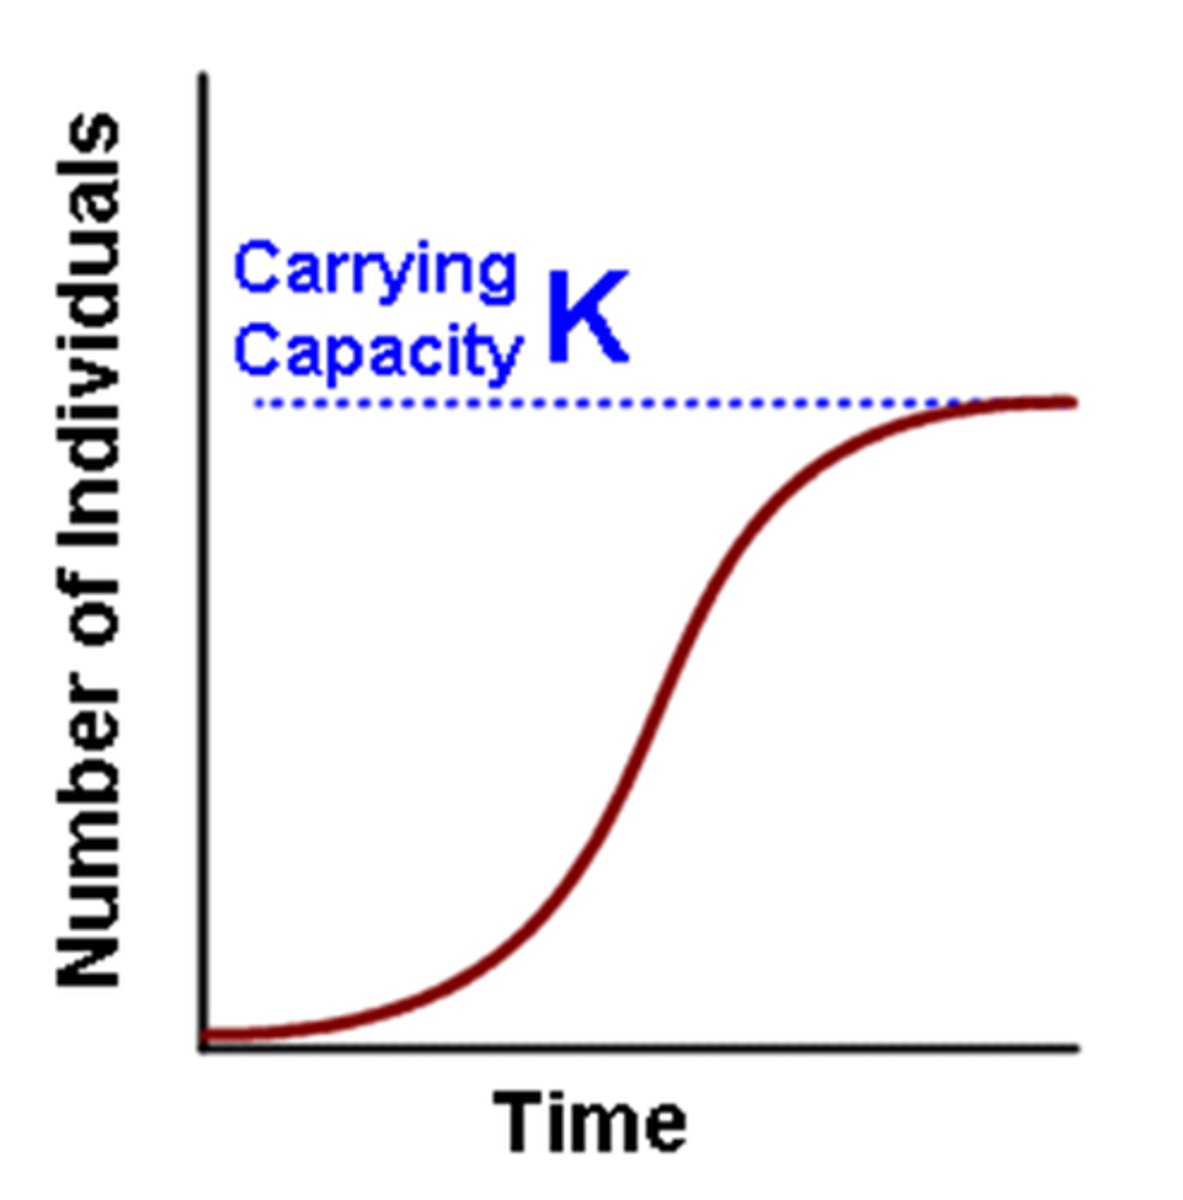
Carrying Capacity (K)
Maximum sustainable population size in an environment.
Population Fluctuations
Variations in population size due to environmental factors.
Population Cycles
Regular fluctuations in population size over time.
Continuous Births and Deaths
Births and deaths occur continuously in exponential growth.
Stepped Growth Pattern
Characteristic of geometric growth with discrete births.
Differential Equation
Mathematical model for continuous population growth. (Exponential)
Difference Equation
Mathematical model for discrete population growth. (Geometric)
Example Organisms (Exponential)
Includes humans, ants, bees, and microbes.
Example Organisms (Geometric)
Includes birds, amphibians, fish, and mammals.
Acute Inhibition Experiments
Studies on E. coli growth under different conditions.
Cattle Egret Expansion
Population increased rapidly after introduction to Americas. Geometric Growth
Resource Limitation
Factor that halts exponential and geometric growth.
Population Size Fluctuation
Deterministic changes in population size over time.
Accelerating Growth
Initial rapid increase in population during logistic growth.
Population Size Data
Used to observe growth patterns over time.
Density Dependent
Factors affecting population growth based on density.
Logistic Growth
Population growth model leveling off at carrying capacity.
E. coli Growth Curve
Sigmoidal curve representing E. coli growth in LB medium.
Population Fluctuations Graph
Irregular changes in population size over time.
Phytoplankton Abundance
Variation in phytoplankton cells per cubic centimeter.
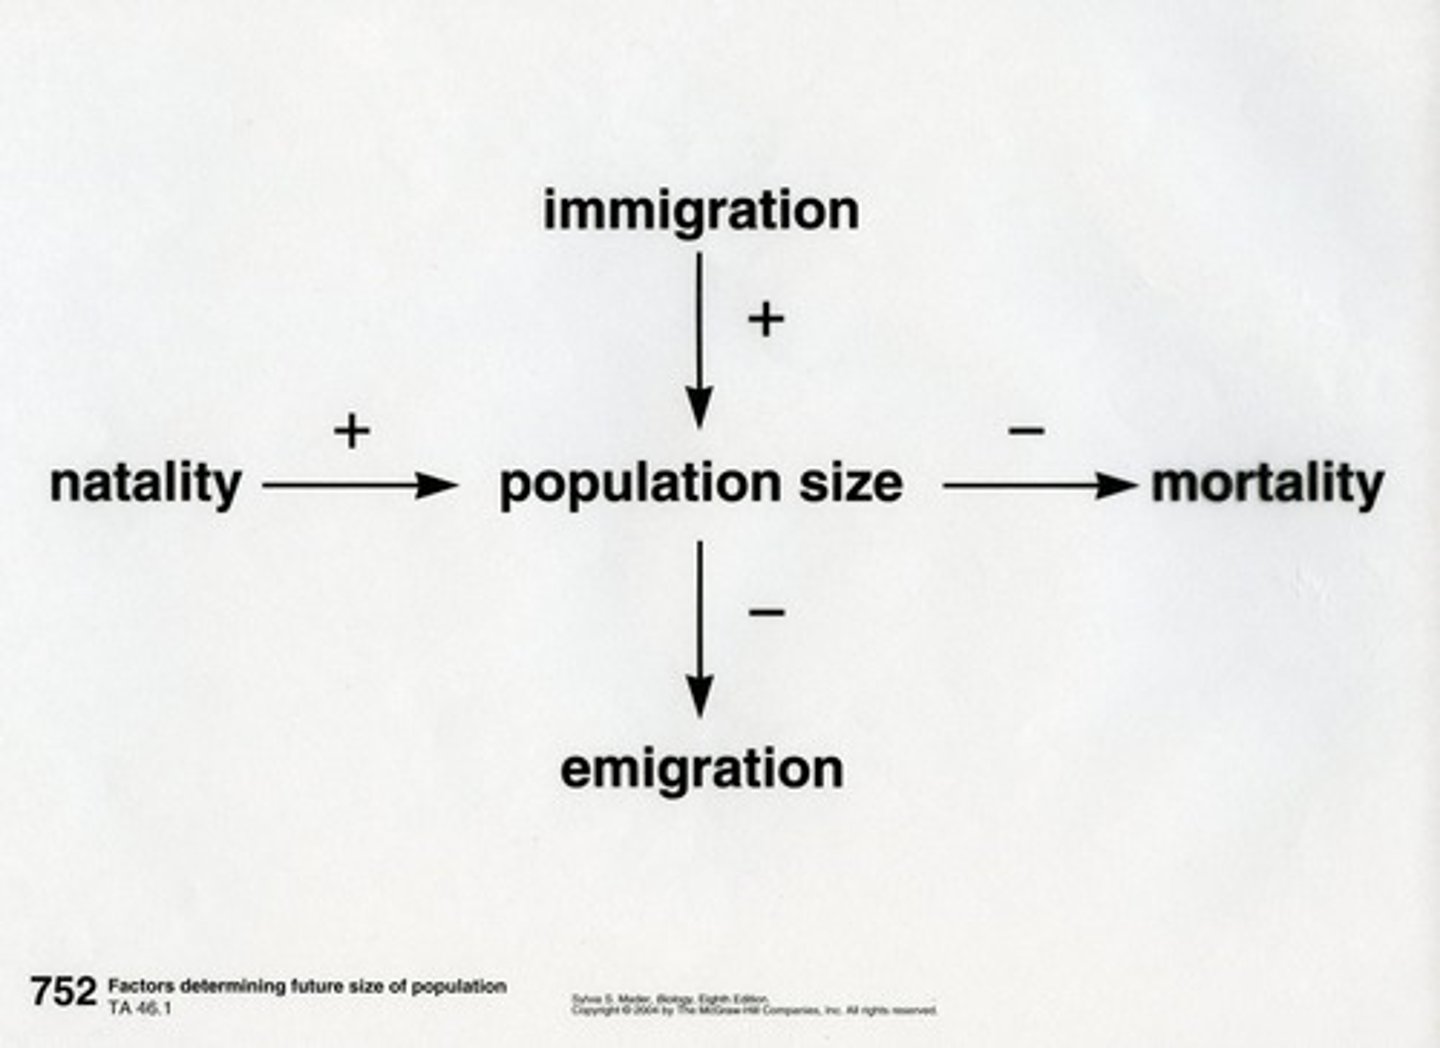
Birth and Death Rates
Rates affecting population size changes over time.
Biotic Environment
Living factors influencing population dynamics.
Abiotic Environment
Non-living factors affecting population dynamics.
Population Cycles
Regular rise and fall of population sizes over time.
Collared Lemming
Species exhibiting 4-year population cycles in Greenland. (Pop Cycle)
Predator Density
Population changes driven by predator abundance.
Food Supply
Availability impacting population growth and cycles.
Extinction Risk
Increased risk for fluctuating or small populations.
Chance Events
Random occurrences leading to population extinction.
Simulated Populations
Models used to study population growth variability.
Environmental Conditions
Factors influencing population growth rate fluctuations.
Vole Population Cycles
Example of cyclical population dynamics in Finland.
Nutrient Supplies
Essential for supporting phytoplankton growth.
Temperature Effects
Influences on population dynamics and growth rates.
Population Size Variability
Differences in population sizes due to environmental factors.
Logistic Function Parameters
Carrying capacity (K) represents the
maximum population size that can be
supported indefinitely by the
environment.
• Logistic growth can be modeled with a
differential or difference curve. The only
requirement is that a density dependent
term must be built into the model (more
on this in Chapter 11).
• Example organisms are the same that
experience exponential and geometric
population growth.
Concept 10.1, Objectives 1-2-3, Slide 42
Population growth rate
Rate of change in population size over time.
Extinction risk
Probability of a population declining to zero.
Breeding pairs
Mating individuals in a population contributing to reproduction.
Genetic drift
Random loss of genetic diversity affecting adaptability.
Inbreeding depression
Reduced fitness from mating between closely related individuals because it promotes deleterious alleles that are only expressed by homozygous recessive alleles
Population bottleneck
Sharp reduction in population size affecting genetic diversity.
Demographic stochasticity
Random events affecting birth and death rates in small populations.
Allee effects
Reduced reproduction rates in small populations due to isolation.
Growth rate of population dec at low densities, potentially leading to extinction, and increases at high densities, potentially leading to population growth
Passenger Pigeon
Species extinct due to overharvesting, habitat loss, and possible allee effects
Environmental stochasticity
Variability in environment affecting population dynamics.
Environmental catastrophes
Natural disasters impacting small population survival.
Heath hens
- Bird species driven to extinction by environmental factors and hunting
Effective population size
Number of individuals contributing to future offspring.
Extinction vortex
Cycle of negative effects leading to population extinction.
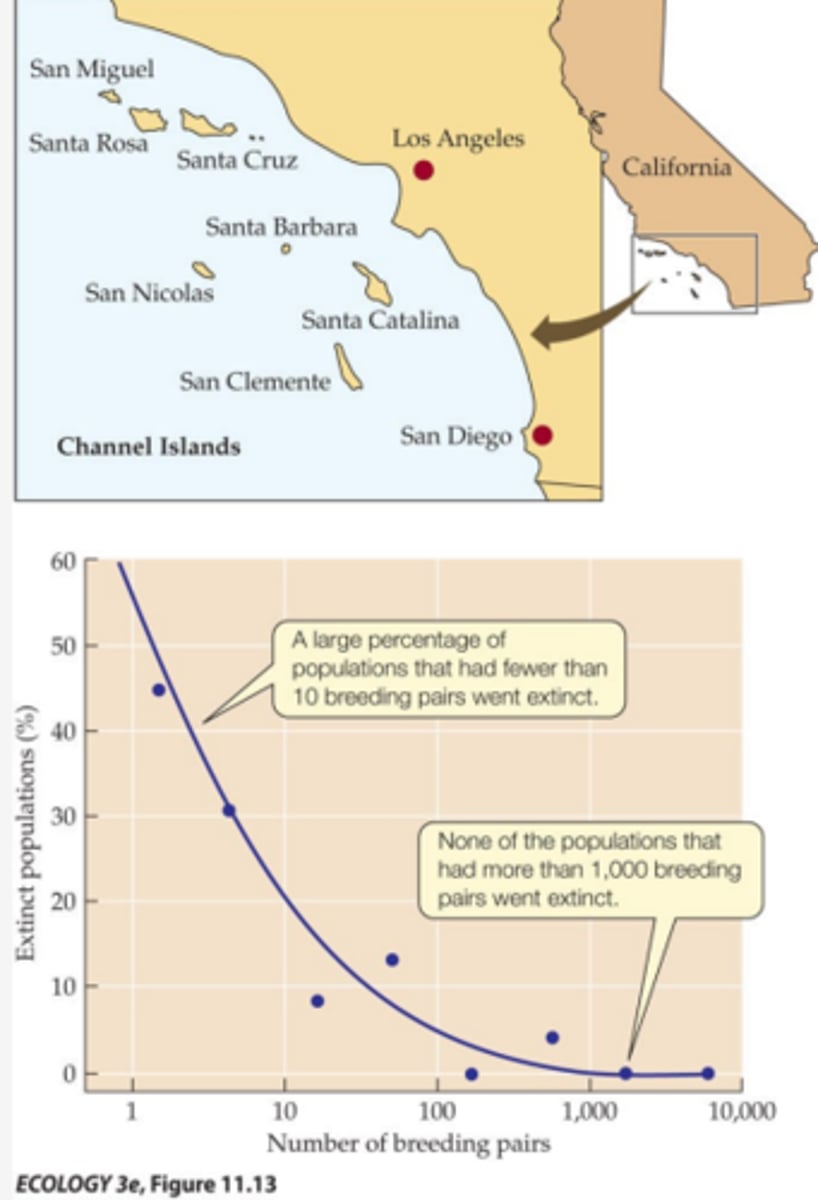
Channel Islands
Location where bird population extinction rates were studied.
Genetic variation
Diversity of genes within a population affecting survival.
Recessive deleterious alleles
Harmful genes expressed only in homozygous individuals.
Natural disasters
Events like fires or floods that can decimate populations.
Birth rate
Rate at which new individuals are born in a population.
Death rate
Rate at which individuals die in a population.
Small population size
Increased vulnerability to extinction due to various factors.
5 Patterns of Population Growth
1. Exponential growth
2.Geometric growth
3. Logistic growth
4.Population fluctuations (deterministic, not random)
5. Population cycles
What causes a single population to experience different patterns of population growth over time?
1. Ecological conditions
2. Life History
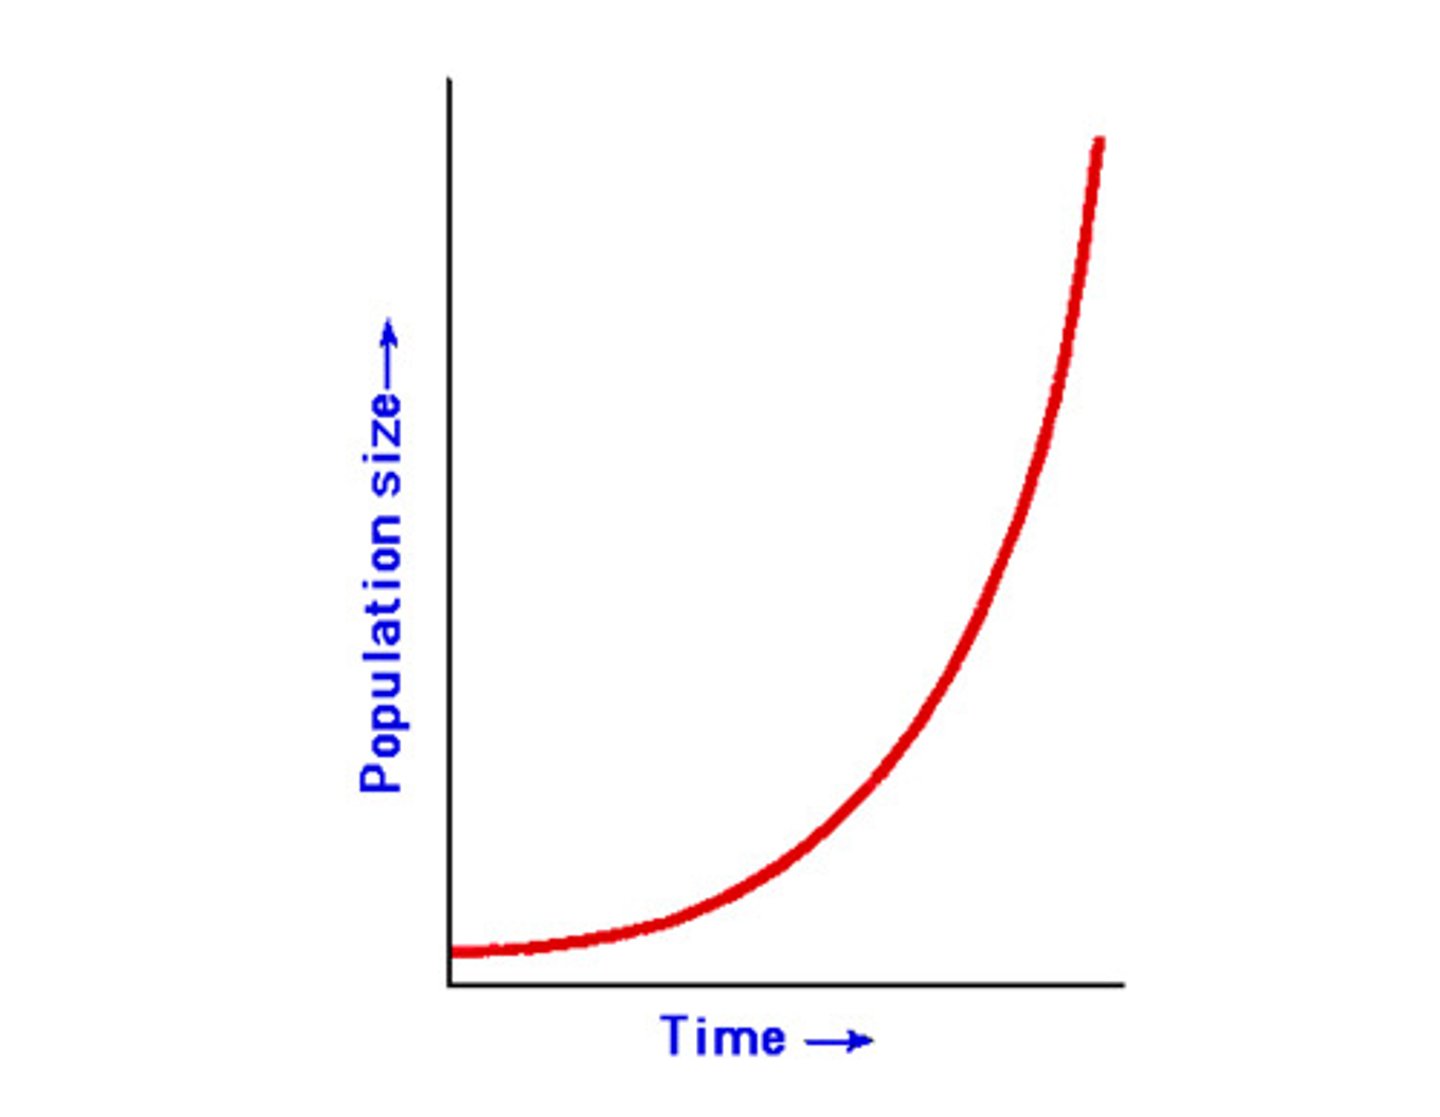
Components of Exponential Growth and its Graph
- During exponential growth, the rate of population growth increases proportionately with population size
- J Curve
-Exponential growth can only continue for as long as resources are unlimiting relative to population size.
- Births (and deaths) occur more continuously over time, so the shape of the growth curve is more continuous.
- Mathematically modeled with a differential equation
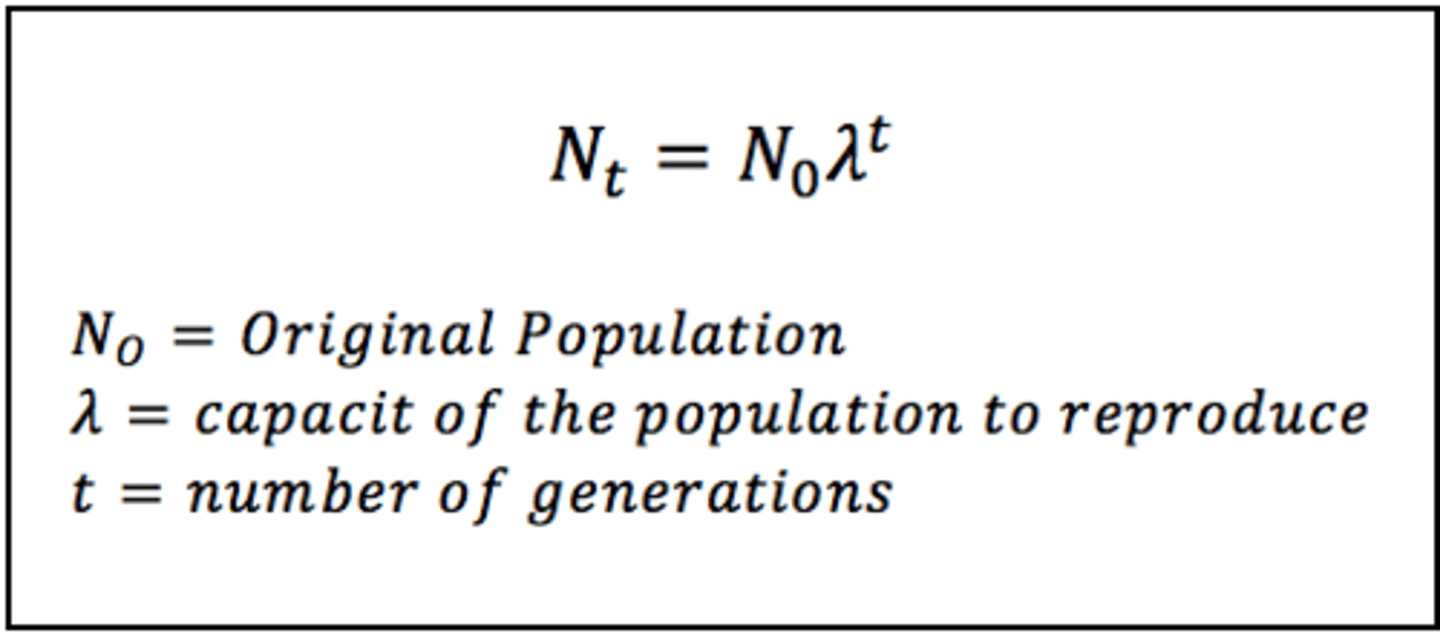
Components of Geometric Growth and Its Graph
- During geometric growth (like during exponential growth), the rate of population growth increases proportionately with population size
- Geometric growth can only continue for as long as resources are unlimiting relative to population size.
- While deaths occur continuously overtime, births occur with a specific frequency, so the growth pattern appears more like an increasingly stepped ladder.
- Geometric growth is generally modeled with a difference equation
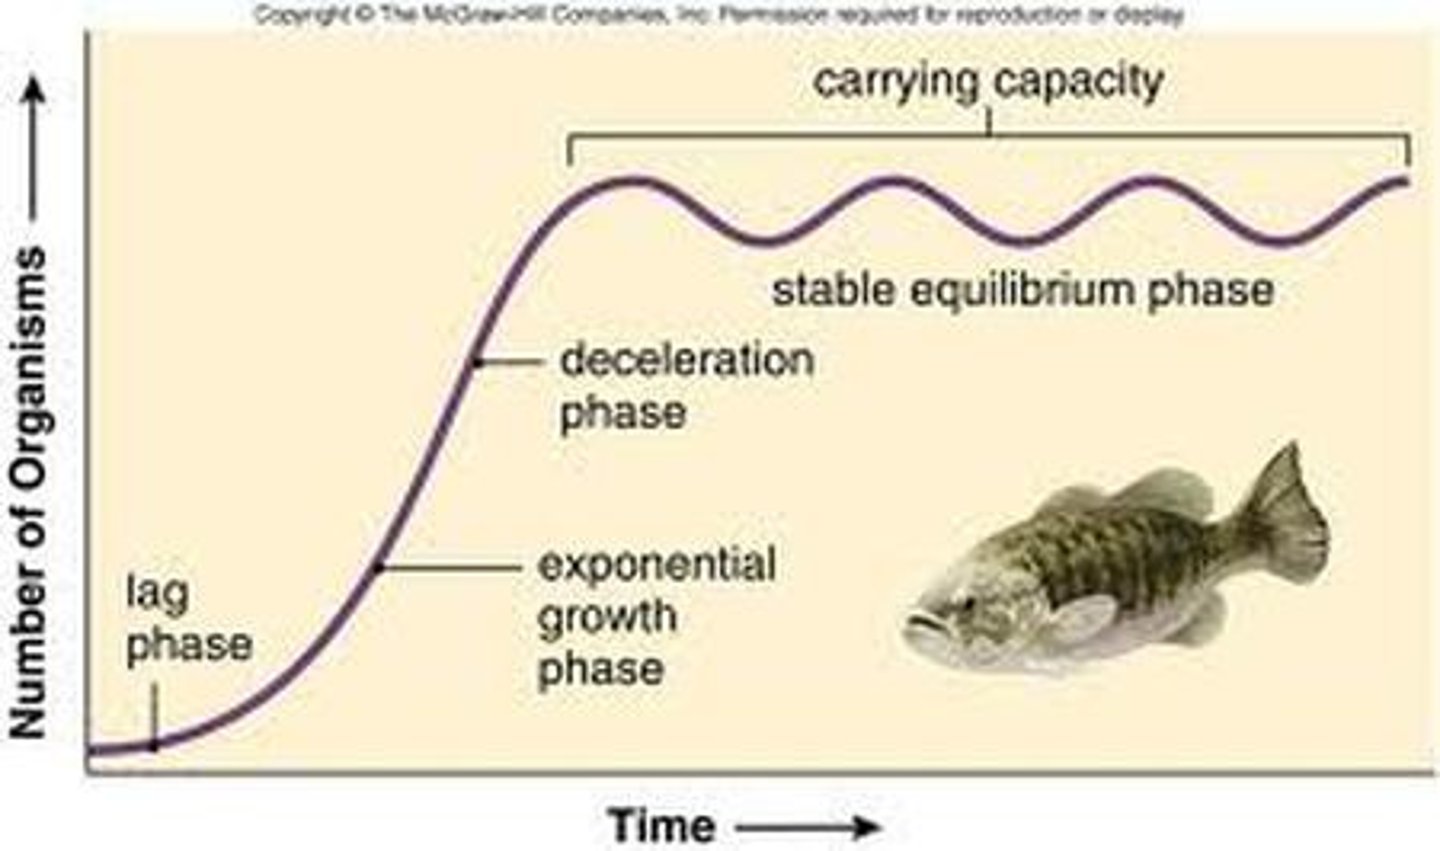
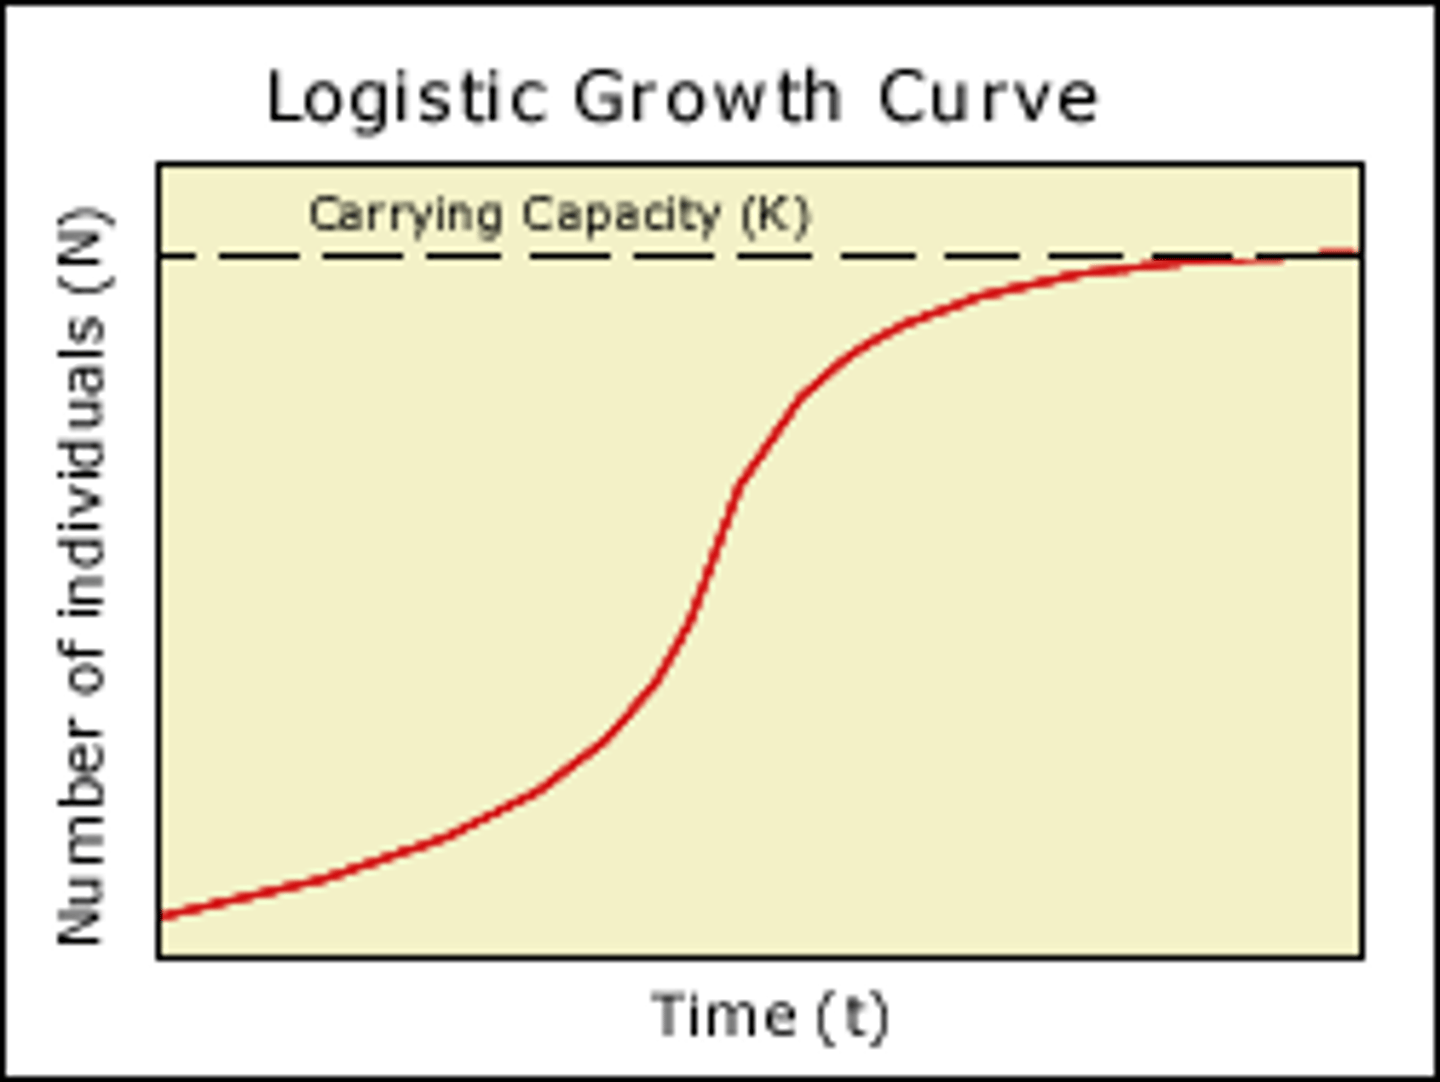
Components of Logistic Growth and Its Graph
- During logistic growth, the rate of growth starts to accelerate like exponential growth, but starts to slow and eventually falls to zero as resources become increasingly scarce.
- The population stops growing when it reaches the carrying capacity of the environment.
- Carrying capacity (K) represents the maximum population size that can be supported indefinitely by the environment.
- Logistic growth can be modeled with a differential or difference curve.
- The only requirement is that a density dependent term must be built into the model
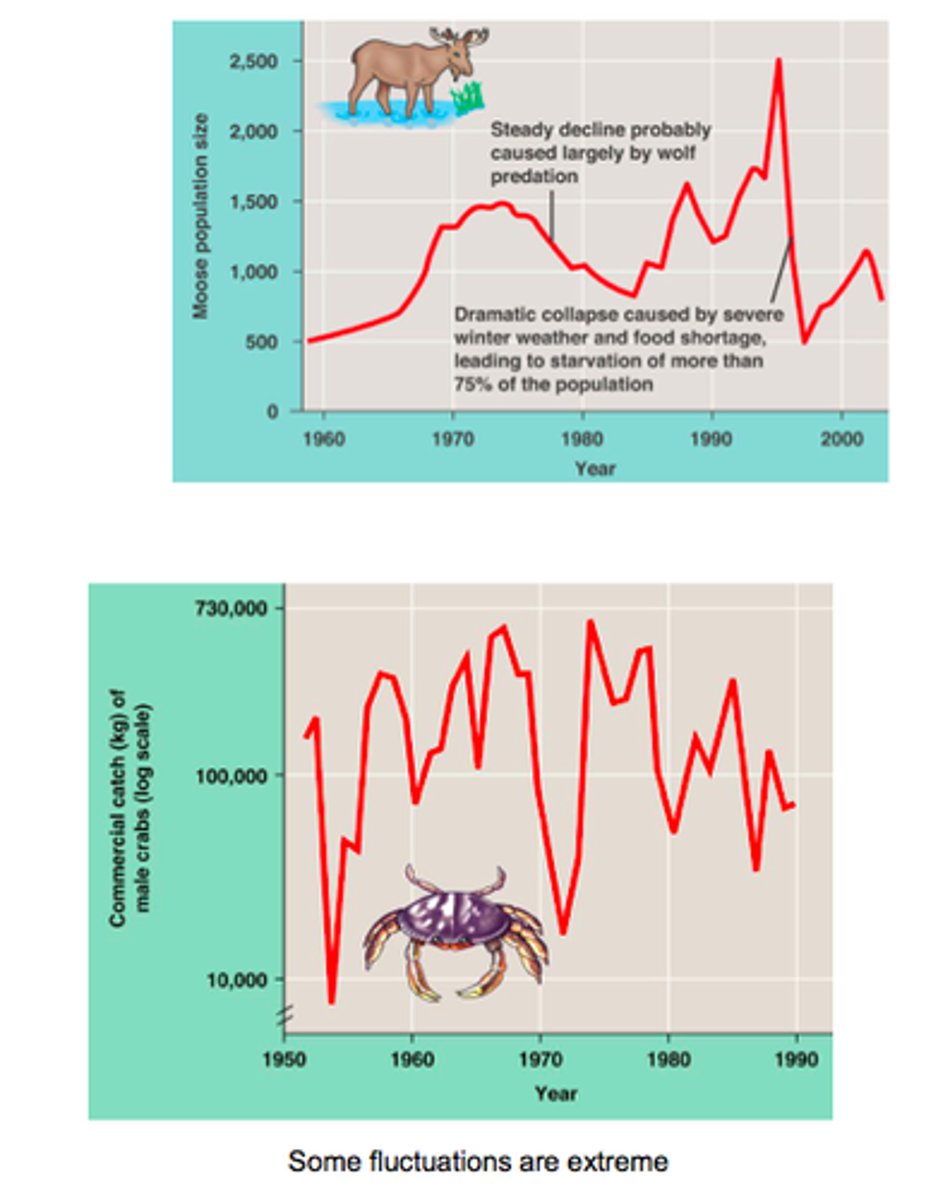
Components of Population fluctuations
- During natural population fluctuations, population size rises and falls over time in an irregular pattern.
- Fluctuations in population size are the result of changes in birth and death rates.
- Changes in birth and death rates are driven by changes in the biotic and abiotic environment
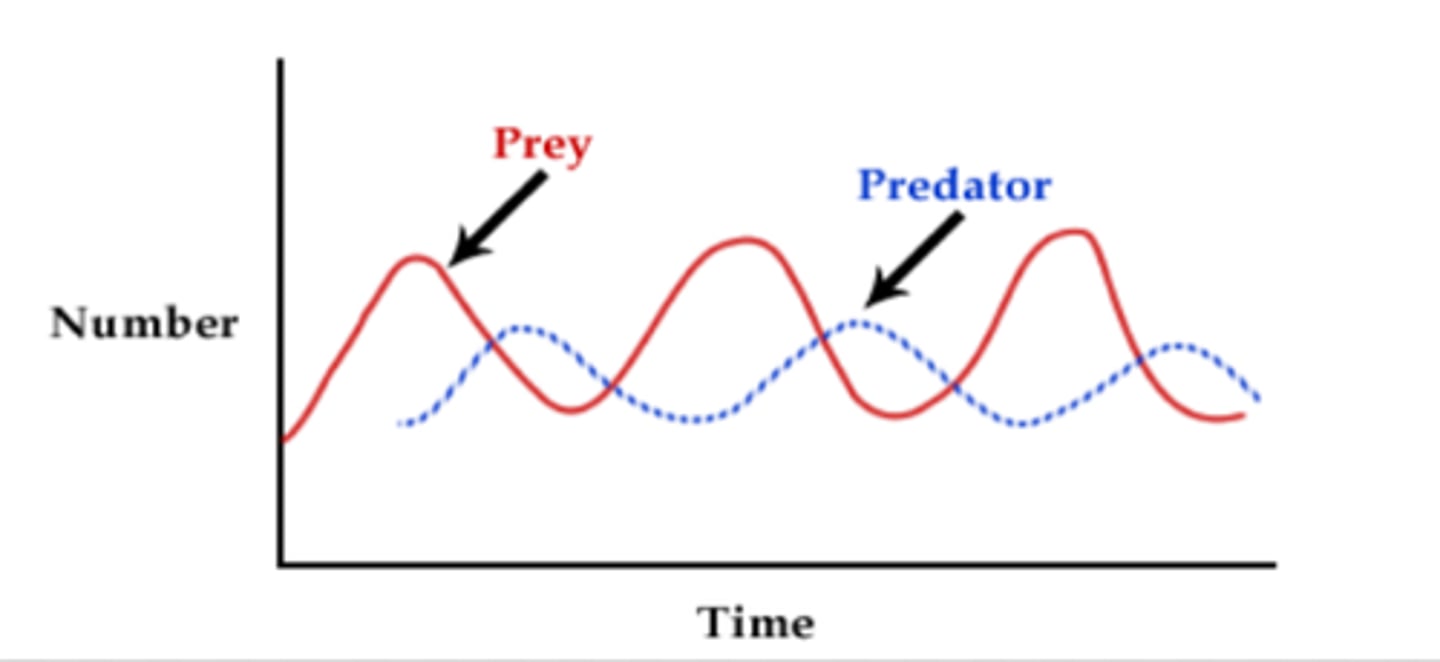
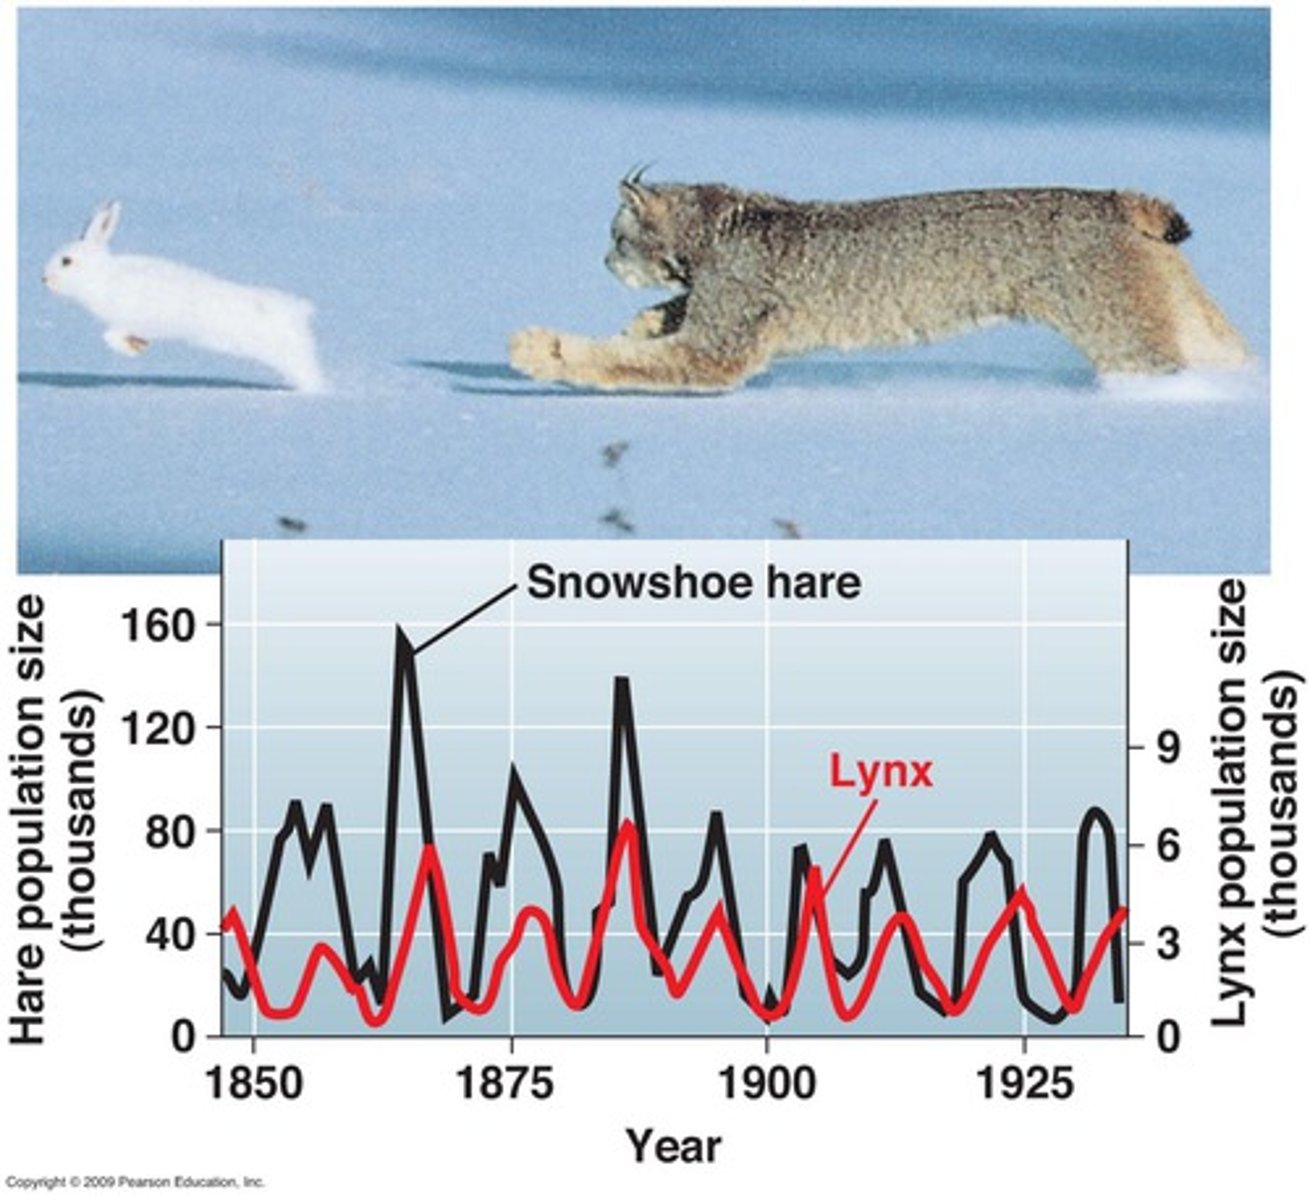
Components of Population Cycles
- During natural population cycles, alternating periods of high and low abundance occur after constant (or nearly constant) periods of time.
-Fluctuations in population size are the result of cyclical changes in birth and death rates.
- Cyclical changes in birth and death rates are driven by cyclical changes in the biotic and abiotic environment.
- Collared lemming abundance tends to rise and fall every 4 years, possibly driven by cyclical changes in either density of predators or food supply
How do fluctuations in population growth rate increase risk of population extinction?
- Fluctuations in population growth rate (which can be negative) are synonymous with fluctuations in population size.
- The greater the fluctuation in population size, the greater the probability that abundance eventually declines to zero, all else equal.
Explain Why Small Populations are at much greater risk of extinction compared to larger populations
- The smaller the population, the greater the probability that any reduction in population size causes abundance to decline to zero, all else equal.
2 Genetic Factors that can drive small population to extinction
1. Genetic Drift
2. Inbreeding Depression
Explain Bottleneck and Inbreeding Depression in Large Cats
- Small populations lead to inbreeding and loss of genetic variation -> increased risk of extinction
2 Demographic Factors that can drive small population to extinction
1. Demographic stochasticity
- Chance events can have strong effects on birth and death rates in small populations (e.g., in a population of only two individuals, only one accidental death would increase the death rate for the population by 50% in that year).
2. Allee affects
- A very small population size can result in a decrease in the birth rate if individuals have difficulty finding other members of their species for reproduction. - The smaller the population, the greater the problem becomes
2 Environmental Factors that can drive small population to extinction
1. Environmental stochasticity
- Environmental variability can drive changes in birth and death rates.
2. Environmental catastrophes
- Localized natural disasters can devastate small populations
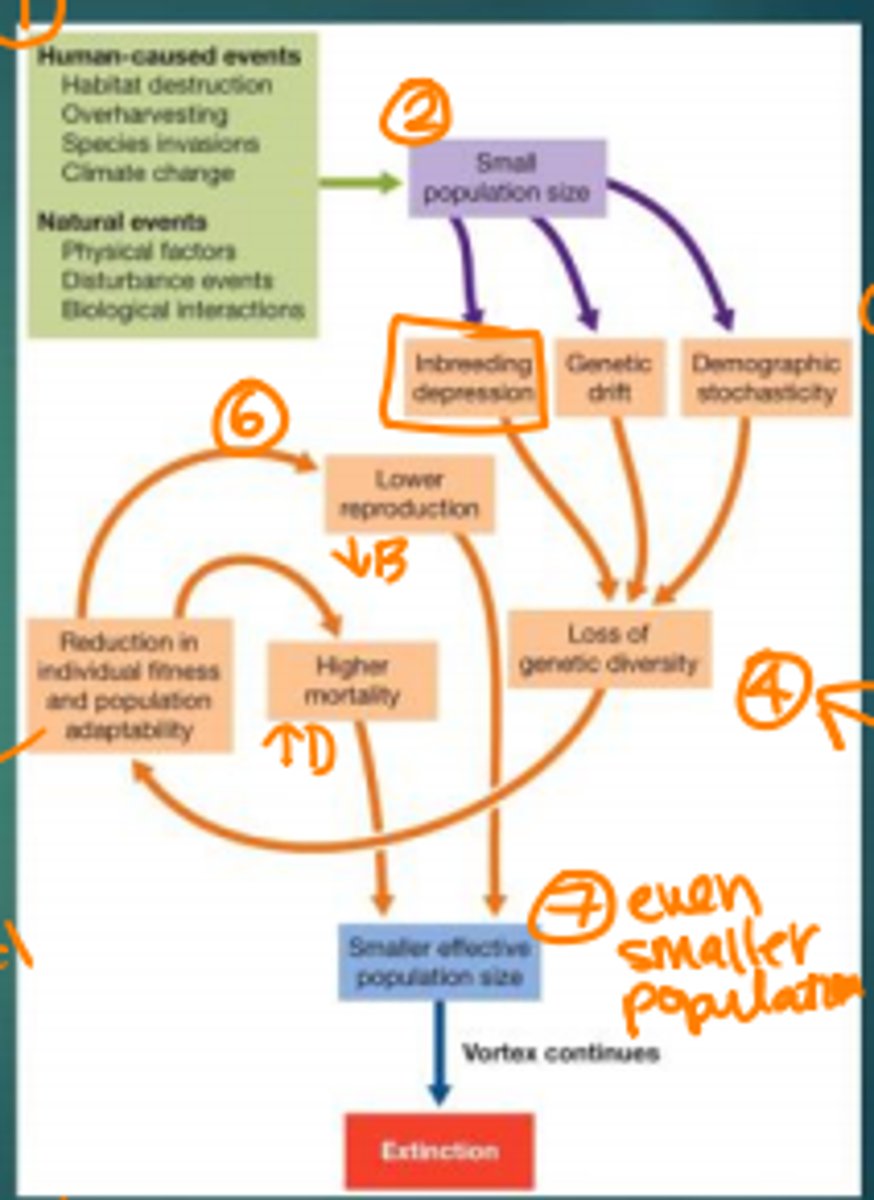
Events of Extinction vortex
1.) Human-cause or Natural Events
2.) Small Pop. Size
3.) Inbreeding depression/genetic drift/demographic stochastically/ environmental stochasticity
4.) Loss of Genetic Diversity
5.) Reduction in Individual Fitness and population adaptability
6.) Lower Reproduction
7.) Smaller Effective Population Size
8.) Extinction
Environmental Stochasticity vs Demographic Stochasticity
Environmental- Changes in average birth or death rate of population from one year to next.
Represents environmental conditions
Demographic- Average (population level) birth and death rates may be constant across years, but fates of individuals differ because of random nature of whether each individual reproduces or not and survives or not