Chem unit 9.2 Analytical Chem
1/10
There's no tags or description
Looks like no tags are added yet.
Name | Mastery | Learn | Test | Matching | Spaced | Call with Kai |
|---|
No analytics yet
Send a link to your students to track their progress
11 Terms
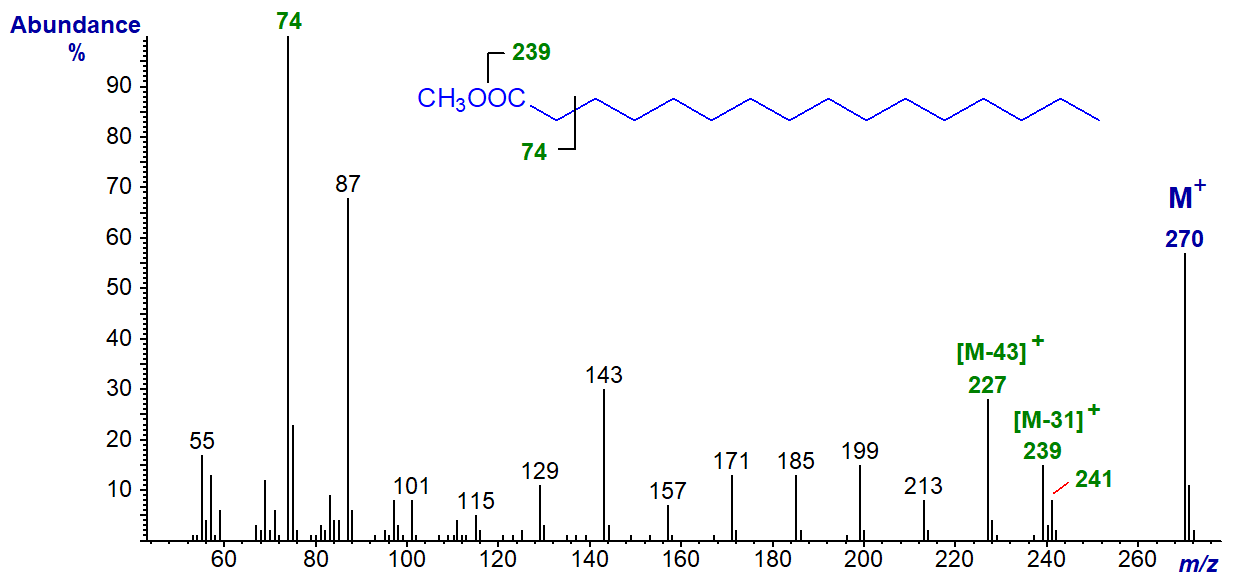
what does the Mass Spectrometry do
of organic compounds can cause the fragmentation of molecules to show molar mass
uses no electromagnetic radiation
on x-axis, it is mass/charge ratio essentially just mass
the last peak comes from the parent ion, or molecular ion, the ones before are the fragments of the molecule.
due to the isotopes of carbon atoms (carbon 13), there may be another small peak after
by breaking the molecule down by each functional group we can predict some of the peaks with their distinct molar mass — all written as ions
how does IR spec work
moles have covalent bonds, some bonds absorb certain parts of the infrared spectrum causing bond is stretching; it will only happen if the bond stretching causes a polarity change or change in the dipole moment
What are obvious observations on IR Spec
O-H large and wide peak
C=O large thin peak
TABLE 20
we only look at left side of graph
What does HNMR use to work and what does it show
uses radio waves to show the different chemical environments for hydrogen, with a ratio of the hydrogen to the number of environments.
It uses strong magnets to cause nuclei to align in different spin states resulting in radio wave emission
the number of different groups of peaks, shows how many environments there are
TABLE 21
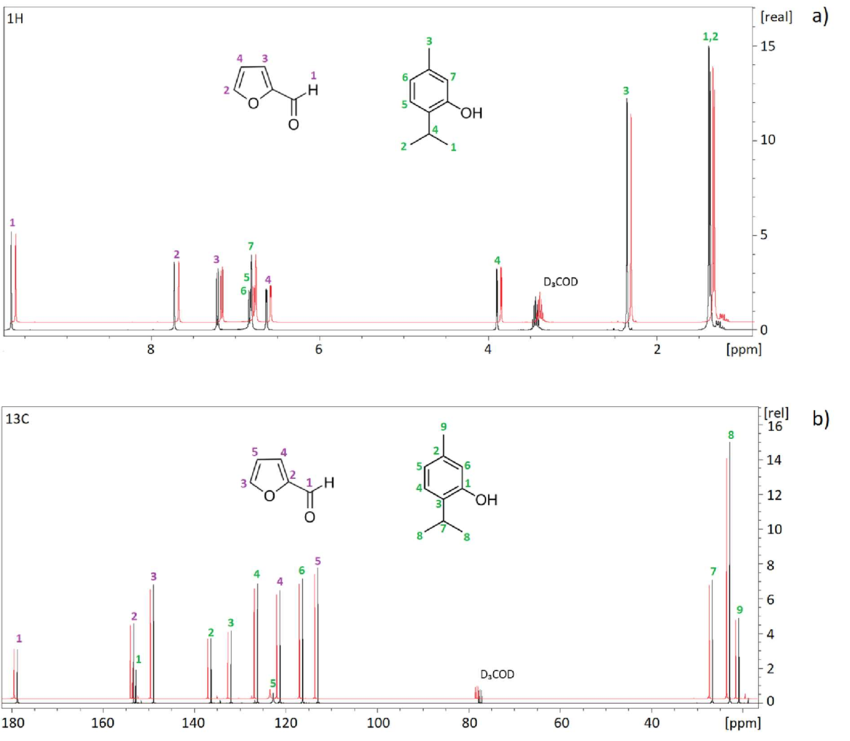
How to name HNMR spectrum peaks
one peak = singlet
no hydrogen atoms next to it
two peaks = doublet
one hydrogen next to it
one peak two small ones = triplet
two hydrogen atoms next to it
two peaks two small ones = quartet
having a quartet means that there are 3 hydrogens next to the hydrogen, such as CH2CH3, the CH2 will show up as a quartet and CH3 will show up as triplet
anything more = multiplet
to the left is an environment with OH whereas methyl is right
integration trace
how many hydrogens are in one environment
exception for HNMR peaks
alcohol does not display splitting; anything next to it will be singlet;
CH3OH the CH3 will show up as a singlet
but OH is still found on graph, nect to three other hydrogens multiplet
What does the molecular ion in mass spec show
gives the relative molecular mass of the molecule
what does splitting pattern mean on HNMR
the singlet, etc
what does ratio of areas mean
integration trace
what happens when molecule absobrbs IR
bond angle chnages and teh bond strechtes causing a polarity change