Understanding t-Tests in Statistical Analysis
1/82
There's no tags or description
Looks like no tags are added yet.
Name | Mastery | Learn | Test | Matching | Spaced |
|---|
No study sessions yet.
83 Terms
Dependent variable
Numerical variable influenced by independent variable.
Independent variable
Categorical variable that affects dependent variable.
Logistic regression
Used for binary outcome variables.
Linear regression
Analyzes relationships between numerical variables.
Contingency table analysis
Examines relationships between categorical variables.
One sample t-test
Compares sample mean to population mean.
t score formula
t = (x - μ) / s.
Standard error of the mean
Standard deviation of sampling distribution of mean.
t-distribution
Family of distributions with fatter tails.
Degrees of freedom
Calculated as n - 1 for one sample t-test.
Central Limit Theorem
Sampling distribution approaches normality with large n.
Hypothesis testing
Process of establishing null and alternative hypotheses.
Null hypothesis (H0)
Assumes no difference between sample and population.
Alternative hypothesis (H1)
Indicates a difference exists between sample and population.
p-value
Probability of observing data under null hypothesis.
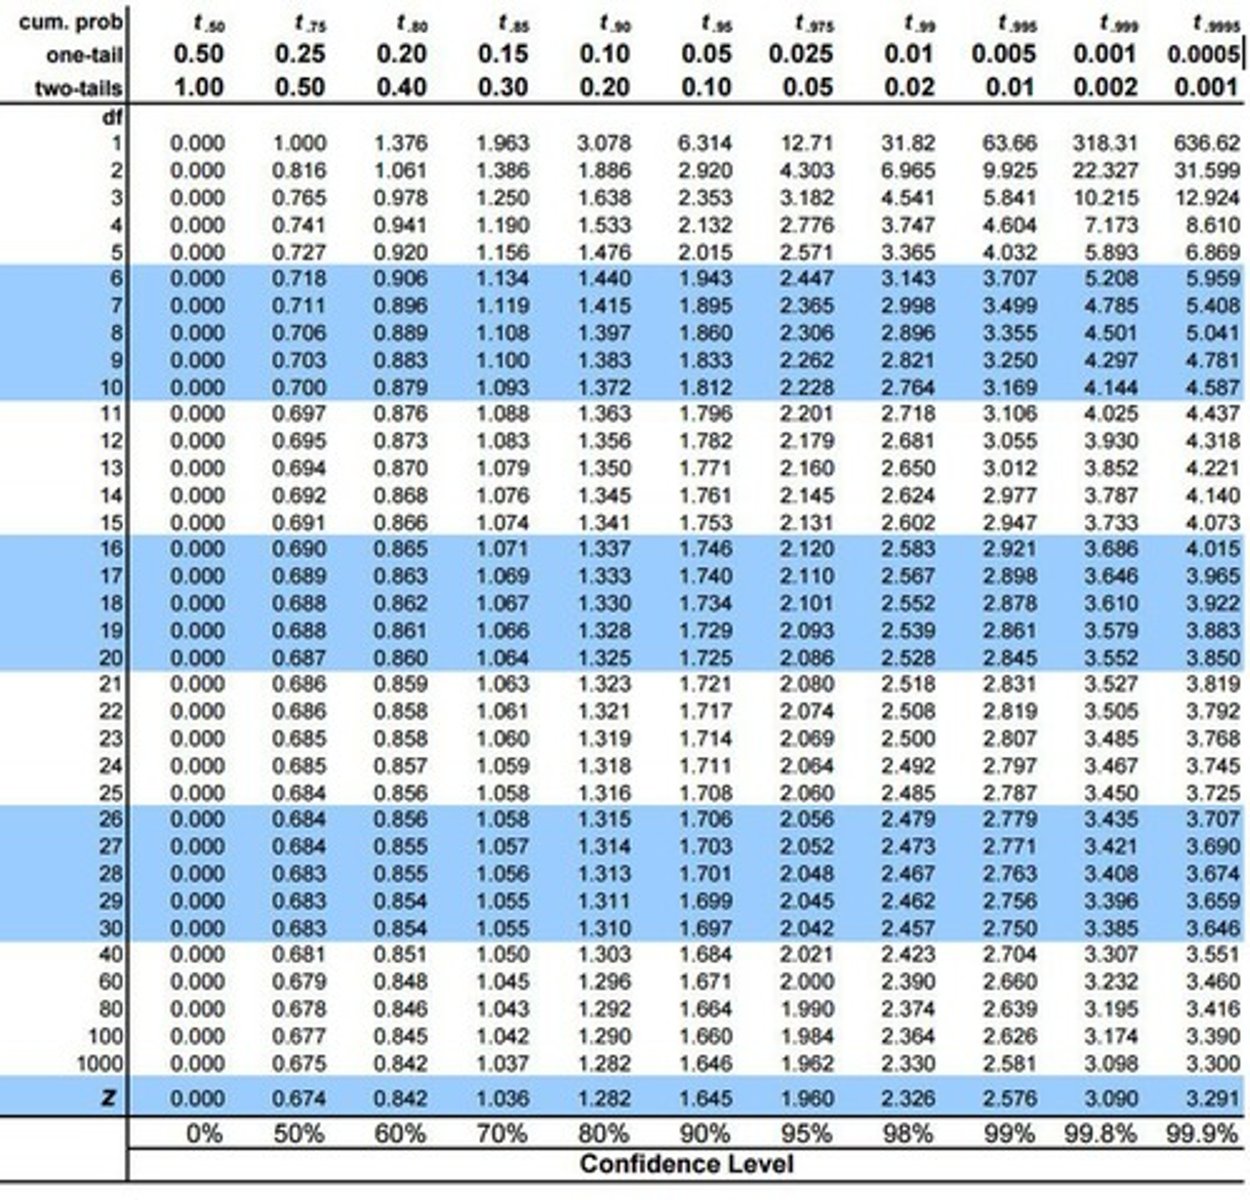
Critical t table
Used to determine significance of t score.
Alpha level (α)
Threshold for rejecting null hypothesis, commonly 0.05.
Fail to reject null hypothesis
Insufficient evidence to support alternative hypothesis.
Sample mean (X)
Average score of the sample group.
Population mean (μ)
Expected average score of the population.
Standard deviation (SD)
Measure of variability within a sample.
Sample size (n)
Number of observations in the sample.
Dependent samples t-test
Compares scores of matched pairs.
One-sample t-test
Compares group mean to population norm.
Paired samples t-test
Another name for dependent samples t-test.
Difference scores
Scores calculated from paired observations.
Standard error
Measure of variability in sample means.
Degrees of freedom (df)
Calculated as n - 1 for paired samples.
Null hypothesis (H0)
Assumes no difference between group means.
Alternate hypothesis (H1)
Assumes a difference exists between group means.
t-statistic
Ratio of mean difference to standard error.
t-critical
Value from t-distribution for significance testing.
Significance level (α)
Probability of making a Type I error.
Homogeneity of variance
Assumption that variances of groups are equal.
Levene's F test
Tests for homogeneity of variances.
Pooled variance
Weighted average of variances from two samples.
Standard deviation (SD)
Measure of variability in a dataset.
t-calc
Calculated t-statistic from sample data.
t-table
Reference for critical t-values based on df.

Mean difference
Difference between group means in t-test.
Type I error
Rejecting H0 when it is true.
Type II error
Failing to reject H0 when it is false.
Normality assumption
Dependent variable should be normally distributed.
Sample size (n)
Number of pairs in dependent samples.
Before and after therapy
Common context for dependent samples t-test.
Statistical significance
Indicates if results are unlikely due to chance.
Degrees of Freedom (df)
Calculated as n - 1 for samples.
tcalc
Calculated t-value from sample data.
tcritical
Value obtained from critical t table.
Independent Samples T-Test
Compares means of two independent groups.
Mean Stress Level Before Treatment
M = 64.63, SD = 11.67.
Mean Stress Level After Treatment
M = 61.88, SD = 9.33.
t(7)
t-value with 7 degrees of freedom.
p > 0.05
Indicates no significant difference found.
Standard Error
Estimate of the variability of sample means.
Homogeneity of Variance
Variance of groups should be equal.
Levene's F Test
Tests for homogeneity of variance.
Pooled Variance
Weighted average of two sample variances.
t Statistic Formula
t = (x̄1 - x̄2) / SE.
Sample Size Impact
Larger sizes yield more reliable t values.
Alternative Hypothesis (H1)
Assumes a difference exists between means.
Two-Tailed Test
Tests for differences in both directions.
Level of Significance (α)
Threshold for rejecting the null hypothesis.
Standard Deviation Calculation
Measures variability within a sample.
Robustness of t-Test
Resilient to minor violations of assumptions.
Sample Design Types
Between-subjects and within-subjects designs.
tcritical
Critical t-value from statistical tables.
H0
Null hypothesis, no effect or difference.
M
Mean score of a sample.
SD
Standard deviation, measure of variability.
df
Degrees of freedom in statistical tests.
p-value
Probability of observing results under H0.
Cohen's d
Effect size measuring mean difference in SD units.
one-tailed test
Tests for differences in one direction.
α (alpha)
Significance level, probability of Type I error.
Effect size
Quantifies the magnitude of a difference.
Minimum r
Smallest correlation coefficient for effect size.
Minimum d
Smallest Cohen's d for effect size.
Psychological Bulletin
Journal where Kimmel's criteria were published.
Euzac
Antidepressant showing lower depression scores.
Prozac
Antidepressant with higher depression scores.
t(14)
t-value with 14 degrees of freedom.
Significance level
Threshold for determining statistical significance.