Stats Vocab - Unit 2
5.0(2)
Studied by 234 people0%Exam Mastery
Build your Mastery score
Supplemental Materials Call Kai
Card Sorting
1/25
Earn XP
Description and Tags
Last updated 7:25 AM on 10/18/22
Name | Mastery | Learn | Test | Matching | Spaced | Call with Kai |
|---|
No analytics yet
Send a link to your students to track their progress
26 Terms
1
New cards
Standardized Values
Values for which the units have been systematically eliminated, allowing for comparison, even if the original variables had different scales and/or units
2
New cards
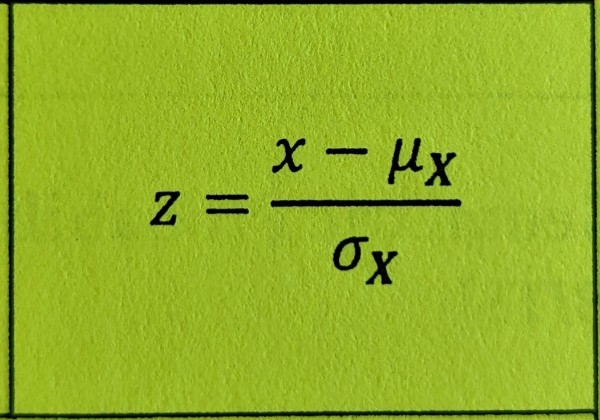
z-Score
Standardized value that identifies how many standard deviations a value is from the mean; z-scores don't change a distribution's shape, but force the mean to 0 and the standard deviation to 1
3
New cards
Normal Model
Appropriate for distributions that are roughly "bell-shaped" amd unimodal symmetric; represented by the notation N(mean, SD)
4
New cards
Nearly Normal Condition
The shape of a distribution must be roughly "bell-shaped" and unimodal symmetric in order to use the Normal Model
5
New cards
Normal Probability Plot
Display used tp assess whether or not a distribution is approximately Normal... if the plot is relatively straight, then the data satisfies the Nearly Normal Condition
6
New cards
68-95-99.7 rule -> "Empirical Rule"
For a Normal Model, about 68% of the data values fall within 1 standard deviation of the mean, 95% within 2 standard deviations, and 99.7% within 3 standard deviations
7
New cards
Standard Normal Model
The Normal Model with mean 0 and standard deviation 1; N(0, 1)
8
New cards
Normal Percentile/P-value
Gives the percentage of values in a Standard Normal distribution found at or below a given z-score. Also known as the P-value, since it is the probability that you will land at that z-score or below in a Standard Normal distribution
9
New cards
Random Variable
Denoted by a capital letter such as X, assumes any of several different values as a result of a random event
10
New cards
Discrete Random Variable
Random variable that can only take on distinct numerical values within a range of values
11
New cards
Continuous Random Variable
Random Variable that can take on any numerical value within a range of values
12
New cards
Probability Model
Function that associates a probability with each value of a discrete random variable, denotes P(X=xi), or with any interval of values of a continuous random variable, e.g. P(X ≤ xi)
13
New cards
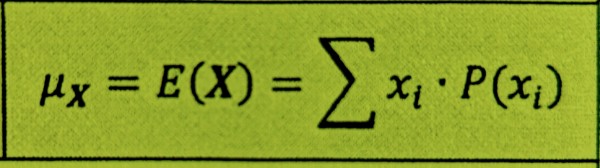
Expected Value
The theoretical long-run mean value of a random variable (the center of its model)
14
New cards
Deviation
The difference between a particular value in a probability model and the expected value (actual - expected = xi - ux)
15
New cards
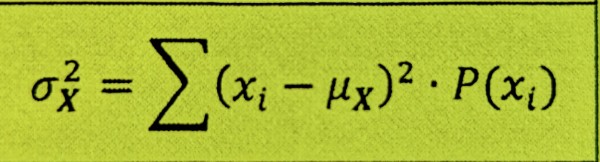
Variance
The expected value of the squared deviation from the mean; the square of the standard deviation
16
New cards
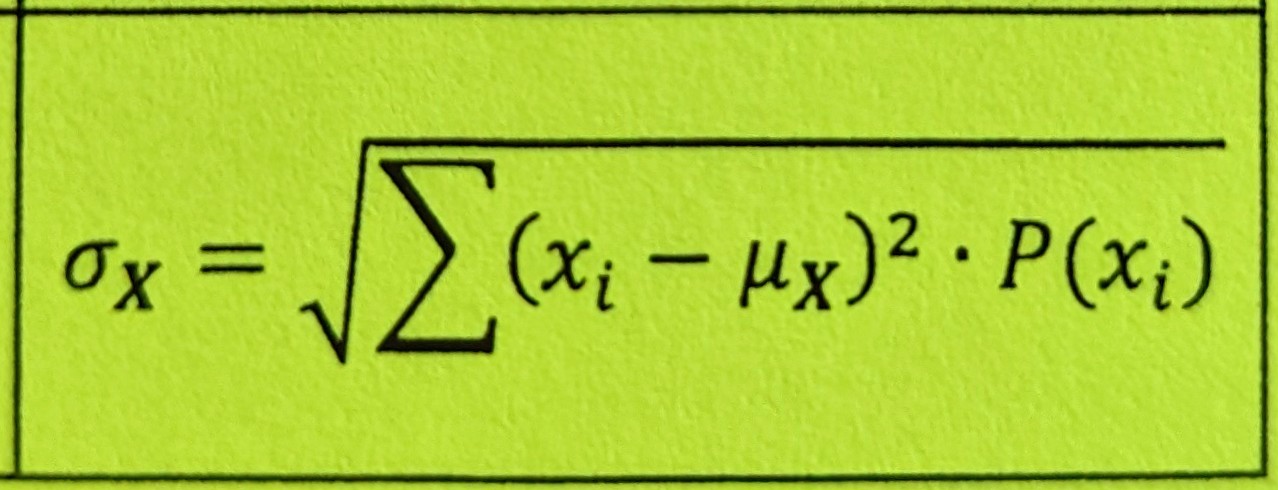
Standard Deviation
The square root of the variance; the average distance of a random variable's value from its expected value (center)
17
New cards
Bernoulli Trials
Trials that meet the following conditions:
- Binary -> only two possible outcomes, success or failure
- Independence
- Succes probability (p) is constant... thus so is the failure probability (q)
- Binary -> only two possible outcomes, success or failure
- Independence
- Succes probability (p) is constant... thus so is the failure probability (q)
18
New cards
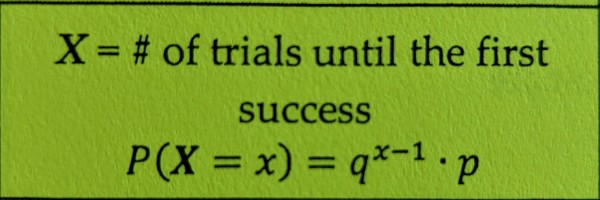
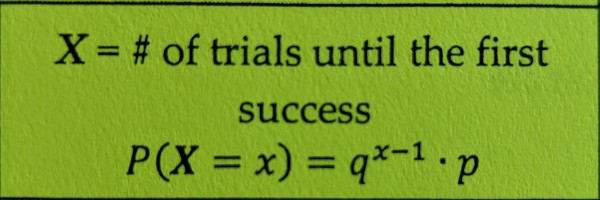
Geometric Probability Model [BITS]
Denotes Geom(p), determines the probability of the first success occuring on trial x for Bernoulli trials
19
New cards
10% Condition Independence
Trials can be considered sufficiently independent if the sample size is less than 10% of the population from which it will be drawn
20
New cards
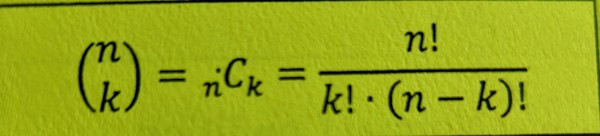
Combination
The number of ways to have k successes in n trials, called "n choose k"
21
New cards
Binomial Probability Model [BINS]
Denoted binom(n,p), determines the probability of x successes in n Bernoulli trials
22
New cards
Success/Failure Condition
A Binomial Probability Model has a sufficient sample size to be considered nearly Normal if at least 10 successes and 10 failures are expected, thus np ≥ 10 and nq ≥ 10
23
New cards
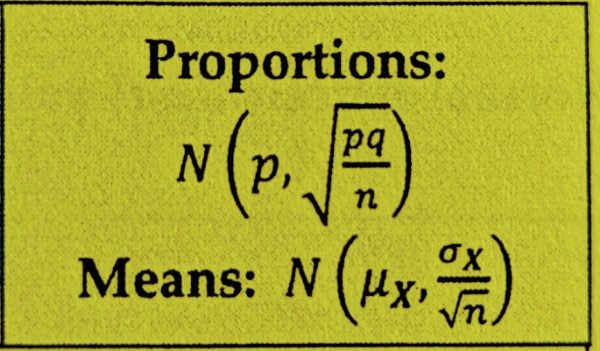
Sampling Distribution Model
The distribution that shows the behavior of a statistic (value from a sample) with its sampling variability over all possible samples of the same sample size n
24
New cards
Central Limit Theorem
The sampling distribution model of means/proportions is approximately Normal for "large enough" sample size n, as long as the observations are independent
25
New cards
Law of Diminishing Returns
The standard deviation of a sampling distribution model decreases by the square root of the sample size... e.g. quadruple the sample size -> standard deviation cut in half
26
New cards
Large Enough Sample Condition
A "large enough" sample size is necessary to ensure the CLT "kicks in" (Success/Failure Condition for proportions; n ≥ 30 often sufficient for means if data is not severely skewed)