ISA365 Final Exam
0.0(0)
Studied by 3 peopleCard Sorting
1/80
Earn XP
Description and Tags
Last updated 9:44 PM on 5/10/23
Name | Mastery | Learn | Test | Matching | Spaced | Call with Kai | Chat |
|---|
No analytics yet
Send a link to your students to track their progress
81 Terms
1
New cards
What is the standard error of a statistic?
the standard deviation of a sampling distribution
2
New cards
How is the standard error of a statistic calculated?
sd(means)
3
New cards
What is the basic interpretation of a confidence interval?
“I am 95% confident that the **true** mean lies within the given interval”
4
New cards
How does a confidence interval relate to the precision and uncertainty of a statistical estimate?
A confidence interval is a range of values that is likely to contain the true population parameter with a certain level of confidence. The precision of a statistical estimate is related to the width of the confidence interval, with a narrower interval indicating greater precision. The uncertainty of a statistical estimate is related to the level of confidence chosen for the interval, with a higher confidence level indicating greater uncertainty as the interval will be wider.
5
New cards
What are the basic variable types in R?
numeric, integer, factor, and character
6
New cards
How is a numeric variable defined in R?
data that consists of only numbers, like decimals, whole numbers, positive or negative
7
New cards
How is an integer variable defined in R?
data that consists of only whole numbers
8
New cards
How is a factor variable defined in R?
In R, a factor variable is defined as a categorical variable that can take on a limited set of values, known as levels. It is created using the `factor()` function, which takes a vector of categorical values and converts it into a factor variable. For example, the following code creates a factor variable called "gender" with two levels, "male" and "female":
```
gender <- factor(c("male", "female", "male", "male", "female"))
```
Once created, factor variables can be used in statistical analyses and visualizations to explore relationships between categorical variables.
```
gender <- factor(c("male", "female", "male", "male", "female"))
```
Once created, factor variables can be used in statistical analyses and visualizations to explore relationships between categorical variables.
9
New cards
How is a character variable defined in R?
data that consists of letters/words
10
New cards
What is the difference between observational and experimental data?
Observational data comes from observing certain variables and trying to determine if there is any correlation, while experimental data is where you control certain variables and try to determine if there is any causality
11
New cards
How do observational and experimental data differ in terms of study design?
The key difference between observational studies and experimental designs is that a well-done observational study does not influence the responses of participants, while experiments do have some sort of treatment condition applied to at least some participants by random assignment
12
New cards
What are the advantages of observational data?
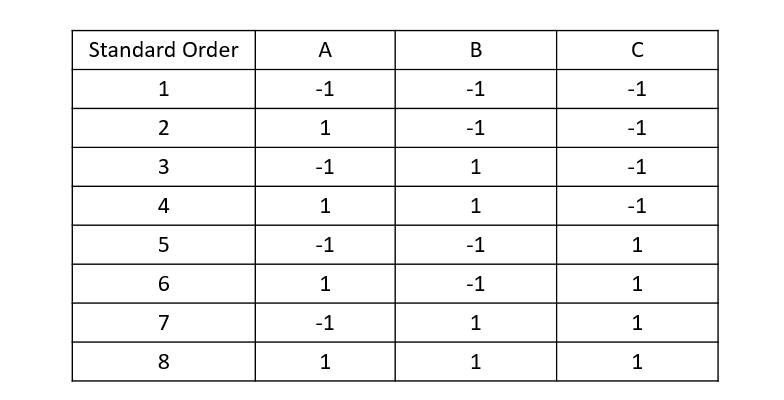
relatively quick, inexpensive, and easy to undertake
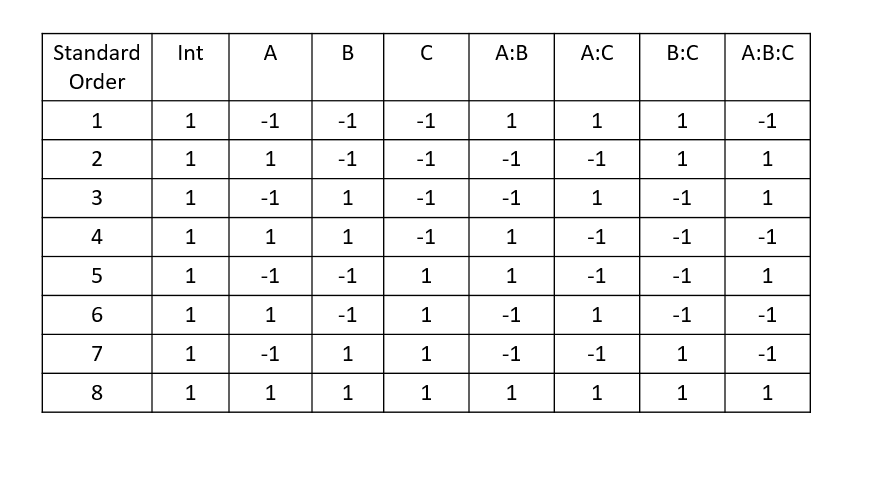
13
New cards
What are the disadvantages of observational data?
can be susceptible to other types of bias
14
New cards
What are the advantages of experimental data?
researchers have control over variables to obtain results, the subject does not impact the effectiveness of the research, results are specific
15
New cards
What are the disadvantages of experimental data?
time-consuming process, not all situations can be created in an experiment, expensive
16
New cards
What are the main challenges of establishing causality with observational data?
lurking variables
17
New cards
What is a common sources of bias that can impact observational studies?
sample selection bias - anytime that selection into a sample depends on the value of the dependent variable
18
New cards
What are the "Big Three" criteria for establishing causality?
1. When X changed, Y also changed. If X changes and Y doesn't change, then we cannot assert that X causes Y.
2. X happened before Y. If X happens after Y then X cannot cause Y.
3. Nothing else besides X changed systematically.
19
New cards
What is the treatment in an experiment?
what is randomly assigned to each subject
20
New cards
What is the response in an experiment?
what is measured
21
New cards
How can confidence intervals be used to compare group averages in statistical analysis?
Check if 0 is contained in the confidence interval. If it is, than there is no significant difference between group averages. If not, we can conclude which treatment produces a better response
22
New cards
What is the process for calculating confidence intervals for group means?
t.test(df$response \~ df$treatment)
23
New cards
How can confidence intervals be used to compare group proportions in statistical analysis?
Check if 0 is contained in the confidence interval. If it is, than there no significant difference between the proportion of responses. If not, we can conclude there is a difference between the treatments
24
New cards
What is the process for calculating confidence intervals for group proportions?
prop.test(x=c(# of yes1, # of yes2), n=c(n1, n2))
25
New cards
What is power?
the probability that we will not make a type 2 error (1-B); the probability that we will detect a difference when there actually is one
26
New cards
When can a type 1 error occur?
if the null hypothesis is true
27
New cards
When can a type 2 error occur?
if the null hypothesis is false
28
New cards
What is the power calculation for a test of means?
power.t.test(n, delta, sd, sig.level)
29
New cards
How is power used in statistical analysis to determine the sample size needed for a given study?
power.t.test(power, sig.level, delta, sd, n=NULL)
30
New cards
What is the power calculation for a test of proportions?
power.prop.test(n, p1, p2, sig.level)
31
New cards
What is the difference between p1 and p2?
The difference we are looking to detect between the proportions
32
New cards
What happens to power when effect size increases?
Power increases
33
New cards
What happens to power as standard deviation increases?
Power decreases
34
New cards
What happens to power as the alpha (significance) level increases?
Power decreases
35
New cards
How can you increase power?
increase sample size
36
New cards
What is the beta-binomial model?
an alternative way to assess our uncertainty about the sample proportion
37
New cards
How can the beta-binomial model be used to compare two proportions in statistical analysis?
Running 100,000 iterations using the number of successes and failures +1, the output indicates the % chance that the true success rate for one is greater than the other in the long run
38
New cards
What are the two forms of randomness that are critical to ensuring valid statistical results from an experiment?
1. Take a random sample
2. Randomly assign treatments to units in that sample
39
New cards
What factors should be considered when deciding to utilize an analysis of variance (ANOVA) for the analysis of A/B/n tests in experimental studies?
If we are analyzing means
If the response variable is numeric, or continuous
If the response variable is numeric, or continuous
40
New cards
What are the criteria for determining the appropriate use of a chi-square test for analyzing A/B/n tests in experimental studies?
If we are analyzing proportions
41
New cards
Why is the Tukey HSD (Honestly Significant Difference) test necessary for comparing all pairs of treatment groups in statistical analysis?
The test compares each treatment mean with all of the other treatment means. At the same time, it controls the type 1 error rate
42
New cards
What are the key considerations when applying the Tukey HSD test?
It is used when the p-value of an anova test is significant to determine which of the treatments are different from the others
43
New cards
\
What is a covariate?
What is a covariate?
a measurement on an experimental unit that is not controlled by the experimenter
44
New cards
Are covariates ever randomized?
No, because they are not part of the experiment
45
New cards
How do causality and covariates connect?
Causality cannot be applied to a covariate because the treatment is not randomized
46
New cards
What happens when the number of subgroup analyses performed increases?
The probability of a Type 1 error increases
47
New cards
If we have 15 covariates, what is the probability of making at least one type 1 error? Assume alpha=0.05
1-.95^15 = .5367
48
New cards
What is Simpson's Paradox?
a phenomena where the results of an analysis of aggregated data are the reverse of subgroup results
49
New cards
What must happen for Simpson’s Paradox to occur?
1. The subgroup need to be different sizes
2. There exists a lurking variable that is related to both the treatment and the response
50
New cards
What is a blocking variable?
a categorical variable that explains some of the variation in the response variable
51
New cards
What makes a RCBD?
each treatment appears within each block; they are balanced designs in that each treatment appears the same number of times each block, once
52
New cards
Describe a Latin Squares Design
each treatment appears exactly in one row and each column; the rows and columns each represent a blocking factor; the treatment is represented in the square
53
New cards
What is special about Latin Squares Designs?
They create orthogonal data, which means the estimates from the design will be unbiased
54
New cards
How to analyze a LSD?
run anova, check if treatment has a significant p-value
55
New cards
How does replication impact MSE?
it produces a better estimate of MSE by providing more degrees of freedom
56
New cards
In an ANOVA analysis, why would I be concerned with having a good estimate of the Mean Squared Error?
It is the yardstick against which we measure all of our effects
57
New cards
What are the two ways to execute a Latin squares design with replication?
1. All experimental runs are carried out at once
2. One set is carried out at one time/location, time, etc. And then the next set
58
New cards
What is the significance of orthogonality in factorial designs?
It ensures that a change in Factor A implies a change in y and nothing else is changing that would change y; it is the best structure for isolating effects
59
New cards
What is the main effect of a factor?
the average change in the response due to a change in the factor
60
New cards
How to calculate a main effect by hand in a factorial design?
Hand written notes
61
New cards
What is an interaction?
The effect of A on the response depends on the level of factor B
62
New cards
When can you not perform any inference in a factorial experiment?
when you have only one observation at each treatment combination = no way to estimate the experimental error
63
New cards
How can you ensure you can perform inference on a factorial experiment?
replication
64
New cards
What are the assumptions for a valid regression model?
1. The probability distribution of epsilon should have constant variance for all values of y
2. The probability distribution of epsilon is normally distributed
3. Any two values from the probability distribution of epsilon are indepenent
4. The mean value is 0
65
New cards
What plots should be viewed when checking the assumptions?
1. Plot the residuals vs. y^. (predicted values)
2. Plot the residuals vs. run order.
3. Create a normal probability plot of the residuals.
4. Identify outliers
66
New cards
What is the procedure for analyzing a two-level factorial design without replicates using a half normal plot?
Hand written notes
67
New cards
What does a design matrix show?
The specific treatment combinations
68
New cards
What does a model matrix used for?
shows all the columns that will get estimates in the model
69
New cards
What are the estimable effects that can be listed from a 2^k factorial experiment?
As the number of factors increases the number of available interactions to estimate also increases. For example if you have three factors A, B and C and they are varied each at two levels you can estimate the following effects: A, B, C are the main effects, AB, AC, BC are all two-way interactions, ABC is a three-way interaction
70
New cards
What is the problem with a design that has no replication?
No replication = no inference because there are no df left over to estimate the error in the model
71
New cards
What kind of model has no d.f. left over?
A 2^2 factorial with no replication
72
New cards
When looking at a Half Normal plot, do we care about the points on or off the line?
Off
73
New cards
What should be checked after making a model following a half-normal plot (no replication)
1. plot(reg$residuals, reg$fitted.values) #check for a pattern
2. plot(reg$residuals) # check for a trend
3. qqnorm(reg$residuals) qqline(reg$residuals) # check for normality
74
New cards
What should a rate response actually be analyzed with?
a logistic regression model
75
New cards
What is a confirmation run?
a test to confirm the rate you expect based on the optimal conditions
76
New cards
What are the fundamental principles and concepts of the Six Sigma Project Management Philosophy?
The philosophical perspective of Six Sigma views all work as processes that can be defined, measured, analyzed, improved, and controlled. Processes require inputs (x) and produce outputs (y). If you control the inputs, you will control the outputs. This is generally expressed as y = f(x).
77
New cards
What does DMAIC stand for in the context of the Six Sigma Project Management Philosophy?
* D=Define
* M=Measure
* A=Analyze
* I=Improve
* C=Control
* M=Measure
* A=Analyze
* I=Improve
* C=Control
78
New cards
What is the distinction between common cause variation and assignable cause variation in the context of process variation analysis?
In many processes, regardless of how well-designed they are or carefully maintained, a certain amount of inherent or natural variability will always exist. We refer to this natural or background or random variability as **Common Cause Variation**.
A process that is in operation with only common cause variation present is said to be operating in statistical control or **in control**.
Other kinds of variability may occasionally be present in the process. A measurement could be wrong or the temperature might be off, etc.
This type of variation is typically large when compared to the background variation and typically represents an unacceptable level of process performance. We refer to these sources of variation as **Assignable Cause Variation.** A process that is operating the presence of assignable cause variation is said to be **out of control**.
79
New cards
What is the fundamental framework of a control chart, and how does it contribute to the analysis and management of process control?
A typical control chart plots the quality characteristic over time.
* Center line (CL) = average value of the quality characteristic
* Upper Control Limit (UCL)
* Lower Control Limit (LCL)
The UCL and LCL are chosen such that if the process is in control nearly all of the sample points will fall between the control limits
* Center line (CL) = average value of the quality characteristic
* Upper Control Limit (UCL)
* Lower Control Limit (LCL)
The UCL and LCL are chosen such that if the process is in control nearly all of the sample points will fall between the control limits
80
New cards
What are the fundamental concepts and applications of Xbar and R-charts in statistical process control?
Xbar chart - captures **between** subgroup variability
R-chart - captures **within** subgroup variability; the center line is the average range
R-chart - captures **within** subgroup variability; the center line is the average range
81
New cards
How can you effectively assess Xbar and R-charts to identify and analyze assignable causes in statistical process control?
Both charts have to be in control for the process to be in control. If either chart is out of control then there are assignable causes present