Lesson 3: Graphic Organizers
1/22
There's no tags or description
Looks like no tags are added yet.
Name | Mastery | Learn | Test | Matching | Spaced |
|---|
No study sessions yet.
23 Terms
Identify the type of graphic organizer
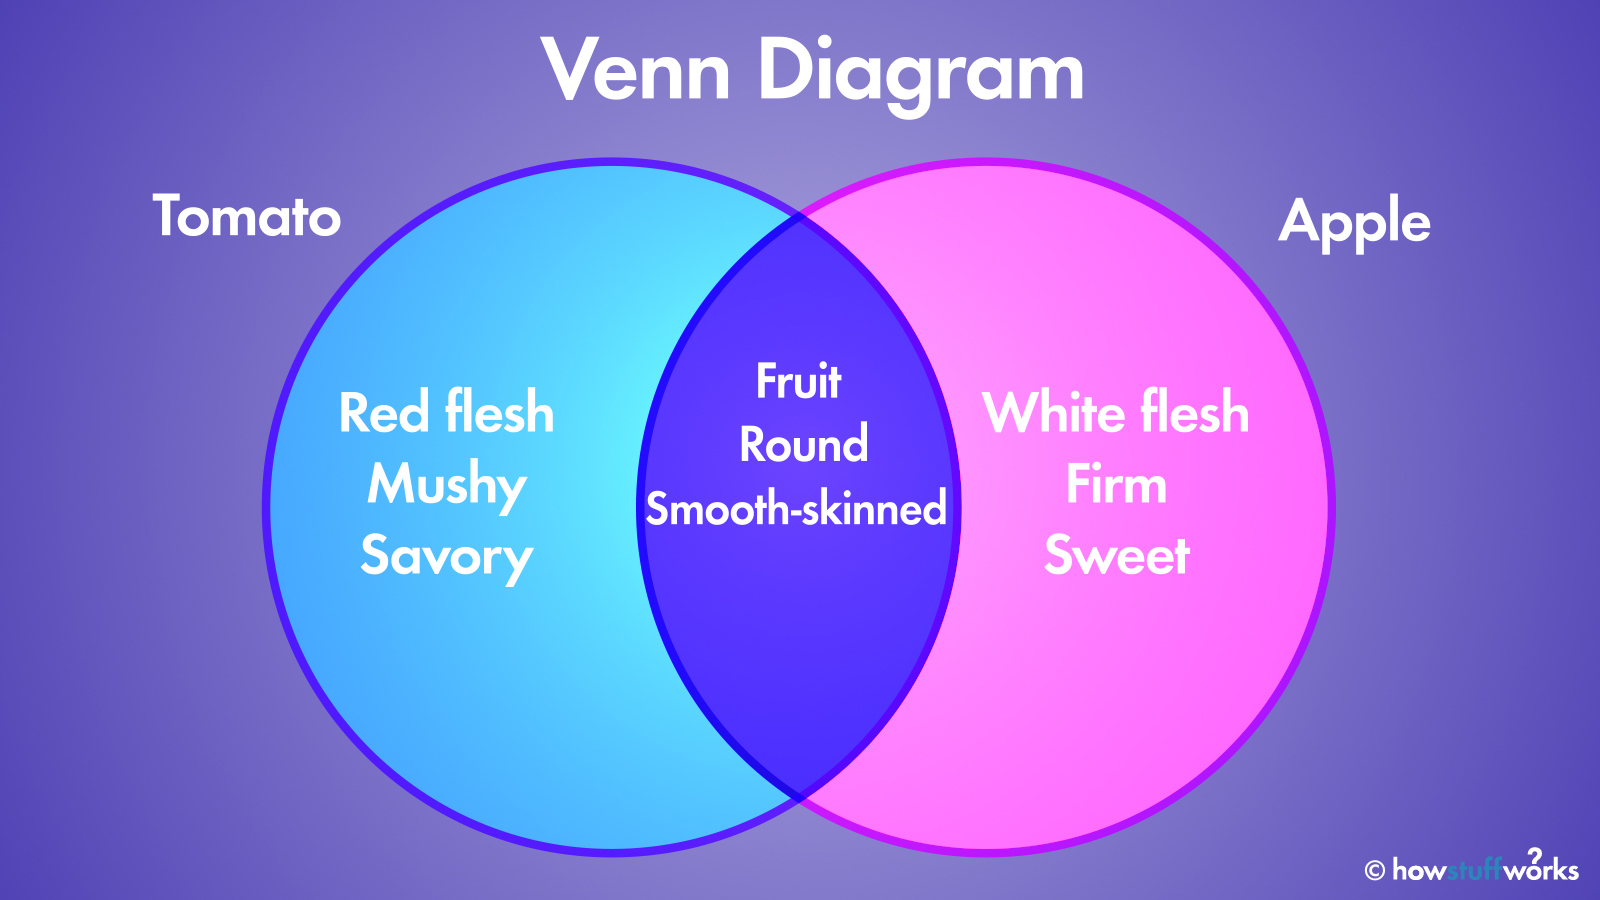
Venn Diagram
Identify the type of graphic organizer
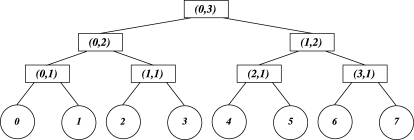
Network Tree
Identify the type of graphic organizer
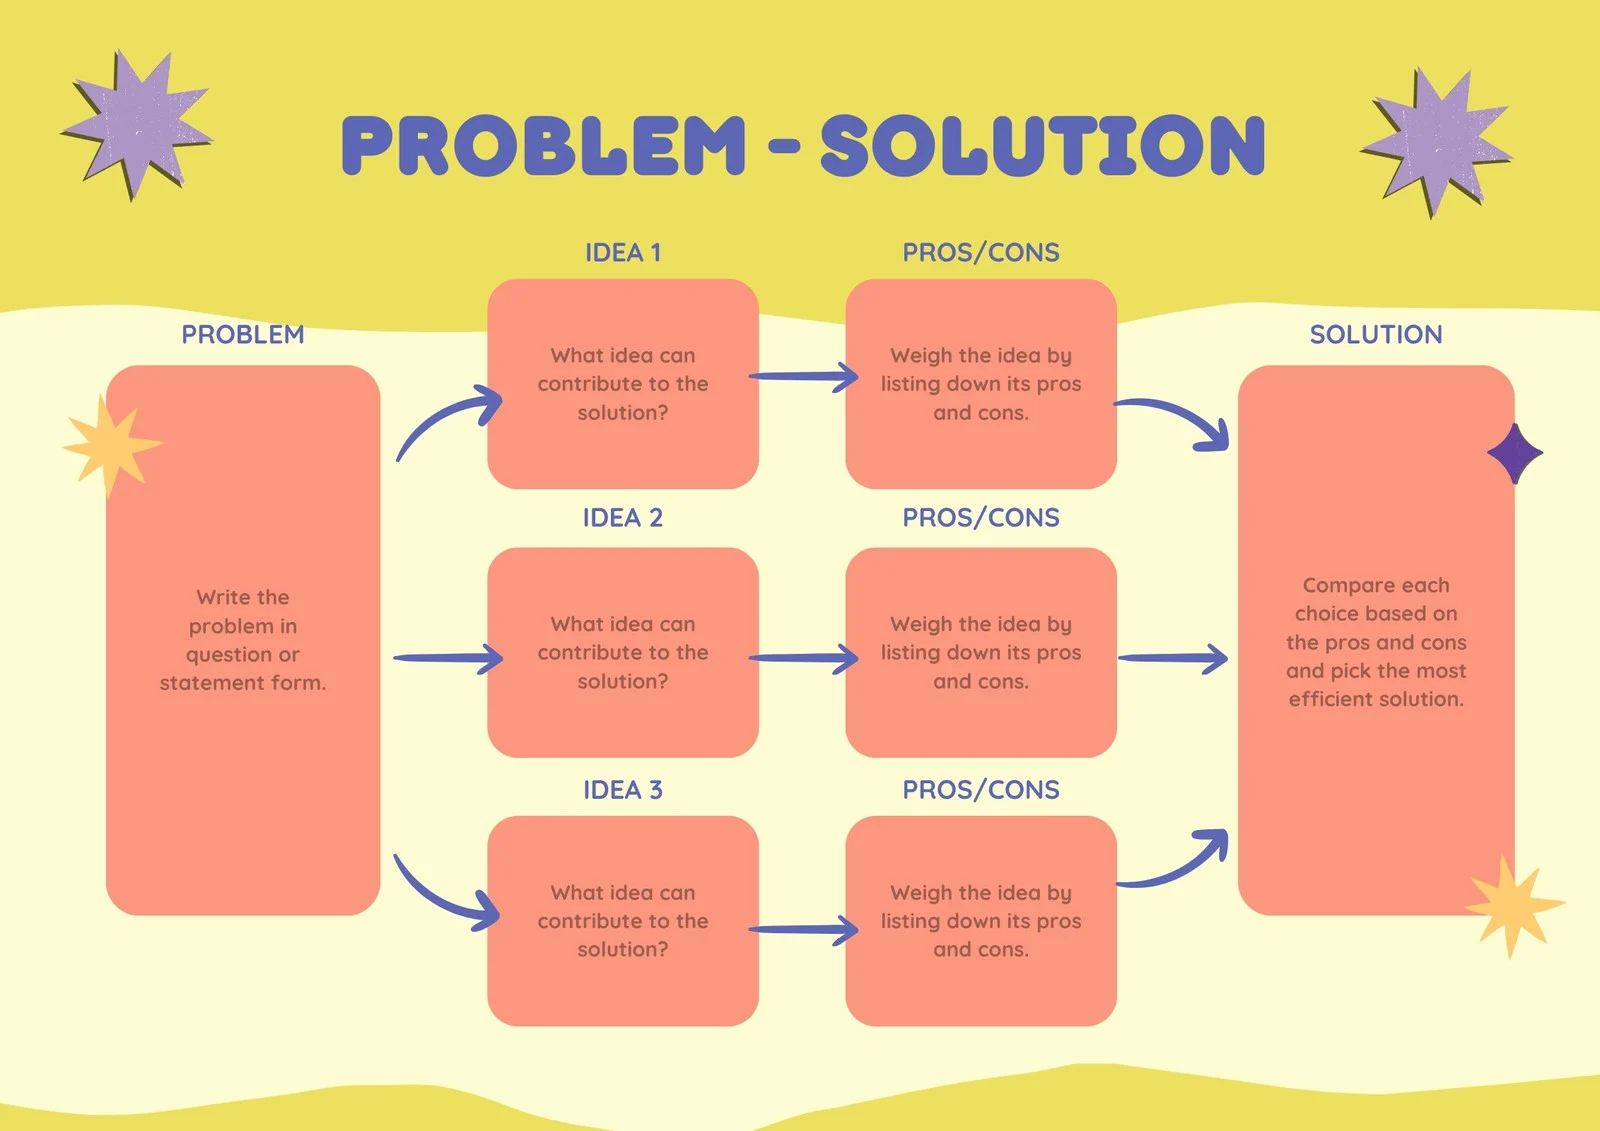
Problem-Solution Map
Identify the type of graphic organizer
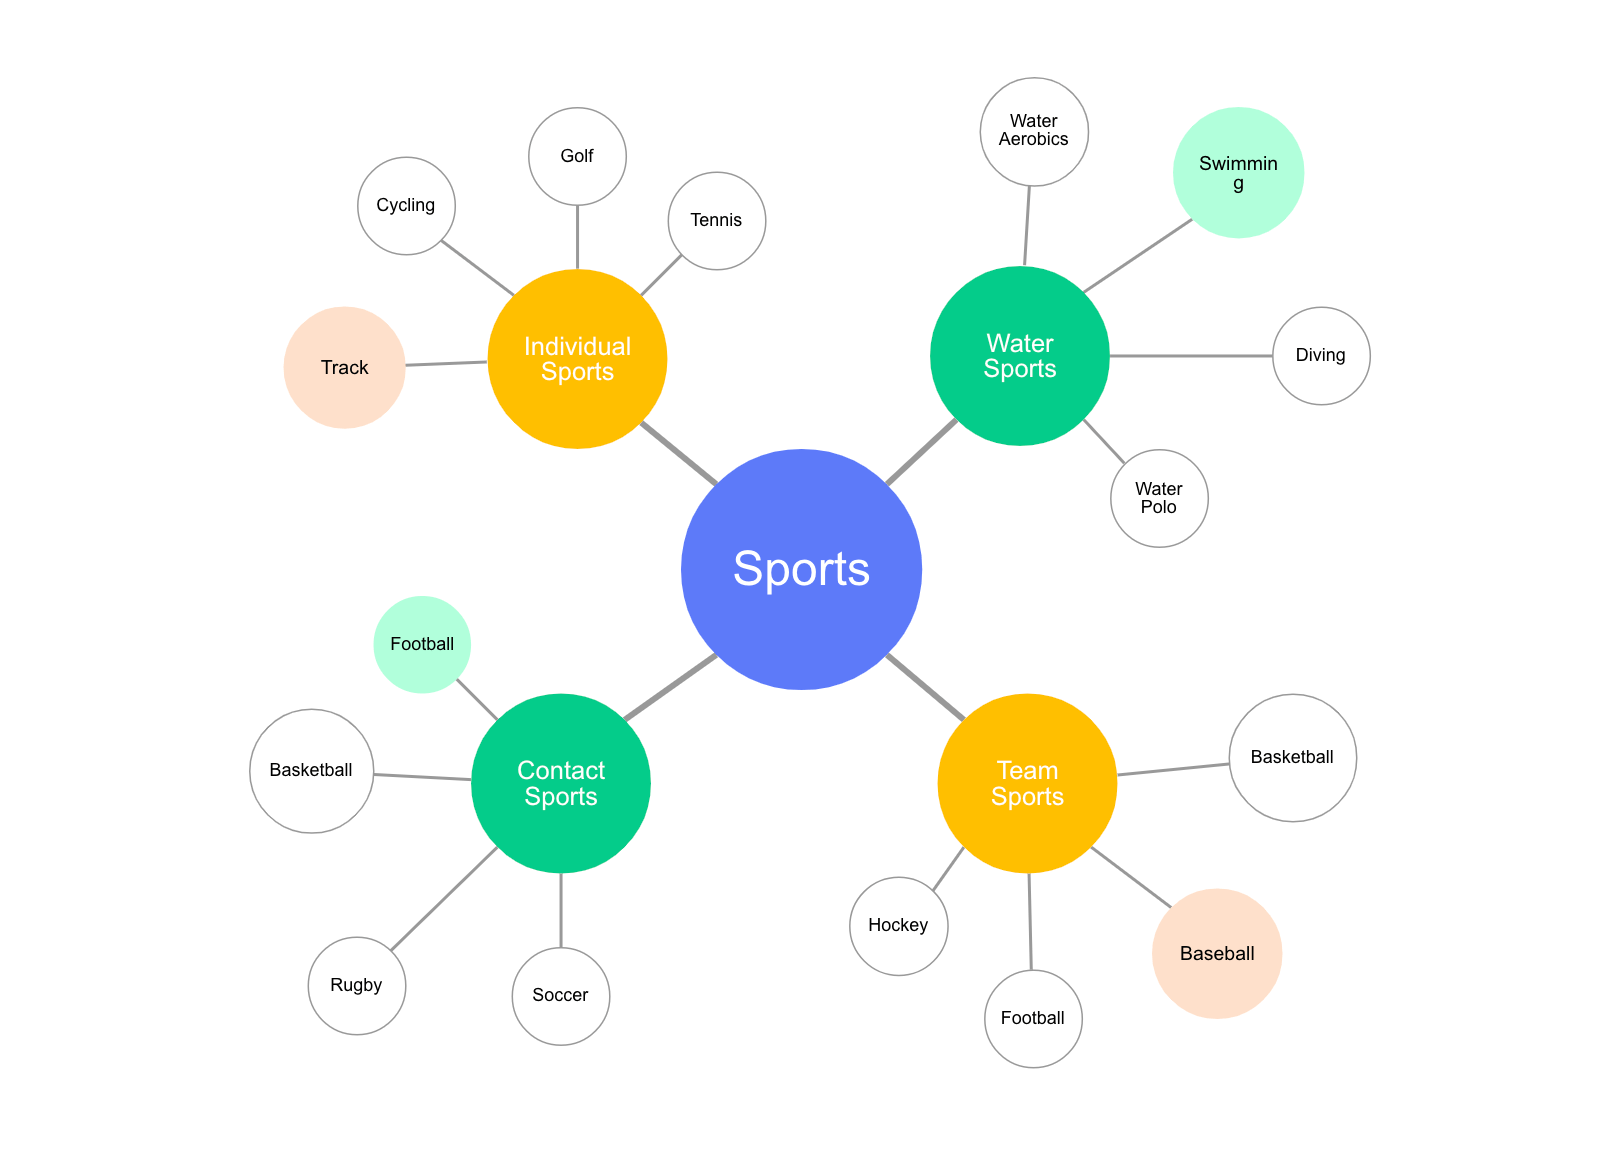
Spider Map
Identify the type of graphic organizer
Comparative Timeline
Identify the type of graphic organizer
Linear Timeline
Identify the type of graphic organizer
Plot Diagram
Identify the type of graphic organizer
Series of Events Chain
Identify the type of graphic organizer
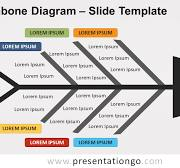
Fishbone Map
Identify the type of graphic organizer
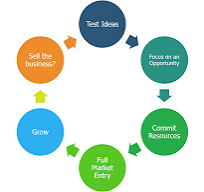
Cycle

Identify the type of graphic organizer
Persuasion Map
This is used to compare and contrast ideas and events.
Venn Diagram
This is used to represent the hierarchy, classification, and branching. It is useful in showing relationship of scientific categories, family trees, and even lineages.
Network Tree
Also known as semantic map. This is used to investigate and enumerate various aspects of a central idea, which could be a concept, topic or theme
Spider Map
This is used to display the nature of the problem and how it can be solved. It is usually contains the problem description, its causes and effects, and logical solutions
Problem-Solution Map
This is used to show the chronological order of events through a long bar labeled with dates and specific events. It can be linear or comparative
Timeline
It shows events that happened within a period of time.
Linear Timeline
It shows two sets of events that happened within the same period of time.
Comparative Timeline
This is used to map events in a story, making it easier to analyze the major parts of the plot.
Plot Diagram
This is used to show the logical sequence of events.
Series of Events Chain
This is used to better understand the causal relationship of a complex phenomenon. It shows the factors that cause a specific event or problem, as well as details each cause.
Fishbone Map
This is used to describe how a series of events interact to produce a set of results repeatedly.
Cycle
This is used to map out arguments and evidence that prove a viewpoint. It is useful when processing persuasive or argumentative texts.
Persuasion Map