econ unit 13 ch. 17
1/43
There's no tags or description
Looks like no tags are added yet.
Name | Mastery | Learn | Test | Matching | Spaced |
|---|
No study sessions yet.
44 Terms
Chapter 17 — Markets for Factors of Production
Describe the anatomy of ___ markets
Explain how the value of marginal product (VMP) determines the demand for a factor of production
Explain how wage rates and employment are determined & the role of labour unions
Explain how rental rates for capital and land, and natural resource prices, are determined
factor
The Anatomy of Factor Markets
Factor markets allocate the four factors of production:
__ – human physical & mental effort
___ – tools, machinery, buildings used to produce goods/services
___ (Natural Resources) – gifts of nature (land, minerals, oil, water)
___ – organization, ____, and risk-taking
These factors are ____ in the production process. Their __ are determined in __ markets.
labor, capital, land, entrepreneurship, organization, inputs, prices, factor
1. Markets for Labour Services
Labour = physical and ___ effort supplied to produce goods & services.
Labour market = people and firms trading ___ services.
Price of labour = ___ rate.
Types of Labour
Casual labour: hired __-by-day (fruit pickers).
Contract labour: ___ job contracts (most labour).
mental, labor, wage, day, long-term
Competitive Labour Markets
Many buyers (firms) and sellers (workers)
No one controls the wage → wage rate determined by supply & demand
Higher demand → more jobs
Lower demand → job losses
Labour Unions
Act like a ___ on the ___ side.
Wage rate determined through collective ___ between union & employer.
Can negotiate higher wages but sometimes reduce employment.
monopoly, supply, bargaining
2. Markets for Capital Services
Capital goods = produced goods used to produce ___ goods (machines, buildings, tools).
Capital goods themselves are traded in goods markets (market for dump trucks).
Capital Services
The ___ of capital is traded in ___ markets.
Rental rate = price for ___ capital (renting a ___ or truck from U-Haul).
Implicit Rental Rate
Most firms own their capital
Even then, using capital has a cost:
__
____cost (__ of tying up funds)
These make up the __ rental rate of capital → the price the firm “pays itself” for using its own capital.
other, use, rental, hiring, car, depreciation, interest, OC, implicit
3. Markets for Land Services & Natural Resources
Land - Includes all natural resources (land surface, water, minerals, forests).
____ Rate of Land - The price for the use of land
Renewable vs. Nonrenewable Resources
Renewable (can be used repeatedly) - farmland, forests (if replanted), water
Nonrenewable (can only be used once):
Oil
Natural gas
Coal
Commodity Prices
Prices of ___ resources are determined in global commodity markets.
These prices fluctuate with global supply & demand.
rental, nonrenewable
4. Entrepreneurship
Entrepreneurial services ___ traded in markets.
Entrepreneurs earn ___ or take on losses based on their business decisions.
Profit is the “___” of entrepreneurship.
aren’t, profit, price
1. What are the factors of production and their prices?
Labour → Wage rate
Capital → ___ rate (implicit or explicit)
Land (natural resources) → Rental rate or ___ price
Entrepreneurship → Profit (or loss)
rental, commodity
2. What is the distinction between capital and the services of capital?
Capital = physical objects used in production (machinery, buildings, equipment).
Services of capital = the productive __ of that equipment (hours of machine operation).
use
3. What is the distinction between the price of capital equipment and the rental rate of capital?
Price of __ equipment = the purchase price of the physical good (buying a truck).
Rental rate of capital = the price of using the equipment for a period (renting a truck for a day).
capital
Chapter 17 — The Demand for a Factor of Production
Key Idea - The demand for any factor of production (labour, capital, land) is a derived demand.
Derived Demand
A firm demands a factor because it needs it to produce ___.
Demand for factors comes from demand for the goods/services produced.
output
How Firms Decide How Much Labour to Hire
A firm hires labour based on a comparison between:
Cost of hiring one more worker → ___ rate
Value to the firm of hiring one more worker → Value of ___ Product (VMP)
A profit-maximizing firm hires a factor only if ____ ≥ __ price.
wage, marginal, VMP, factor
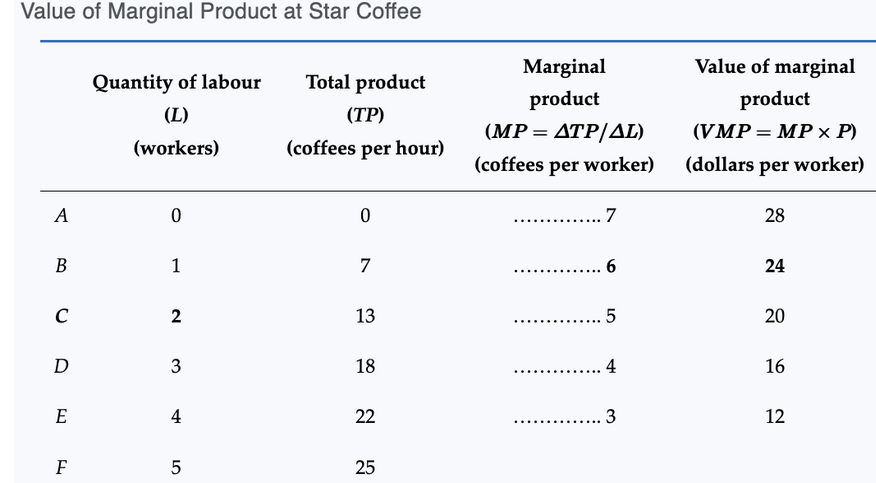
Value of Marginal Product (VMP)
The value of marginal product is the value of the output produced by one more ___ of a factor.
VMP = ___ of Output × __ Product (MP)
Star Coffee
Price of coffee = $4 per cup
MP of 2nd worker = 6 cups/hour
VMP of 2nd worker = 6 × 4 = $24
Interpretation: Hiring the second worker adds $24 of revenue per hour.
unit, price, marginal
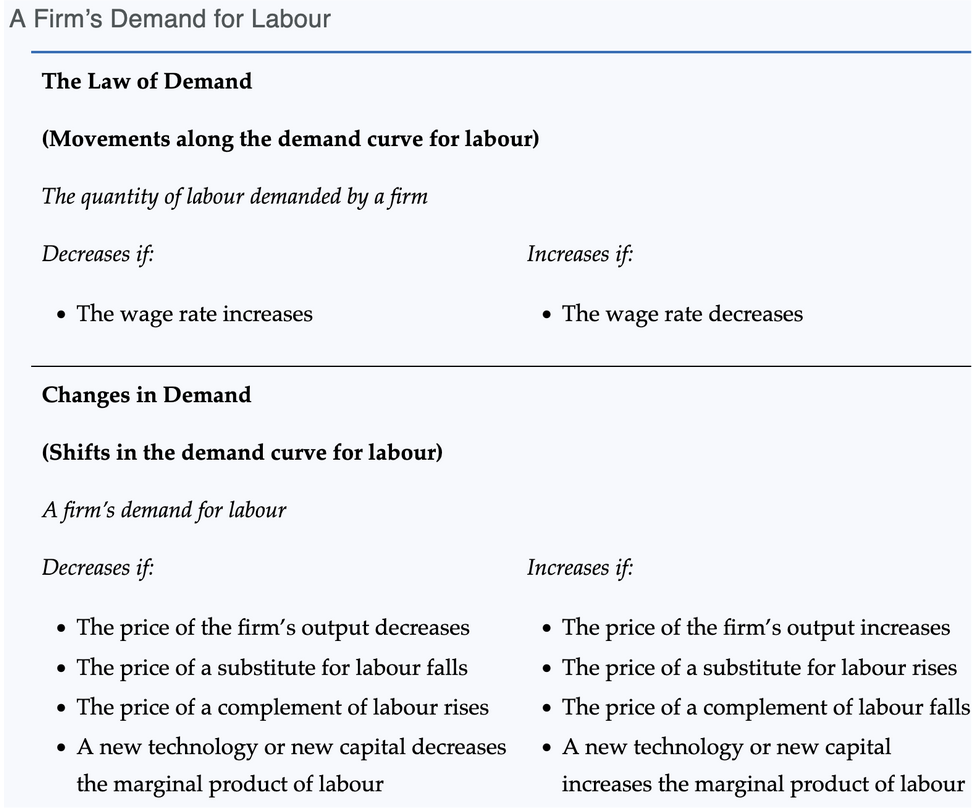
A Firm’s Demand for Labour
The Core Rule - A firm maximizes profit by hiring workers up to the point where: __ = Wage Rate
If VMP > wage, __ more workers increases profit.
If VMP < wage, firing workers increases profit.
If VMP = wage, profit is maximized → optimal quantity of labour.
Decreasing VMP
VMP falls as more workers are hired because ___ diminishes.
This makes the demand for labour downward sloping.
VMP, hiring, MP
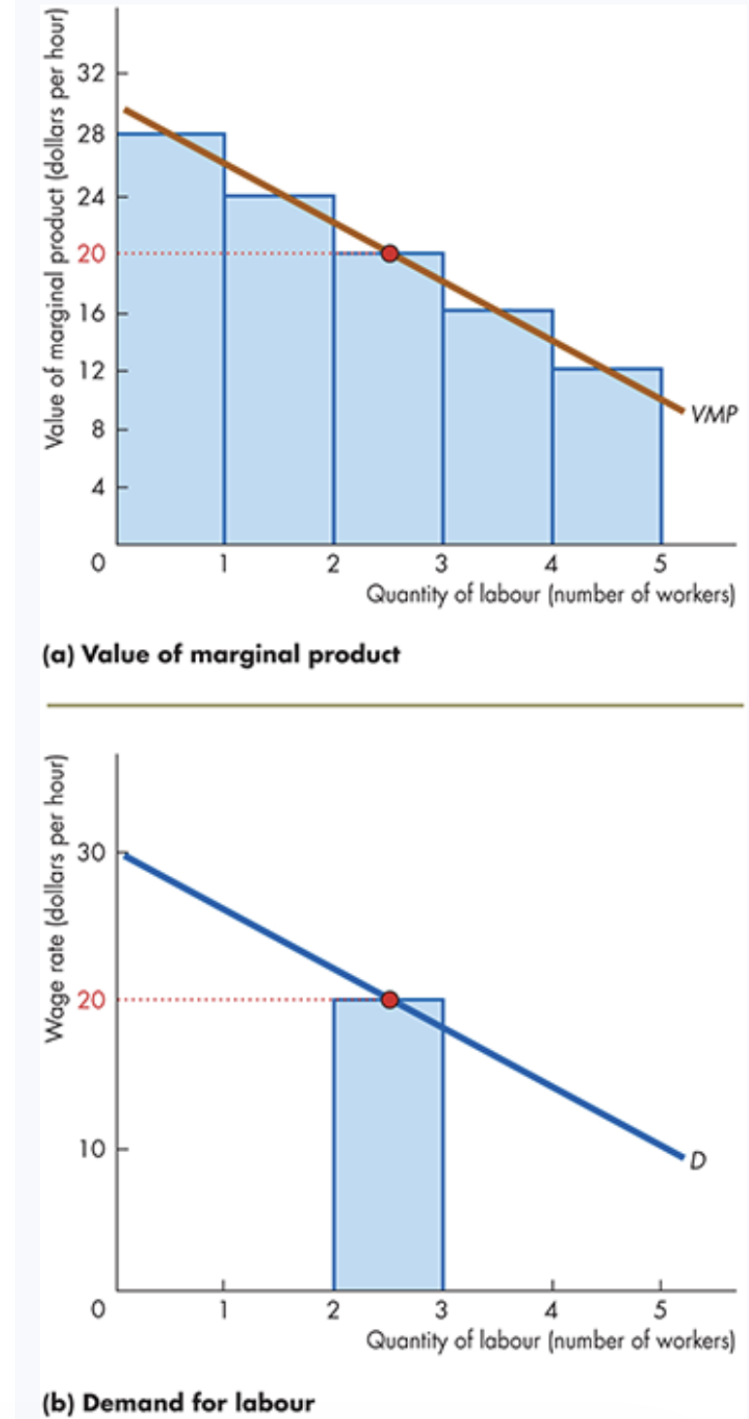
A Firm’s Demand for Labour Curve
How It’s Derived
The VMP curve becomes the firm’s ____ for labour curve.
Shows how many workers the firm hires at different wage rates.
Star Coffee
If wage = $20/hour:
Worker 2: VMP = $24 → hire
Worker 3: VMP = $20 → hire
Worker 4: VMP = $16 → __ hire
Quantity of labour demanded = 3 workers.
Movement versus Shift
Change in ____ rate → __ along the demand curve
Change in anything else → shift of the entire demand curve
demand, don’t, wage, movement
What Shifts a Firm’s Demand for Labour?
A firm’s labour demand depends on:
1. Price of the Firm’s Output
Higher output price → higher ___ → demand for labour __ (shifts right)
Lower output price → lower VMP → demand decreases
If coffee price rises to $6:
VMP of the 4th worker increases from $16 → $24
At wage = $20, the firm now hires 4 workers instead of 3
VMP, increases

2. Prices of Other Factors of Production
If capital becomes cheaper:
The firm may substitute ___ for labour → demand for labour decreases
But if cheaper capital expands production enough, labour demand may increase
Short run: Usually labour __
Long run: Could be ↑ or ↓ depending on scale effects
capital, decreases
3. Technology
____technology → demand for certain labour types ↓
Labour-using/____ technology → demand ↑
Self-serve coffee machines reduce demand for baristas.
Growth of online shopping reduces demand for store clerks but increases demand for:
warehouse workers
delivery drivers
software engineers
website designers
labour-saving, skill-complementing
Factor | Effect on Labour Demand |
Price of output | ↑ price → ↑ VMP → demand shifts ___ |
Price of capital or other inputs | Cheaper capital → usually ↓ labour demand; but may ↑ if scale increases |
_ | Can increase or decrease depending on whether labour is replaced or complemented |
right, tech

1. What is the value of marginal product of labour? The value of the output produced by one additional worker; VMP = __ × __
Price of Output, Marginal Product

2. Relationship between VMP and marginal product?
Marginal product reflects ___ output added by an ___ worker.
VMP converts marginal product into ___ value using the price of output.
physical, extra, dollar
3. How is the firm’s demand for labour derived from VMP?
The VMP curve shows the value of each additional __.
The firm hires workers until VMP = wage.
Thus, the downward-sloping VMP curve becomes the demand for labour curve.
worker
4. What influences the demand for labour?
Price of the firm’s output
Prices of ____ factors (__)
Technology changes
other, capital
Chapter 17 — Labour Markets (Detailed Notes)
1. Overview of Labour Markets
Labour services are traded in many different labour markets, varying by scope:
___ markets (coffee shop workers, bakers)
____ markets (air traffic controllers, nurses)
___ markets (superstar athletes)
Labour markets determine:
Wage rates
___ levels
How unions or market power influence __
local national global employment wages
2. Competitive Labour Market
A competitive labour market has:
Many firms demanding labour
Many ___ supplying labour
No single buyer or seller can influence the wage
Wage and employment are determined by market supply & demand
households
2A. Market Demand for Labour
Derived from ___ firms’ demand for labour.
A firm hires workers up to the point where: Wage = Value of Marginal Product (VMP).
Because each firm’s demand curve slopes downward, the market demand curve also slopes downward.
individual

2B. Market Supply of Labour
Derived from households’ decisions on labour vs. leisure.
___ Wage
____ wage at which a worker is willing to work.
Evan’s reservation wage = $10/hour.
Below $10 → Evan supplies no labour.
Above $10 → he supplies labour.
reservation, minimum
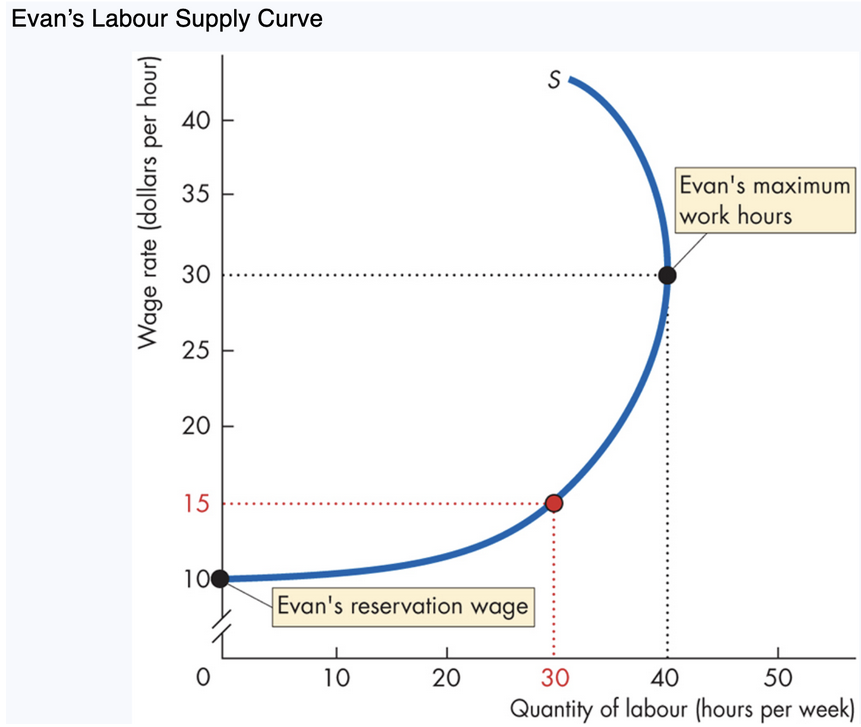
Labour Supply Curve (Individual)
At first slopes upward: as wage ↑, labour supplied ↑.
Eventually ___ backward: After $30/hour, Evan prefers more leisure, so he works fewer hours.
Why backward?
Substitution Effect
Higher wage = higher opportunity cost of leisure
Worker substitutes leisure → labour
Labour supplied increases
Income Effect
Higher wage = higher income
Workers “buy” more leisure
Labour supplied decreases
When ___ effect > __ effect → curve bends backward
bends, income, substitution

Market Labour Supply Curve
Always upward sloping
Many households with different reservation wages
Higher wages attract more __, not more hours
workers
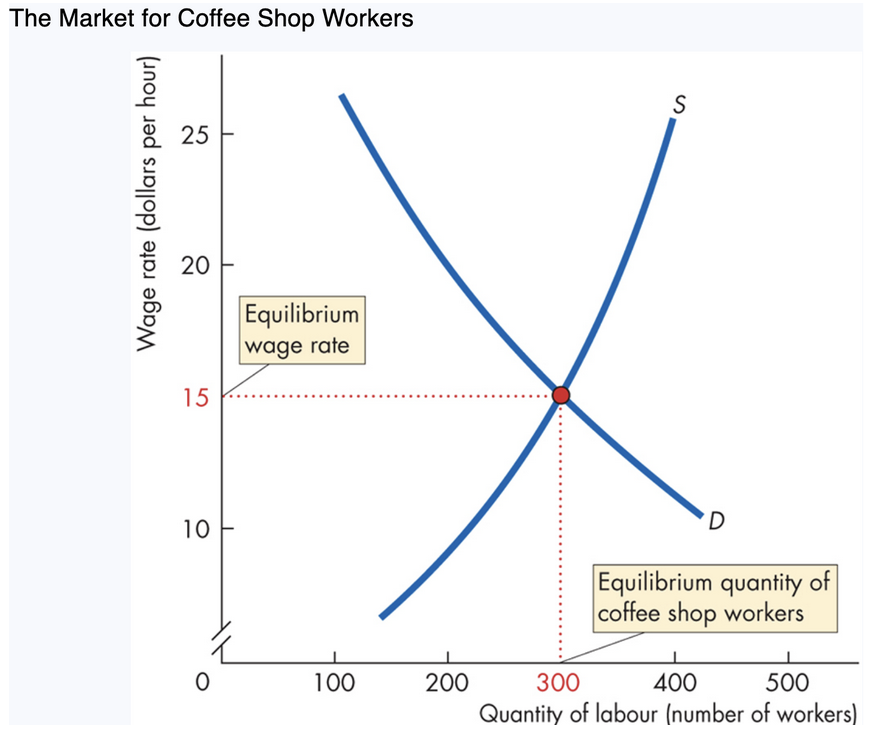
3. Labour Market Equilibrium
When supply (S) meets demand (D):
Equilibrium wage: where quantity supplied = quantity demanded
Coffee shop workers: Wage: $15/hour
Employment: 300 workers
How market fixes disequilibrium
Wage > $15 → surplus of workers → wage ____
Wage < $15 → shortage → wage rises
Only at $15 are there no forces pushing wage up/down
falls
4. Wage Differences + Trends in Canada
Average wage: $32.06/hour
Reasons wage rates differ across occupations
Differences in VMP (__/productivity)
Differences in training or ability
Scarcity of workers in high-skill jobs
Some occupations experience more market power
Why wages rise over time
Technological change → workers become more __ → ↑ VMP → ↑ labour demand
Education & experience increase VMP
Even jobs with ___ physical output (childcare) can experience rising VMP due to high-income parents ___ more.
skills, productive, fixed, WTP
5. Wage Inequality Rising
Technology
Increases productivity of high-skilled workers (↑ wages)
Eliminates low-skill jobs (↓ wages)
ATMs reduced bank teller jobs
Computerization increased programmer wages
Globalization
More global __ for low-skill workers
More global opportunities for high-skill workers
competition
6. Gender Pay Gap — Explanation
Hours worked differ - Men average 40 hrs, women 35.4 hrs
___ choices
Women → more arts degrees
Men → more STEM degrees (higher paying)
Marriage & children
Women take on more parenting → reduces career time
Study (never-married men vs women) → no wage gap
Possible ___ - After adjusting for all factors → 0–5% wage difference
educational, discrimination
Why gap narrowed historically?
More women entering high-paying fields
More equal division of parenting duties
Why it widened in 2022?
COVID harmed women’s employment more
Effects lingered into 2022
Is this a new trend?
Unlikely.
Earnings in __-dominated sectors started rising faster as the economy reopened in 2023.
female
7. Labour Unions
A labour __ is an organized group of workers aiming to:
Increase wage rates
Improve working conditions
How unions influence supply
Restrict ___ (apprenticeships, certification)
Only effective in markets where entry is ___ (doctors, electricians)
Ineffective where large nonunion labour ___ exist (farm labour)
Tradeoff
Labour demand is downward sloping
Higher wages → fewer jobs
Unions must also try to raise __ for union labour.
union, entry, limited, supplies, demand
Union Methods to Increase Labour Demand
Increase VMP
___ programs
Certification
Lobbying for ___ restrictions - Protect domestic union jobs
Support minimum wage laws - Makes low-skilled labour more expensive → firms hire higher-skilled union workers
Lobby for ___ restrictions - Reduces supply of competing workers
training, import, immigration
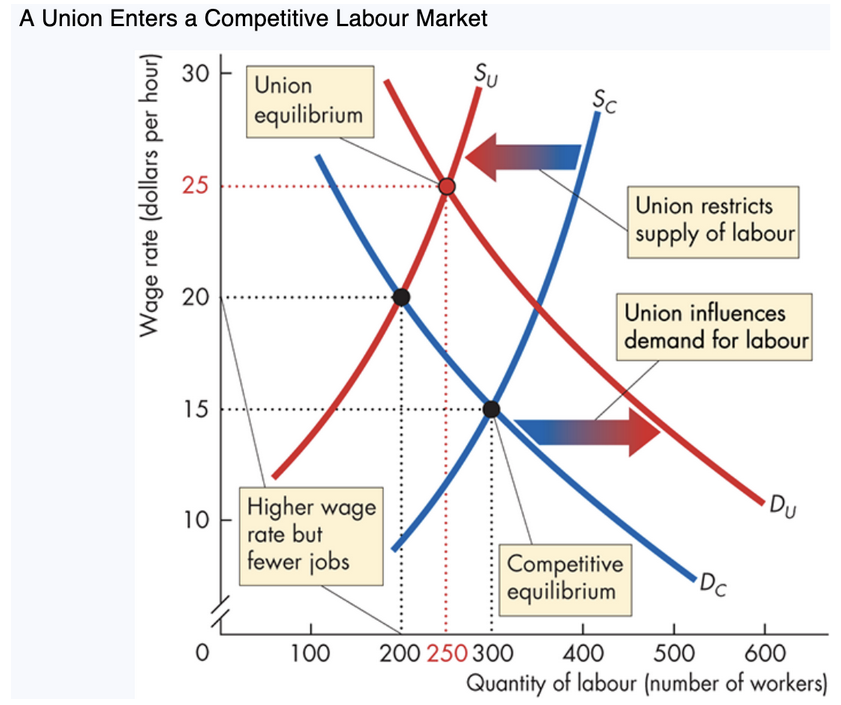
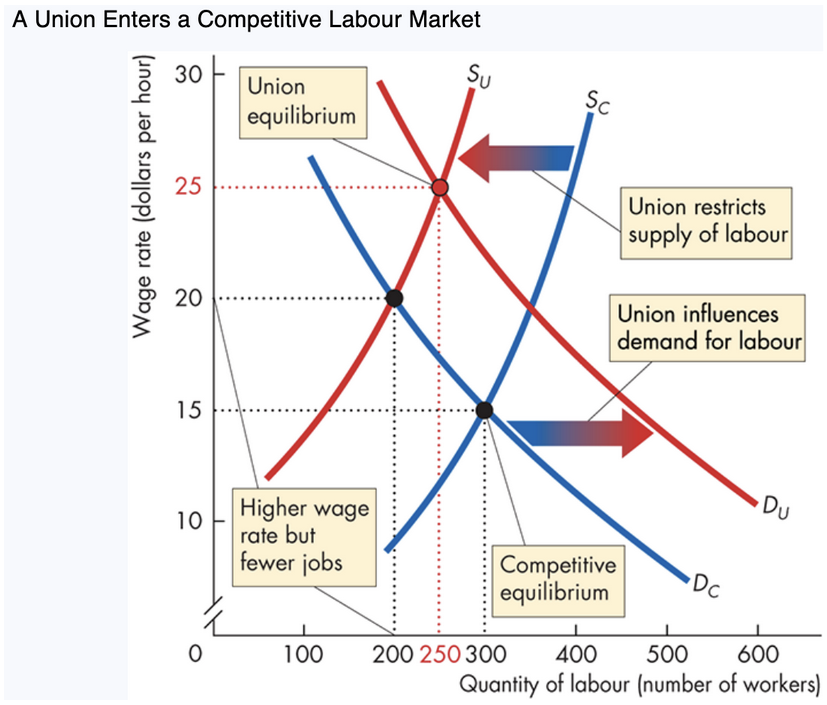
8. Union Market Equilibrium (Graph Summary)
Without union:
Wage = $15
Employment = 300
Union restricts supply (SC → SU):
Wage rises to $20
Employment falls to 200
Union also increases demand (DC → DU):
Wage rises further to $25
Employment increases to 250
Spillover effect:
Excess workers enter ___ markets → ↑ supply in nonunion sectors → ↓ wages there
Increases union–nonunion wage gap
nonunion
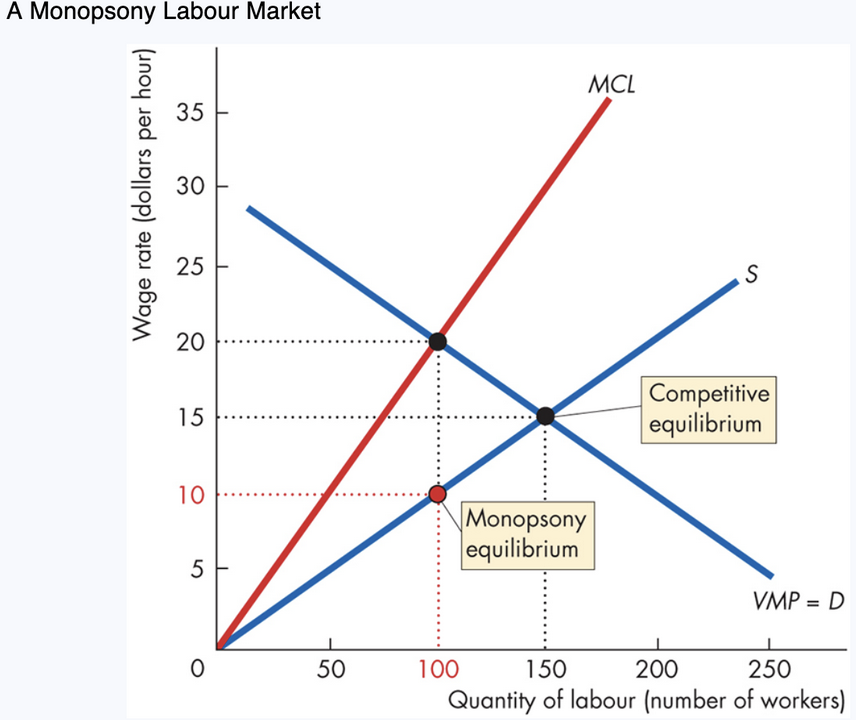
9. Monopsony in Labour Markets
A monopsony = labour market with ___ employer.
Provincial governments hiring nurses
A mining firm in a __ town
Monopsony behaviour
Faces upward-sloping labour supply curve
Must __ wages to attract more workers
BUT must pay the higher wage to ___ workers → Marginal Cost of Labour (MCL)___ wage rate
one, small, raise, all, >

Profit-maximizing rule
Hire workers until: ____ = __
Results
____ wage
___ workers hired than in competitive market
Monopsony wage: $10
Employment: 100
Competitive wage: $15
Employment: 150
Thus, monopsonies pay ___ and employ __ workers.
MCL=VMP, lower, fewer, less, fewer
10. ____ Monopoly (__ + ____)
Union = ___ seller of labour
Monopsony = monopoly ___ of labour
Outcome determined by ____ power.
If both sides are equally strong:
They split difference between monopsony wage ($10) and VMP wage ($20) →
Final wage = $15
NHL (owners) vs. NHLPA (players’ union)
Can lead to ___/lockouts
bilateral, union, monopsony, monopoly, buyer, strikes
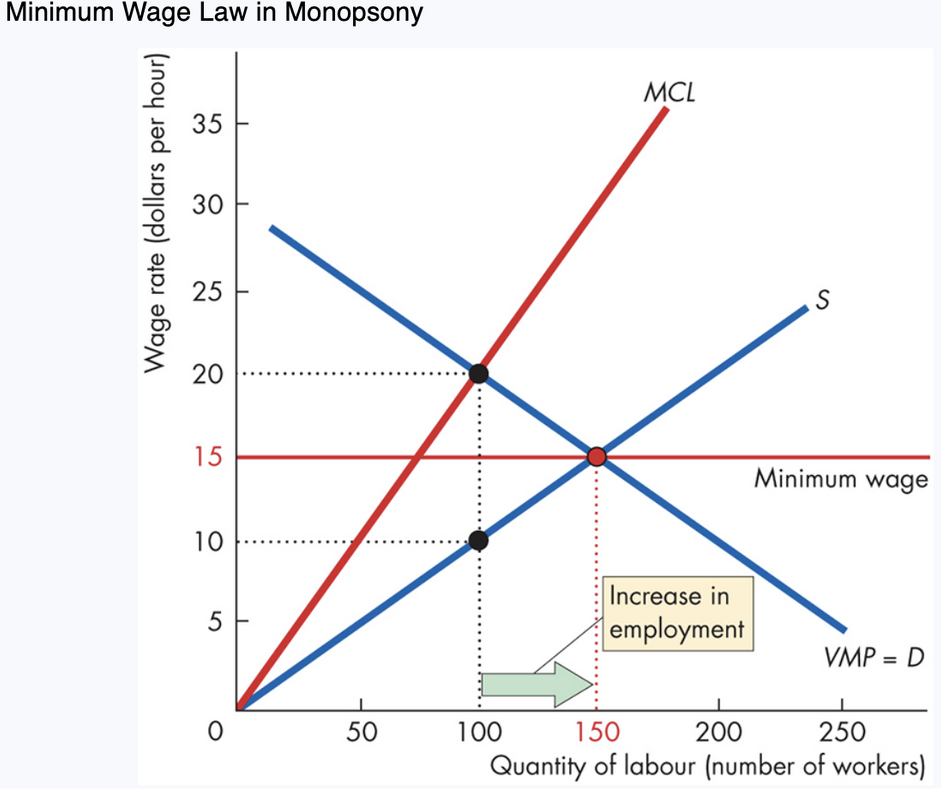
11. Minimum Wage in Monopsony
Unlike in competitive markets:
In monopsony, minimum wage can increase employment.
Monopsony wage: $10
Minimum wage imposed: $15
Employment rises: From 100 → 150 workers
Reason:
The minimum wage creates a perfectly elastic supply curve up to 150 workers
Firm’s ___ becomes constant at $15, lowering ___ relative to before
Firm hires more workers where MCL = __
MCL, MCL, VMP
1. What determines labour supply?
Tradeoff between ___ and leisure
___ wage
Income & __ effects
labor, reservation, substitution
2. How are wage & employment determined in competitive markets? Intersection of market supply and demand
3. How do unions influence wages?
Restrict labour supply
___ labour demand
Bargain for higher wages
increase
4. What is a monopsony? Why lower wages?
One employer
Faces upward-sloping supply curve
MCL __ wage → hires fewer workers at ___ wage
5. Wage rate when union faces monopsony? Bargained outcome between monopsony wage and competitive wage
6. Minimum wage effect in monopsony? Can raise both wage and ___ (unlike competitive market)
>, lower, employment