Describing Categorical Data
1/19
Earn XP
Description and Tags
Quantities used to describe the distributions of data, appropriate visualisation for the distribution of categorical data, methods to calculate the spread and central tendency for the distribution of categorical data
Name | Mastery | Learn | Test | Matching | Spaced | Call with Kai | Chat |
|---|
No analytics yet
Send a link to your students to track their progress
20 Terms
Table of data analysis
What is frequency distribution?
Math function showing the number of instances in which a variable takes each of its possible values, a plot showing the number of instances of each value of a variable
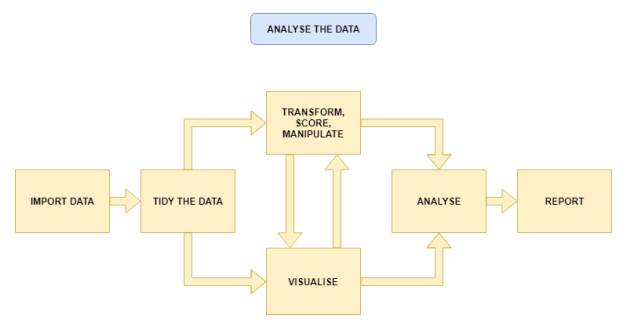
What are the fundamentals of plots?
Data
Axes → have scales
Geometric objects
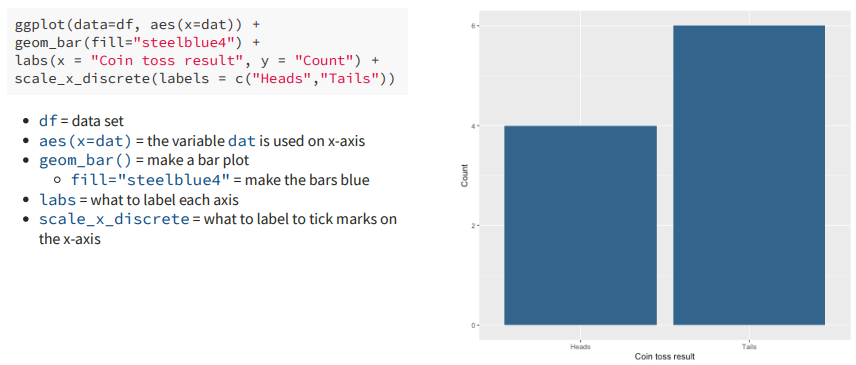
What plots are used to show frequency distributions of categorical variables?
Bar plots
What are bar plots used to describe? What is the code for this?
Used to describe nominal + ordinal data
What is central tendency?
Set of stats that describe the central point of frequency distributions (averages)
What is the central tendency for nominal data?
Mode
What is the central tendency for ordinal data?
Mode
Median
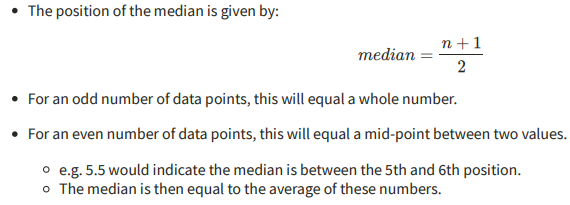
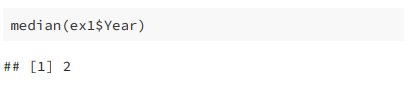
How is median calculated?
What is the code for finding the median?
What is dispersion/spread?
Set of stats that describe the variation in frequency distributions
What is the variability of nominal data?
Relative frequency
What is the variability of ordinal data?
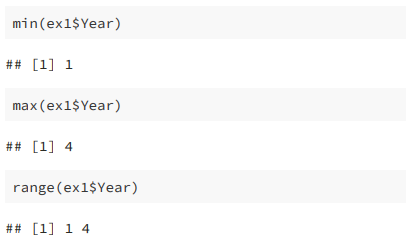
Range
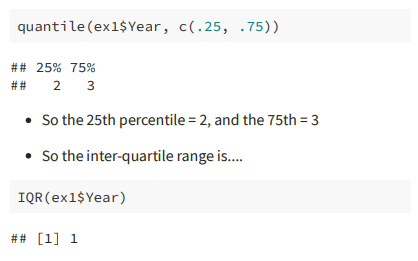
IQR → difference between 25% + 75%
What are the quartiles for ordinal data?
The 1st/lower quartile is the first category for which the cumulative percentage is ≥ 25%
The median is the first category for which the cumulative percentage is ≥ 50%
The 3rd/upper quartile is the first category for which the cumulative percentage is 75%
What is the code for calculating range?
What is the code for calculating the IQR?
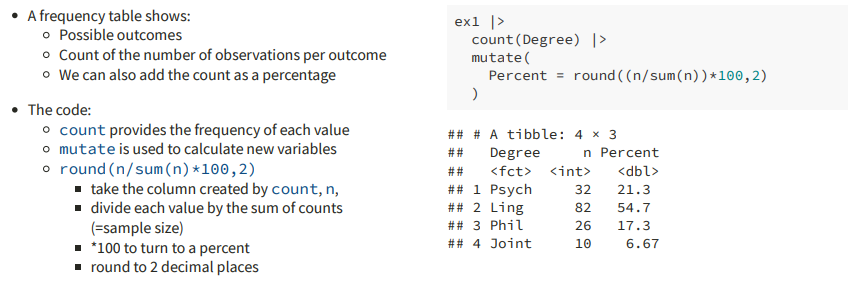
What does a frequency table show?
Possible outcomes
Count of the number of observations per outcome (can also be added as a %)
What is the code for a frequency table?
What is a multi-modal distribution?
Observing 2 or more values with equal frequency
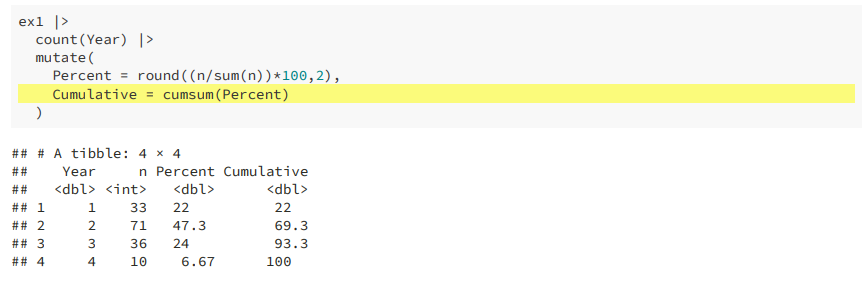
What is the code for calculating cumulative percentage?