APES Unit 2: Natural Disruptions to Ecosystems
1/3
There's no tags or description
Looks like no tags are added yet.
Name | Mastery | Learn | Test | Matching | Spaced | Call with Kai |
|---|
No study sessions yet.
4 Terms
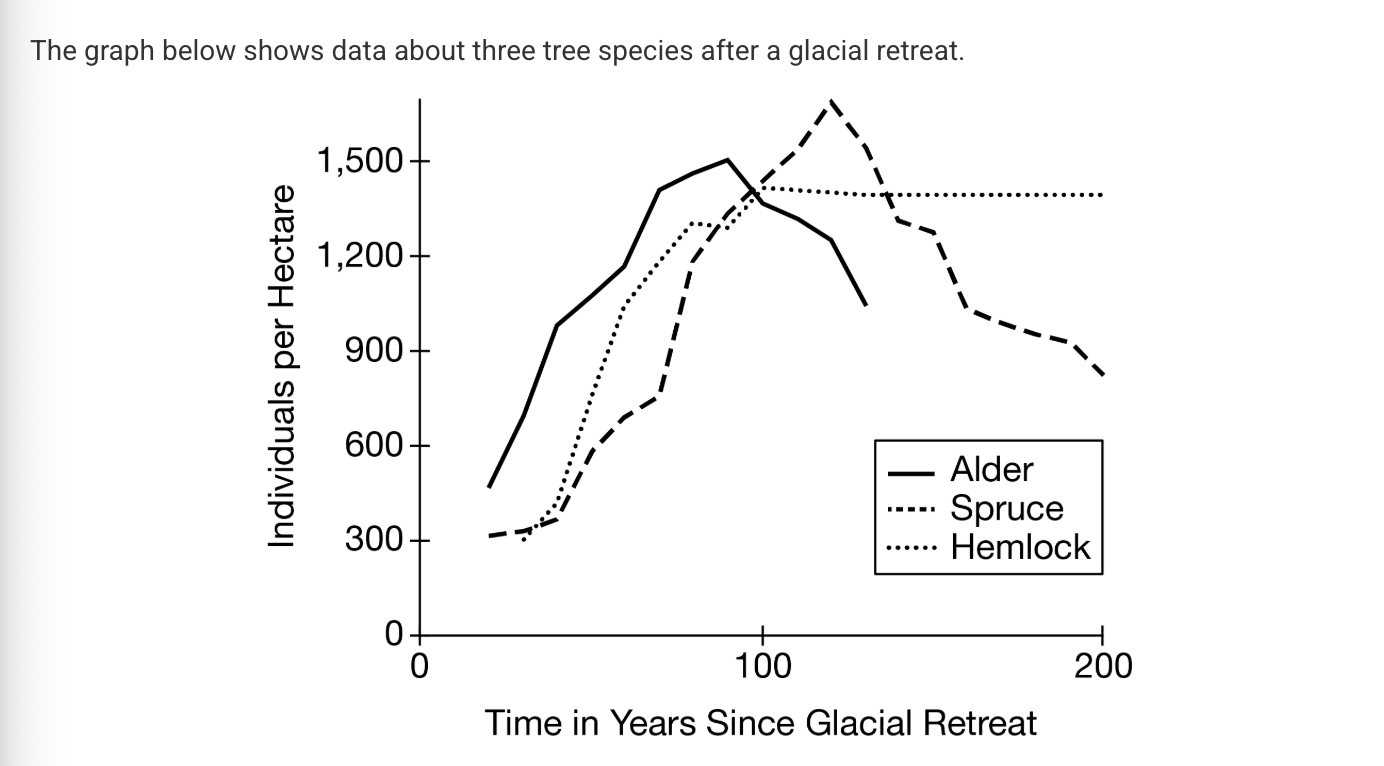
Based on the data shown in the graph, which of the following events occurred after the glacial retreat?
A) Primary succession
B) Flooding
C) Sea level rise
D) Global climate change
A) Primary succession
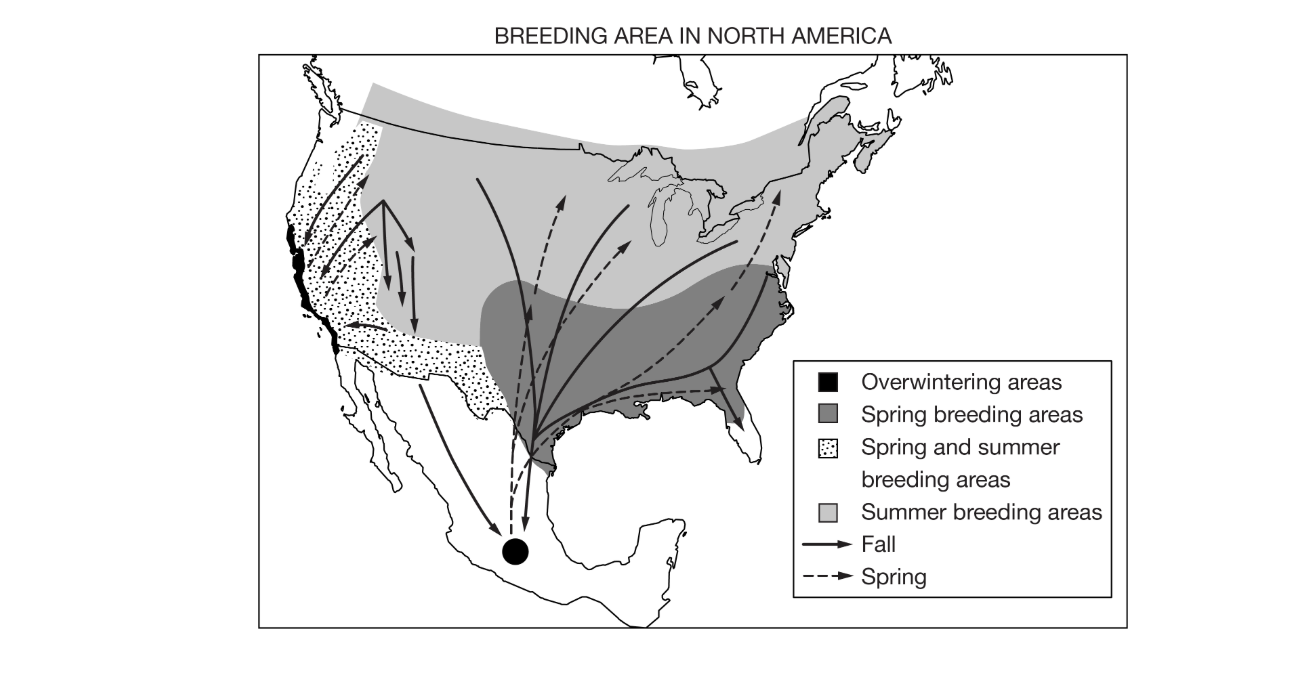
Which of the following explanations is best supported by the data shown in the map above?
A) Earth’s climate has changed over geological time, and plates on Earth’s crust have shifted.
B) Sea level rise has led to an increased concentration of wildlife inland as the coastal areas flood.
C) Organisms adapt to human population growth by changing at the genetic level.
D) Animals migrate seasonally to mate and to find food in different habitats.
D) Animals migrate seasonally to mate and to find food in different habitats.
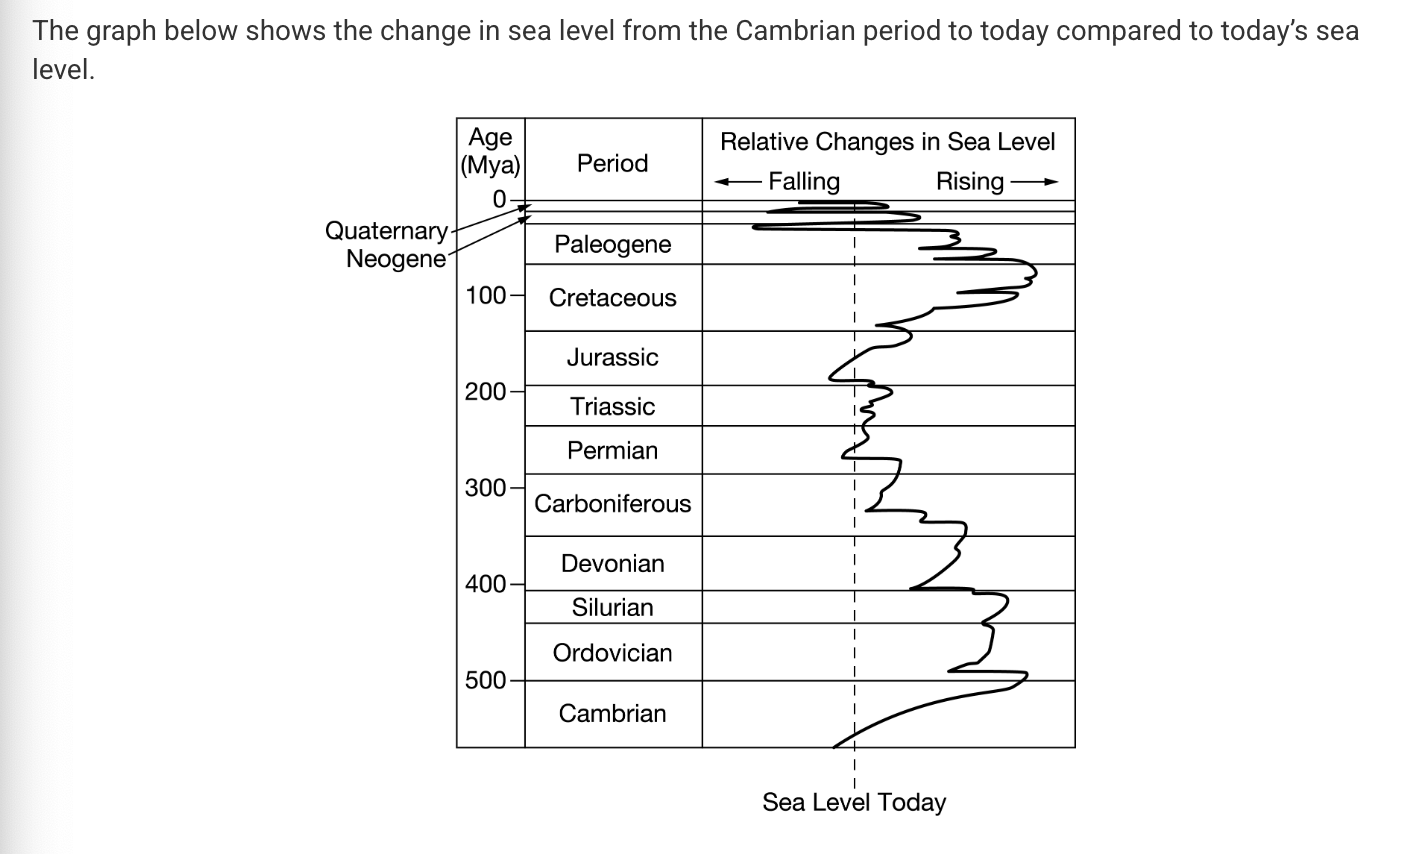
Which of the following statements correctly describes the trends seen in the data?
A) The highest sea level occurred in the Triassic period.
B) The lowest sea level occurred during the Paleogene period.
C) The first rise in sea level occurred during the Cretaceous period.
D) Sea level decreased from the beginning of the Triassic period to the end of the Cretaceous period.
B) The lowest sea level occurred during the Paleogene period.
hope you did well
lol