(2/2) economic policy objectives (chap 27-29)
1/30
Earn XP
Description and Tags
Trends in macroeconomic indicators (do), Income distribution and welfare
Name | Mastery | Learn | Test | Matching | Spaced | Call with Kai |
|---|
No analytics yet
Send a link to your students to track their progress
31 Terms
income
flow of wages and earning to an individual
wealth
stock of accumulated assets over time that can create income
income distribution
the way in which national income is distributed amongst the population in a society
wealth distribution
the way in which wealth is distributed amongst the population in a society, usually more uneven
why should income be distributed evenly in a society
prevents inequality that worsens society
what are the two ways that income is assessed in economics, what are the issues?
GNI or GDP per capita, problematic as they don’t assess the distribution of income just the average, significant disparities that are ignored
what is the best way to measure income inequality
comparing the top and bottom deciles, quintiles and quartiles of household incomes in an economy and creating ratios as a result
what percentage of wealth does the top 20% of the uk hold
60%
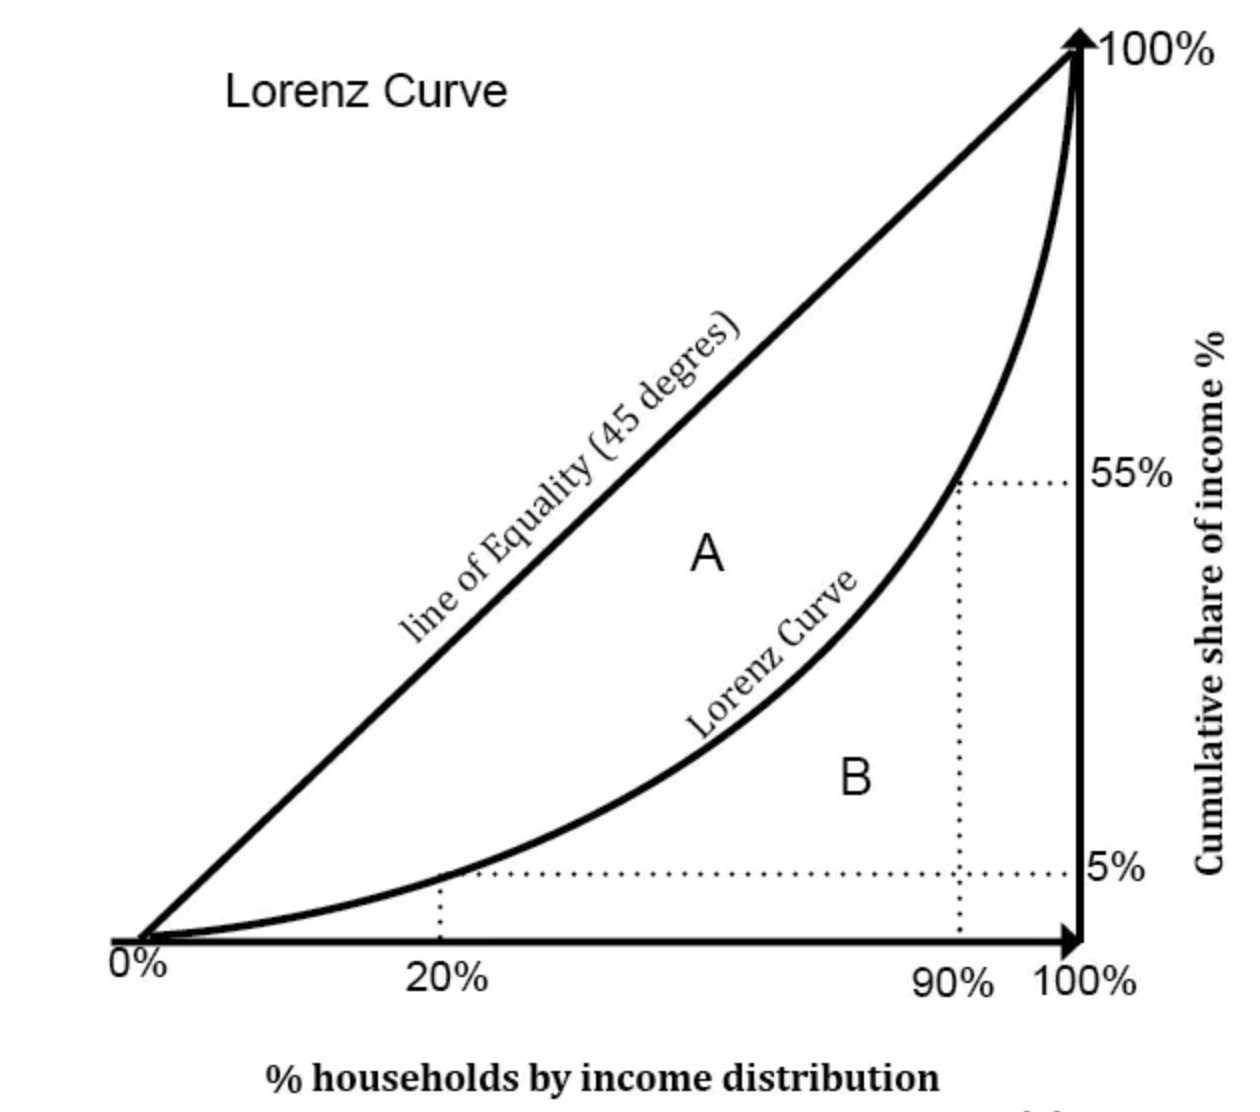
what curve displays the income inequality of a region
the lorenz curve
draw and explain the lorenz curve
depicting the correlation between the relationship of the cumulative % of households and the cumulative % of income, the closest the countries line is to the y=x line, the closest it is to income becoming perfectly distributed
what content does the lorenz curve work in conjunction with
the gini coefficient
what is the gini coefficient
the ratio of the area that is enclosed by a countries lorenz curve to the area under perfectly equal income ie a/a+b
what are the three types of poverty
absolute poverty, relative poverty, persistent poverty
absolute poverty
where people do not have the basic necessities to survive within a society such as food and drink
relative poverty
where people in an economy do not have the same household income as others within the society
what is relative poverty described as in economics
any household income that is 60% below the median income
persistent poverty
where households are currently in relative income poverty and have been in 2/3 of the past three years
headcount ratio
the percentage of a country that are living under the international poverty line
international poverty line, include the current rate
an internationally recognised value that shows how much the minimum amount of income per day is to class someone as poor ($2.15)
why is the international poverty line problematic to use
it doesn’t recognise relative poverty as $2.15 may suffice in one economy but not another ie yemen vs usa
what are the four main causes of inequality
wealth distribution, labour market, demographic changes, government intervention
describe wealth distribution as a cause of inequality
more wealth inequality means that the top earners have more of the national income and can withhold assets from the general public
what is a good example of wealth distribution within the uk
wealthy people having houses which the choose to rent out to those who cannot afford a mortgage maintaining a rent trap
how can wealth distribution appear in LDCs
larger gaps between the wealth in the country and absence of stable financial institutions means that its difficult for people to obtain wealth and means there is more unequal control
how are labour markets a cause of inequality
change in the international labour markets such as. movement to more tertiary industries increases the amount of structural unemployment, technology can often replace labour and decrease jobs, wage gaps in gender result in more inequality
how are demographic changes a cause of inequality
population demographics are ageing and more people are claiming a pension due to better medicine, means that there is more pressure on pensions and less money to be spent elsewhere
how is government intervention a cause of inequality
governments have to balance what they choose to spend their money on , transfer payment budgets can often be limited, minimum wage policies can elevate inequalities
what are some key consequences of poverty
cycle of poverty where poor health means poor education and poor employment, difficult to put a level on the amount of poverty that is acceptable in society so hard to say if you are spending enough on reducing it or not, might have international responsibility too?
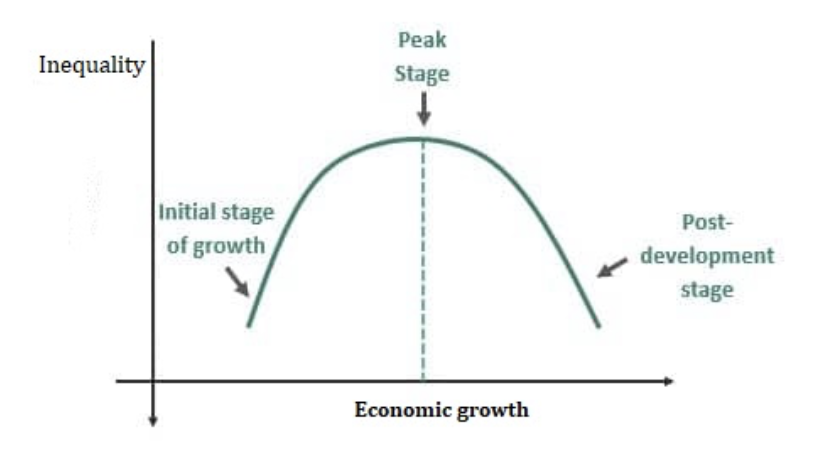
what curve represents the relationship between economic growth and inequality
the kuznets curve
draw and explain the kuznets curve
n shaped curve that shows the relationship between the gini coefficient and the development of an economy in its lifetime, in early stages there is more equality as there are less means of production owners, then increase in inequality during development due to people taking a lead in business, then reinvestment into the economy stabilises inequalities
evaluate the kuznets curve
issue as the data used to analyse the concept would have to span decades and information about inequality is less likely to be collected than other data