Transportation Engineering
1/57
There's no tags or description
Looks like no tags are added yet.
Name | Mastery | Learn | Test | Matching | Spaced |
|---|
No study sessions yet.
58 Terms
Traffic Stream Parameters
Characteristics that define and describe the behavior and performance of traffic flow.
Uninterrupted Flow
Traffic flow influenced by roadway characteristics and vehicle interactions within the traffic stream.
Interrupted Flow
Traffic operations influenced by traffic control devices.
Traffic Flow (q) Formula
q = n/t, where q is flow in vehicles per time, n is number of vehicles, and t is time interval.
q=1/h, where h is the average time headway
q=uk
Time Headway (h)
The time interval between the passage of front bumpers of successive vehicles.
Average Speed
Can be defined as Time Mean Speed or Space Mean Speed.
Time Mean Speed (TMS)
Average speed of all vehicles passing a point on a roadway over a specified time.
Space Mean Speed (SMS)
Average speed of all vehicles occupying a given section of roadway over a specified time.
Traffic Density (k)
k = n/l, where k is density in vehicles per distance, n is number of vehicles, and l is length of roadway.
k=1/s, where s is the average spacing
Macroscopic Measures
Traffic measures that reflect the overall traffic stream characteristics, such as flow, speed, and density.
Microscopic Measures
Traffic measures that reflect the behavior of individual vehicles in the traffic stream such as heading , spacing, etc.
Level of Service (LOS)
A qualitative measure describing operational conditions within a traffic stream.
Free-Flow Speed (FFS)
Mean speed of passenger cars under low to moderate flow rates.
Volume-to-Capacity Ratio (v/c)
A measure used to analyze the effectiveness of freeway segments.
Heavy Vehicle Factor (fHV)
Adjustment factor used to account for the impacts of heavy vehicles on traffic flow.
Base Conditions
Standard conditions used for traffic analysis, including minimum lane widths and traffic stream composition.
Saturation Flow Rate
The maximum flow rate of vehicles that can pass through a signalized intersection per lane when green.
Effective Green Time
The time during which vehicles are actually able to move during a signal cycle.
Discharge Headway
The time interval between the passing of vehicles at a signalized intersection.
Base Conditions for freeway
Minimum Lane Widths: 12 ft
Minimum right shoulder lateral clearance between edge of the travel lane and the nearest obstacle or object influencing traffic behavior of 6 ft (minimum median lateral clearance is 2ft)
Consisting of passenger cars only
No on-or-off ramps within 3 mi upstream or 3 mi downstream of segment midpoint
Level terrain with no grades greater than 2%
Driver population are familiar users
Base Conditions for multilane highway
Minimum lane widths: 12 ft
Minimum of 12 ft of total lateral clearance from roadside objects (right shoulder and median)
passenger cars only
no direct access point along the roadway
a divided highway
level terrain with no grades greater than 2%
driver population familiar roadway users
free-flow speed of 60 mi/hr or more
Three main variables (parameters) that form the underpinning of traffic analysis are:
Flow, q
Speed, u
Density, k
Pre-timed operation
uses fixed timing plans regardless of traffic conditions. (small intersection)
Semi-actuated operation
activates automatically but allows manual control for minor streets. (minor streets feeding into big highway)
Full actuated operation
allows traffic signals to adjust their timing based on real-time traffic flow.(two big highways intersecting)
Components of a signal cycle
Clearance interval- transition from green to red for a given set of moments (a.k.a yellow)
Green interval
Red Interval
Disadvantages of traffic signals
increasing vehicle delay
increasing vehicle crashes
causing a disruption to traffic progression
Advantages of traffic signals
reduction of some types of crashes (angular crashes)
Provisions for pedestrians to cross the street
Provisions for side street vehicles to enter traffic stream
Provisions for the progressive flow of traffic in a signal system corridor
Free-flow speed
Free-flow speed is the speed at which vehicles can travel without congestion, typically determined under optimal conditions.
Differences between a freeway and multilane highway
Freeways are designed for higher speeds, lack at-grade intersections, and have controlled access, while multilane highways may have varying access points and lower speed limits.
Three main performance measure for a basic freeway segment
Density
Speed
Volume to capacity ratio
three component parts of a freeway
Basic freeway segments
Weaving areas
Merge/Diverge areas
Multi lane highway characteristiccs
speed between 40 & 60 mi/hr
four or six lanes, often with physical median or two-way left turns
typically located in suburban communities leading to central cities or along high-volume rural corridors
traffic signals may be found along such highways
characteristics of freeways
two or more lanes
uninterrupted flow
no signalized or stop-controlled at grade intersections
access to and from the freeway is limited to ramp locations
Opposing directions of flow are continuously separated
Permitted left turns
made across an opposing flow of vehicles
Protected left turn
Made without the opposing flow of vehicles. Its stops the opposing flow so you can turn.
Compound left turns
left turns are protected for a portion snd unprotected for a portion of the signal cycle
Basic three traffic stream models/relationships
speed vs. density
flow vs. density
speed vs. flow
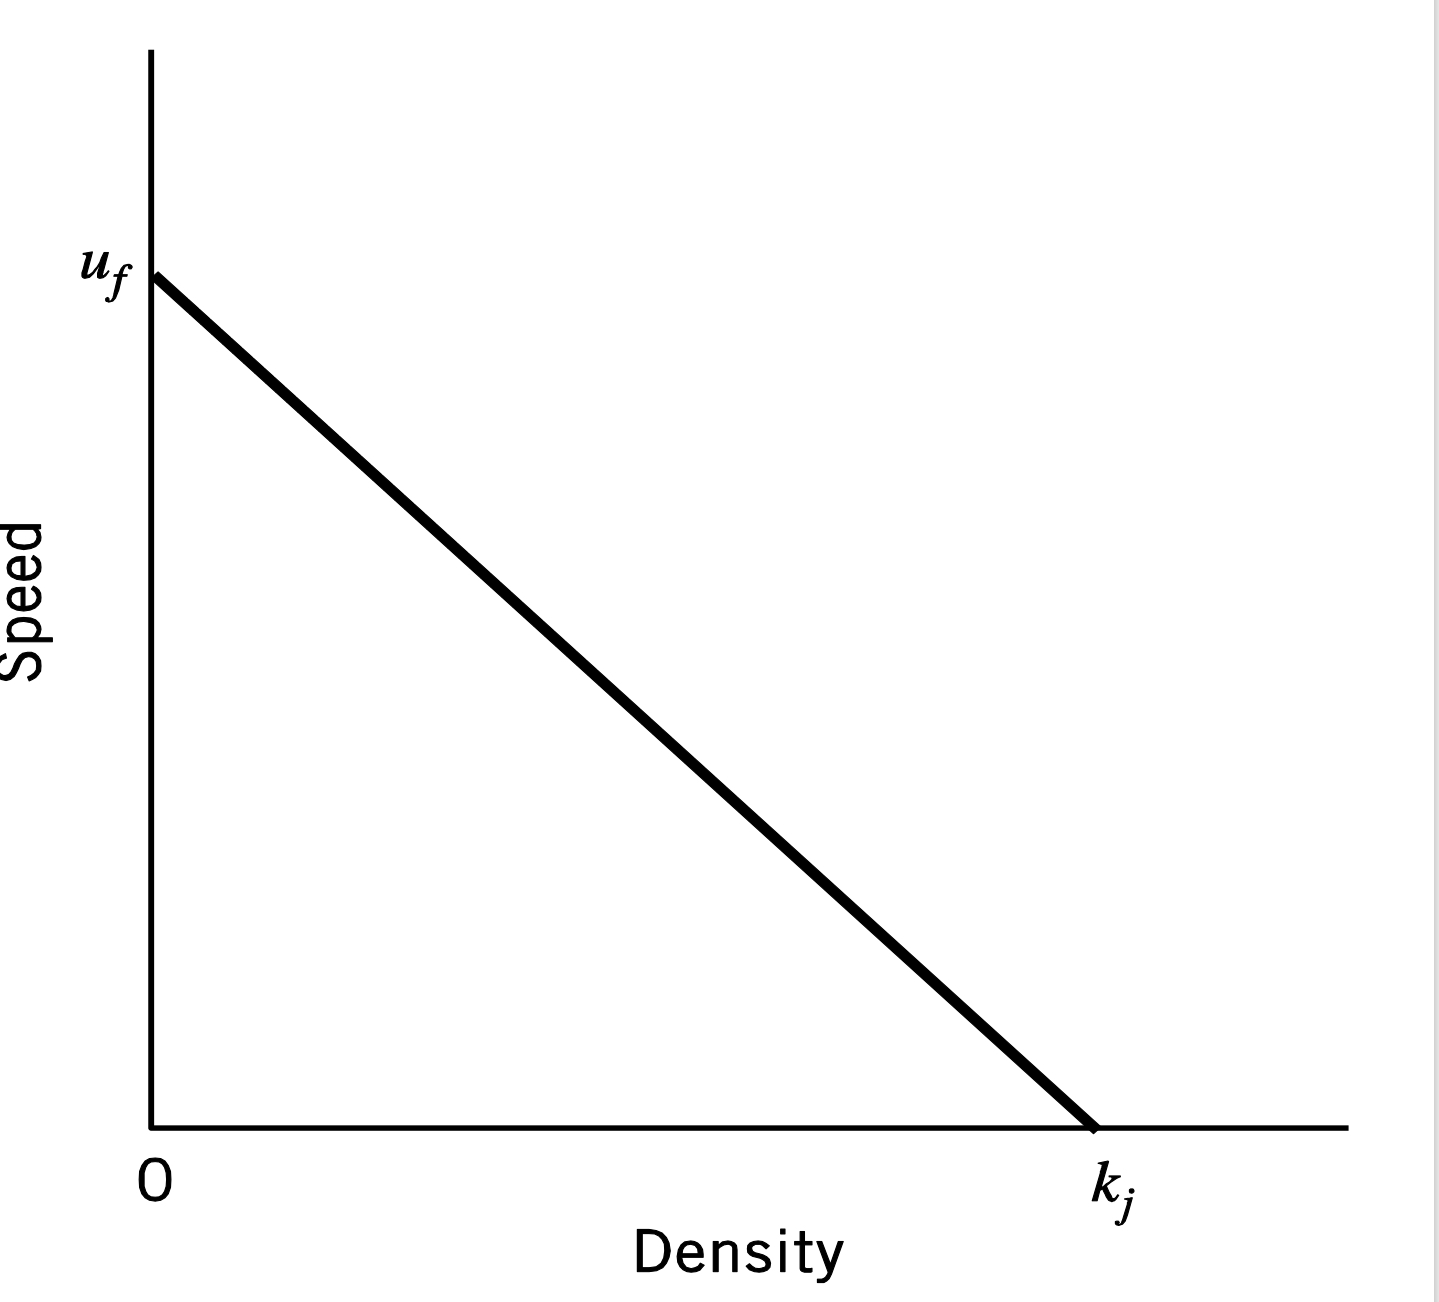
speed vs. density graph
With higher speeds there is less traffic density and with lower speeds there is more traffic density.
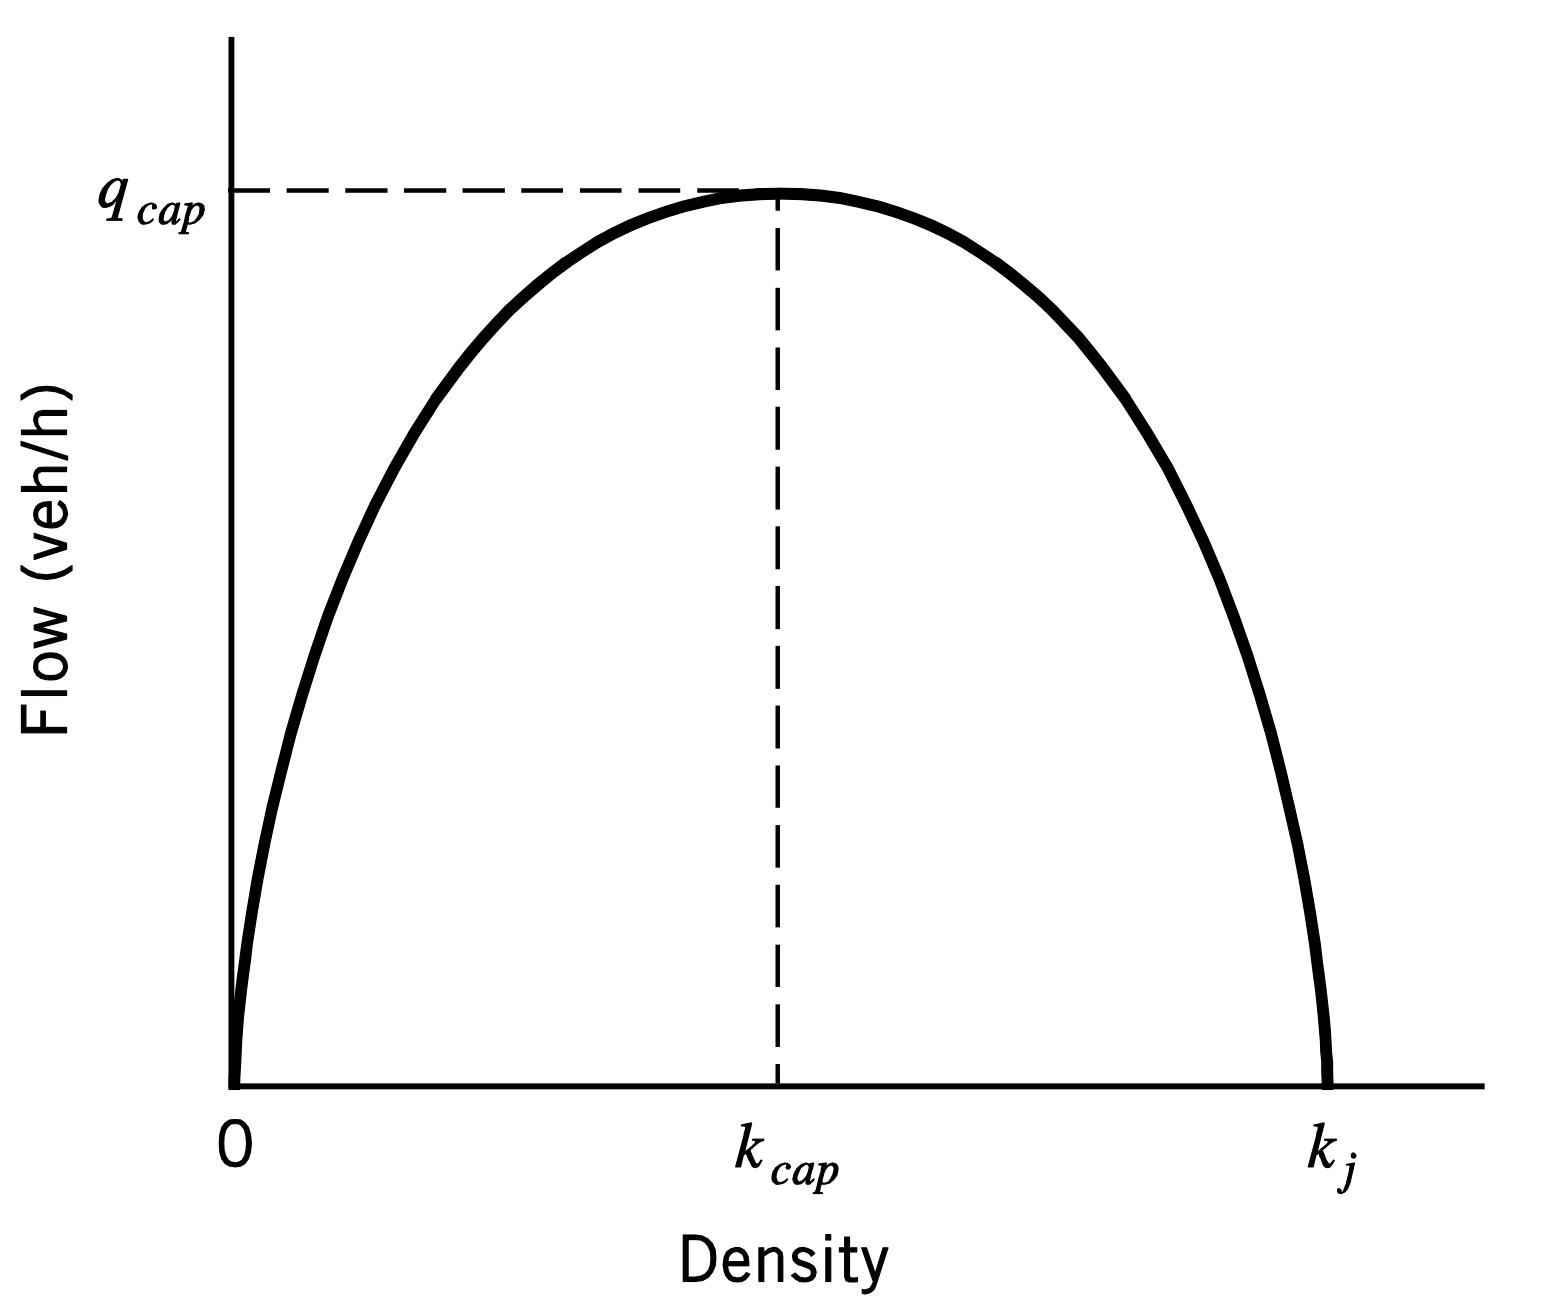
Flow vs. Density graph
low density vehicles can move at desired speeds so the flow increases
At peak the space between vehicles has decrease and reached its capacity
high density the flow starts to decrease and vehicles are moving at slow speeds
Kj- indicates a jammed state with no movement
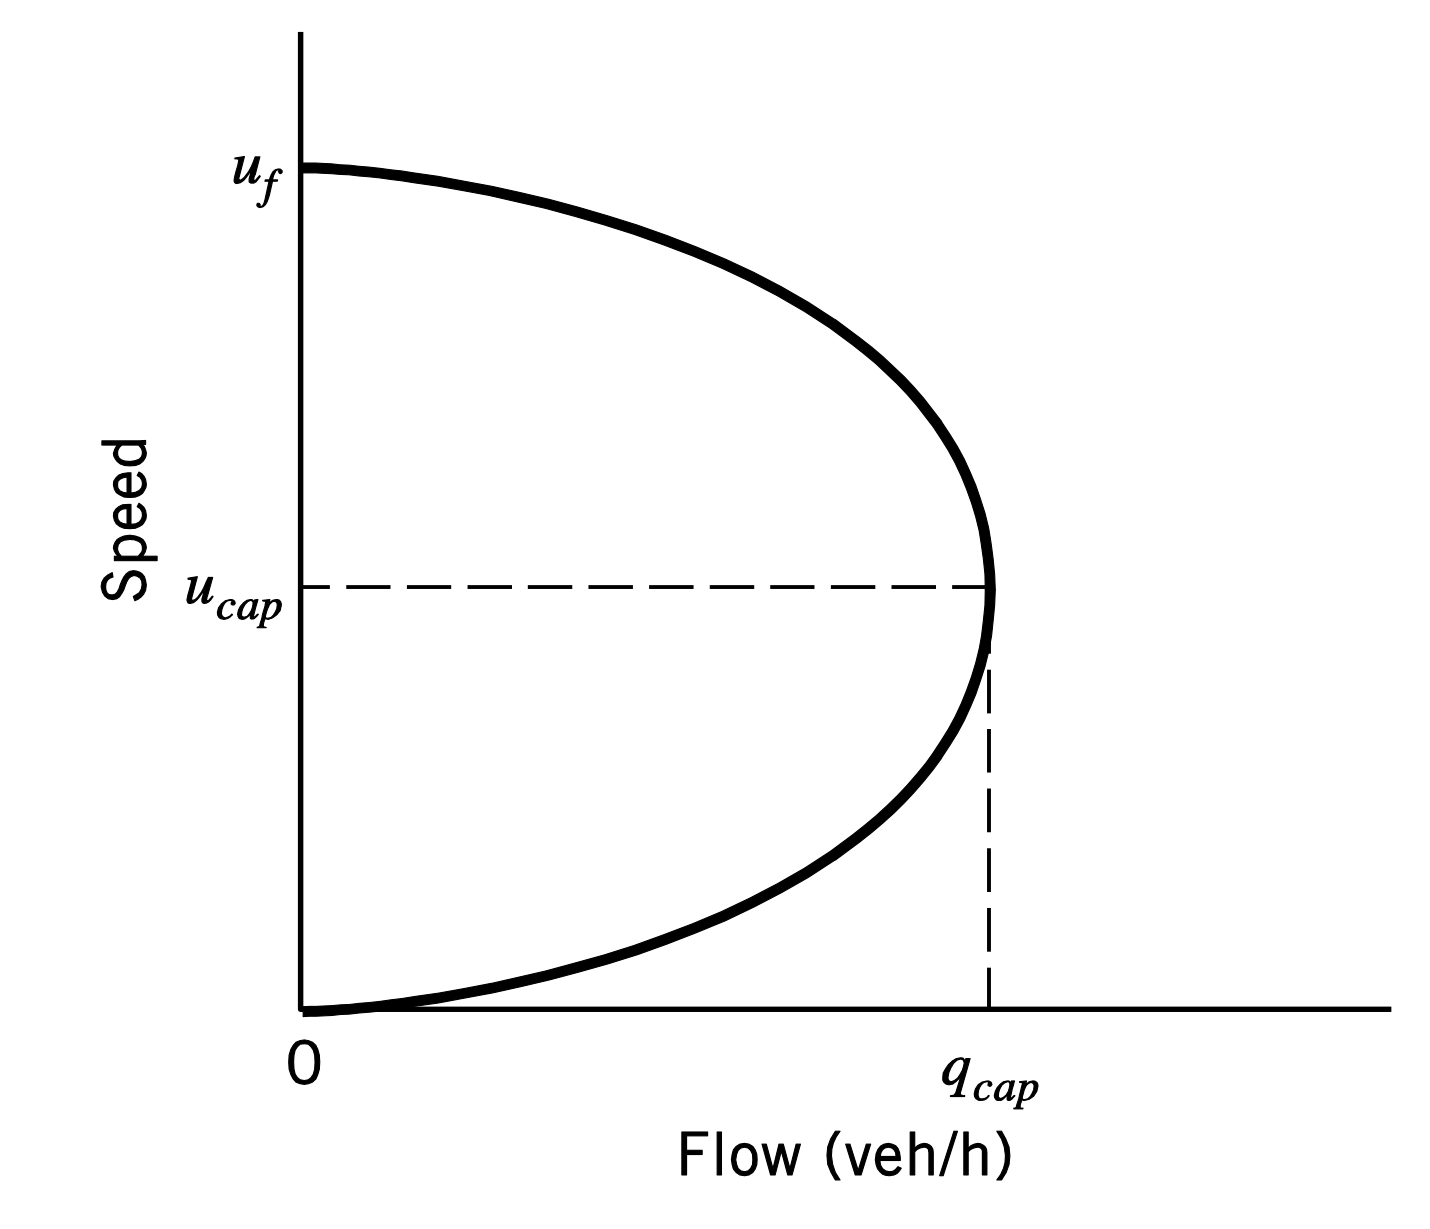
Speed vs. Flow graph
At high speeds the flow increase because cars are able to drive freely
Once the flow has hit its capacity due to cars not having much spacing the speeds will start to decrease to deal withe the congestion
Table 6.3
Freeways & Multilane highways

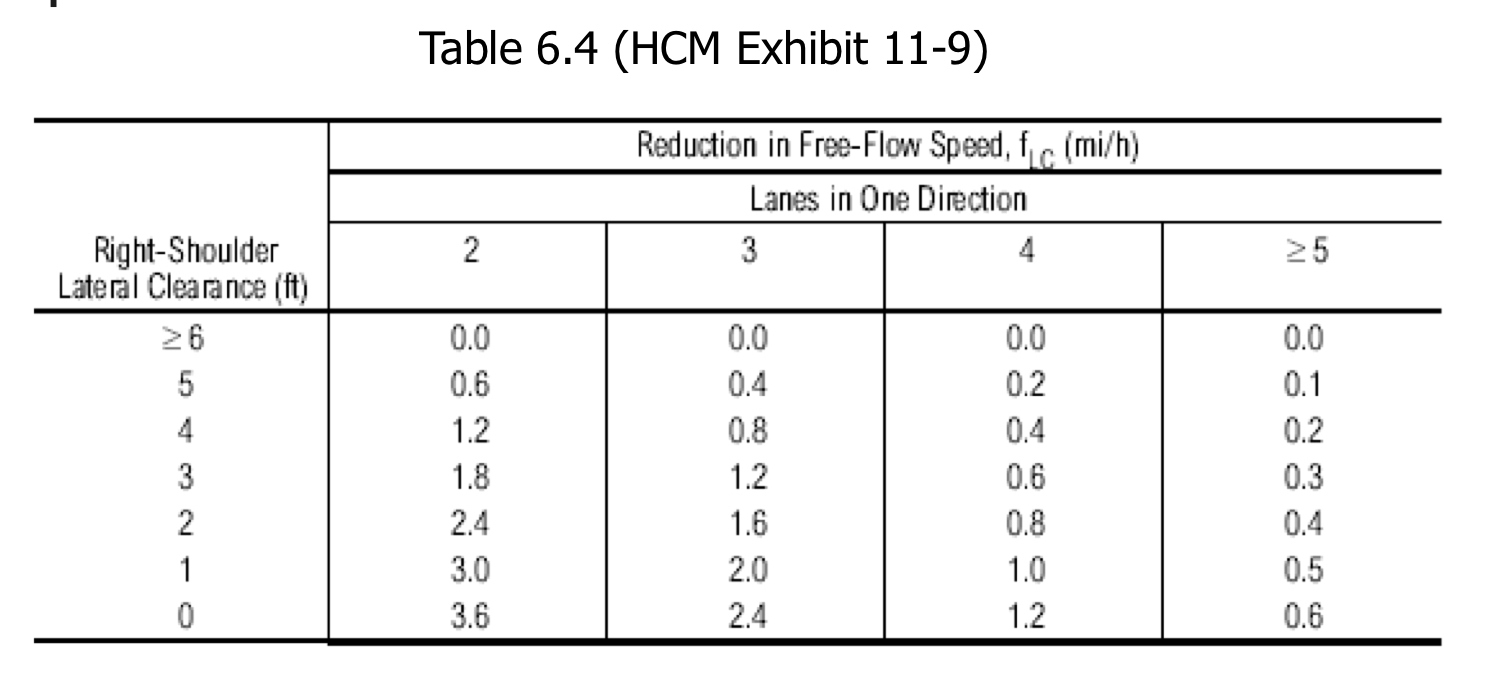
Table 6.4
Freeways
Peak hour factor formula
PHF= V/ (V15×4)
Table 6.5
Freeways

Table 6.6,6.7& 6.8
Use for RV’s and Trucks on Freewys
LOS Graph for Freeways
Figure 6.2
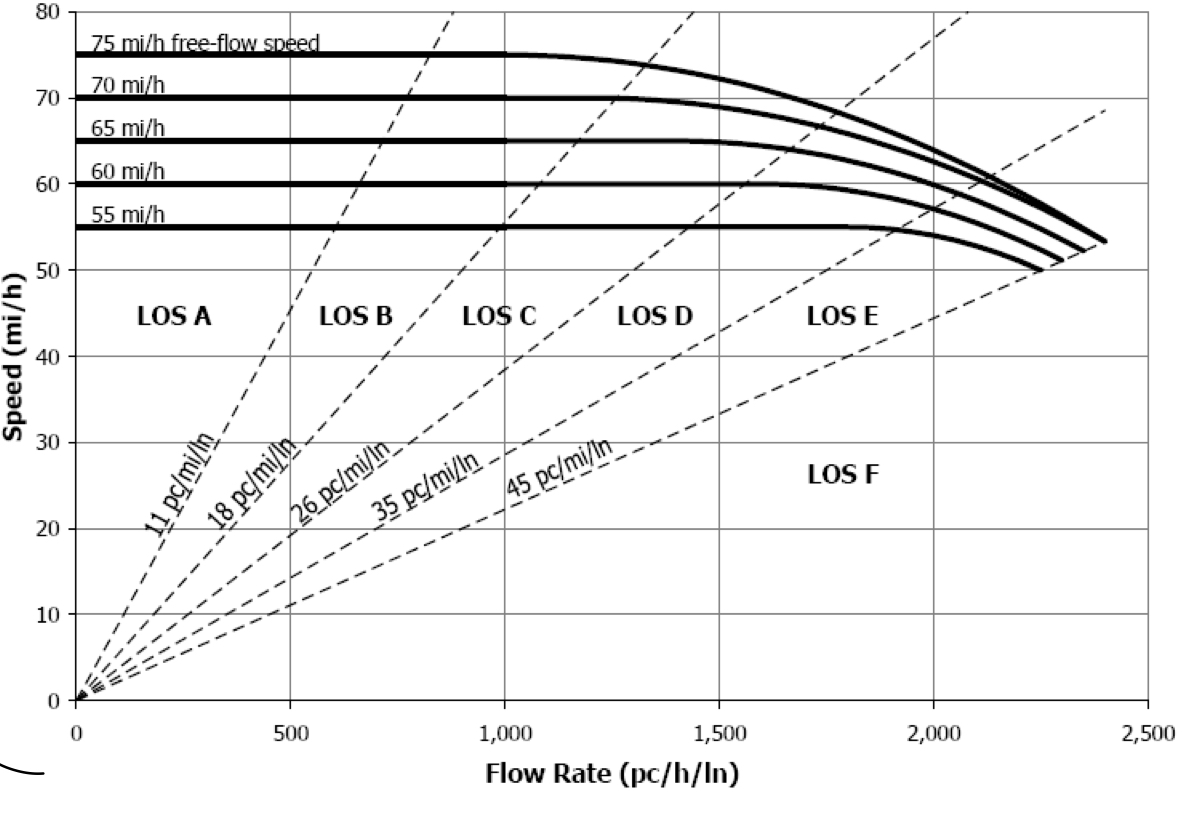
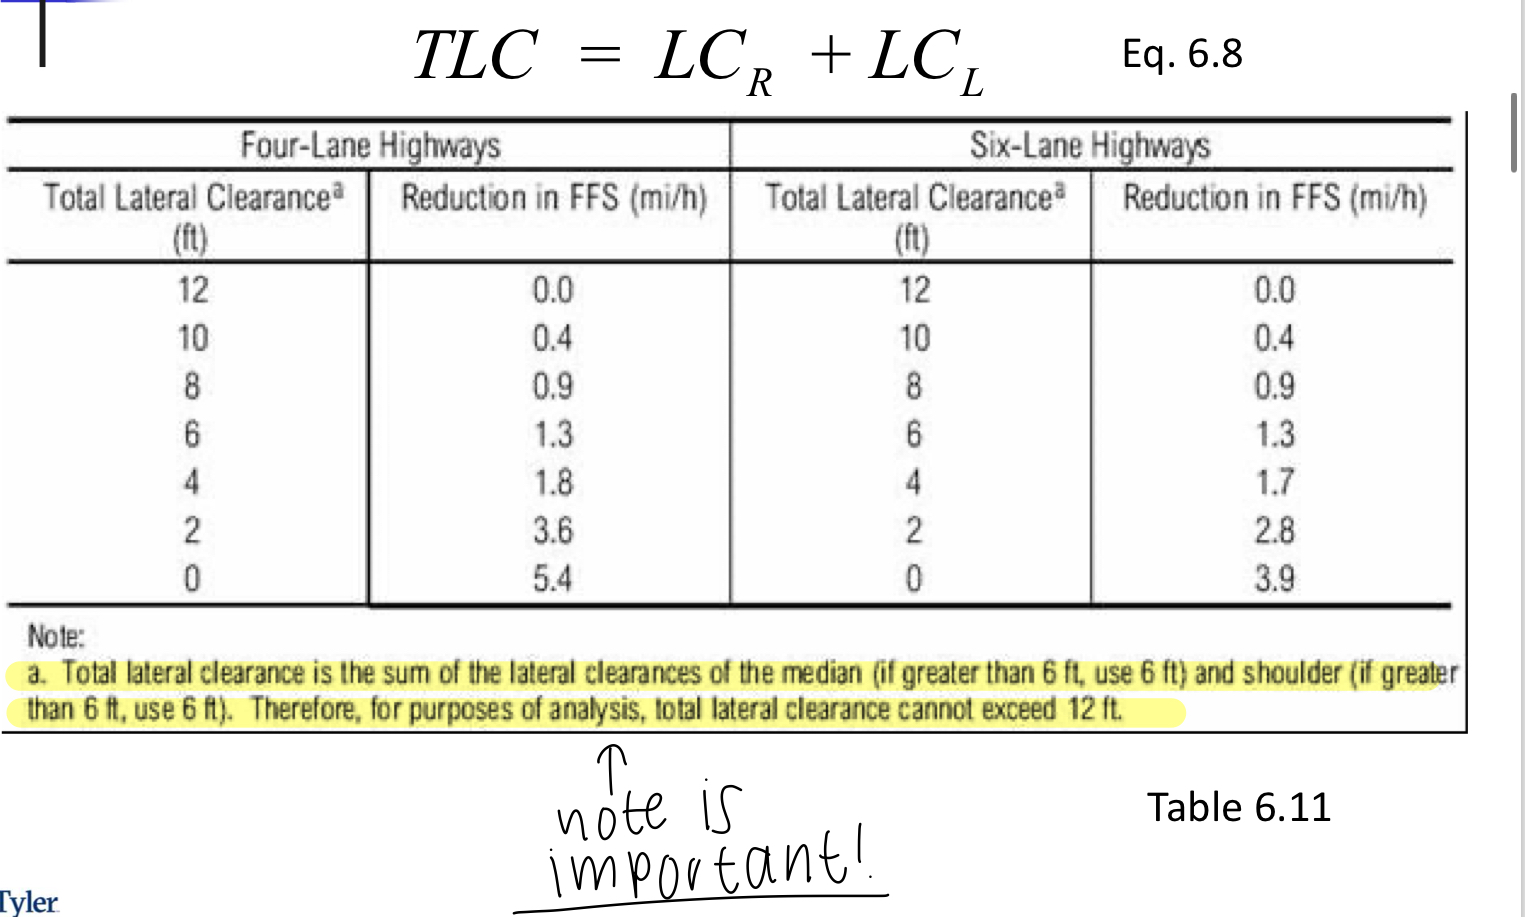
Table 6.11
Multilane Highways
TLC= LCr+LCl
6.12
Multilane Highways
Median Type

Table 6.13
Multilane Highway & Two lane highway

LOS Multilane Highway
Figure 6.4
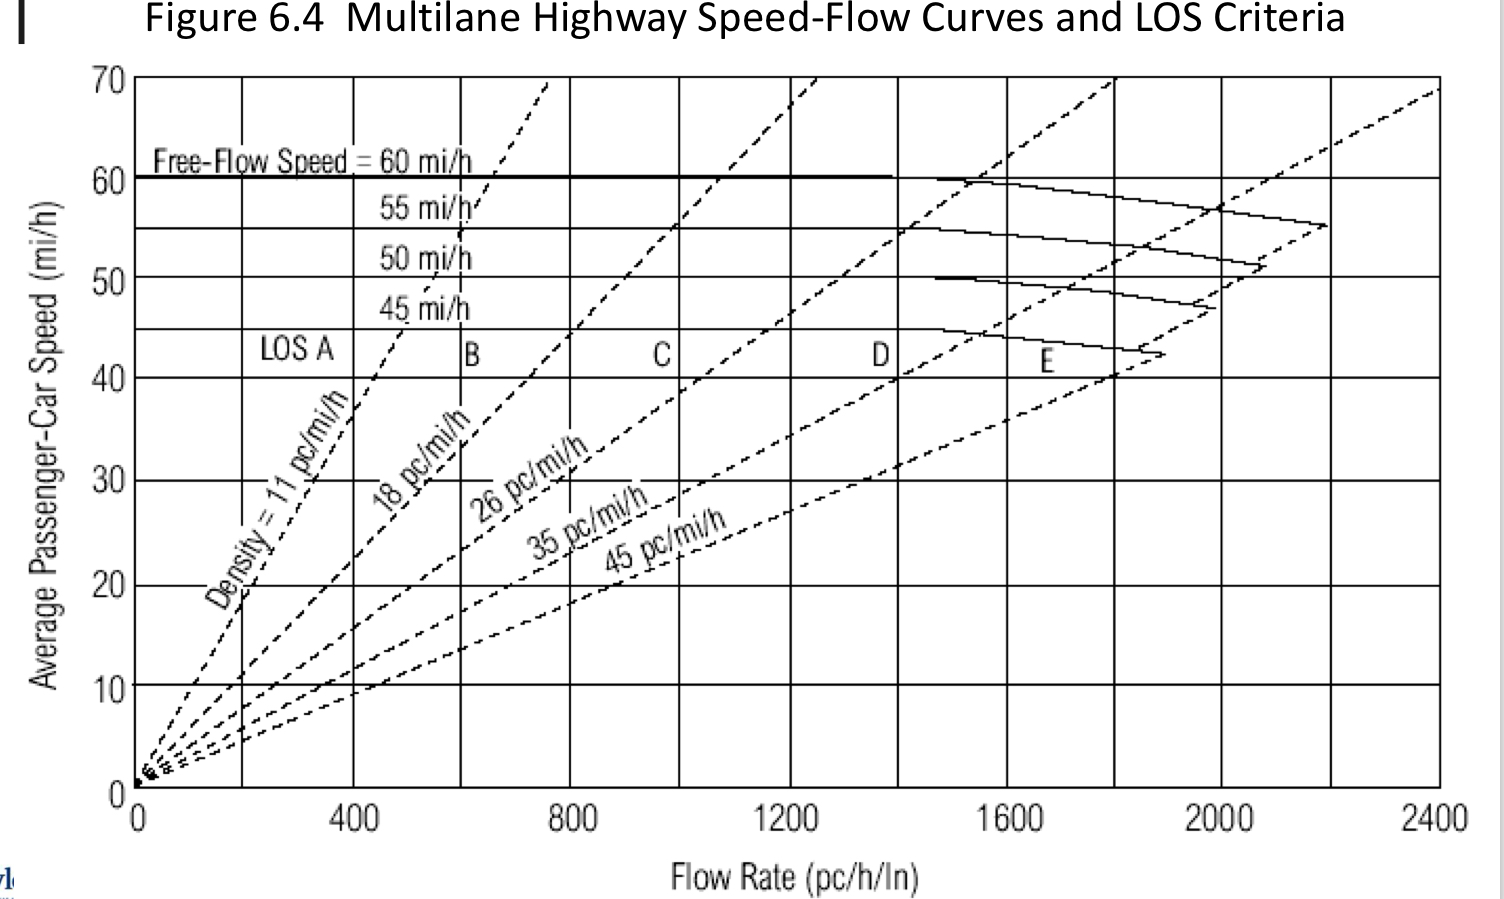
Table 6.14
two lane highway

Table 6.15
Multilane Highway
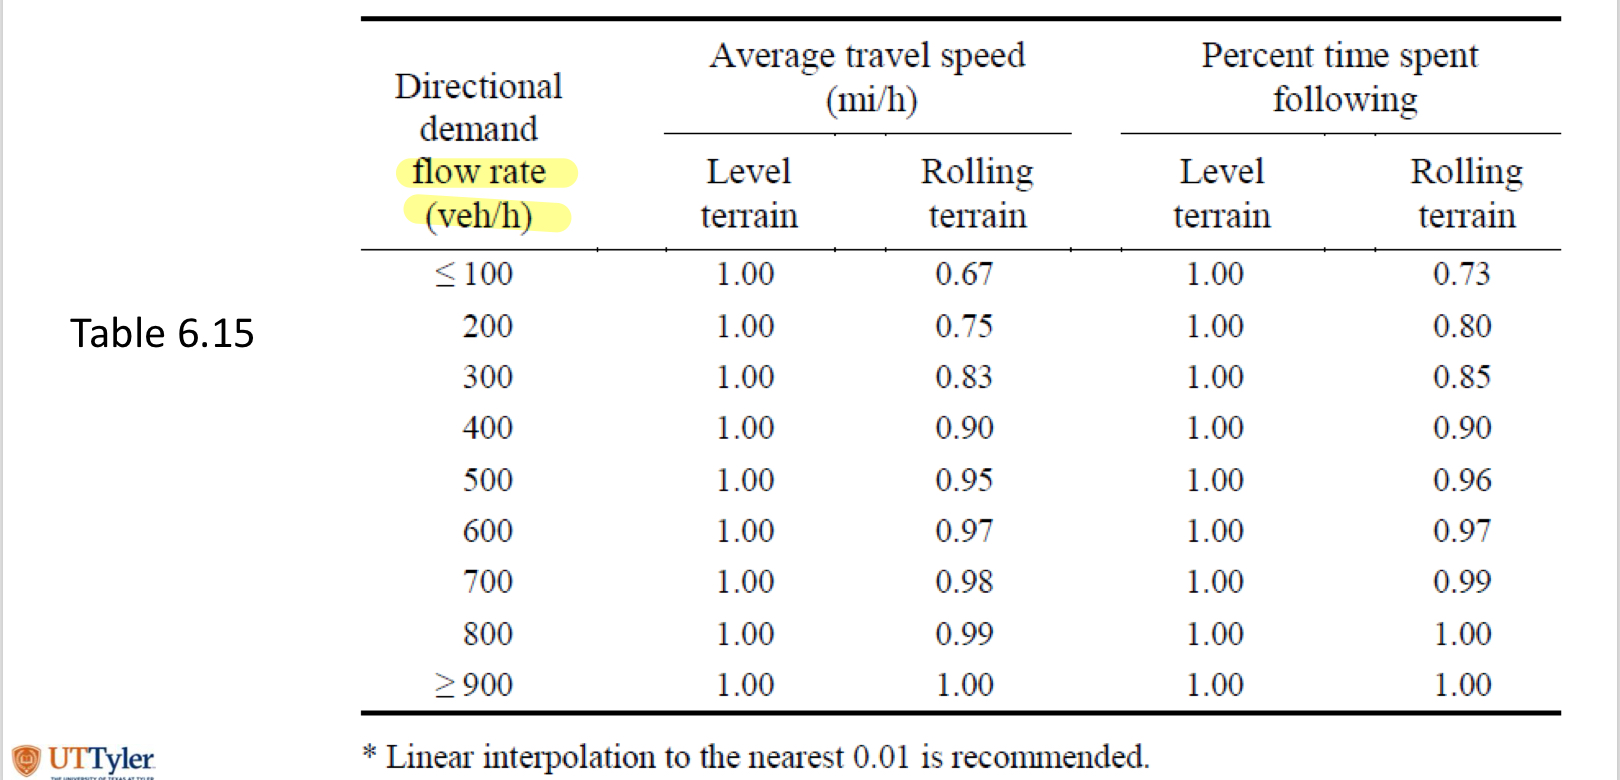
Table 6.16
two lane highways
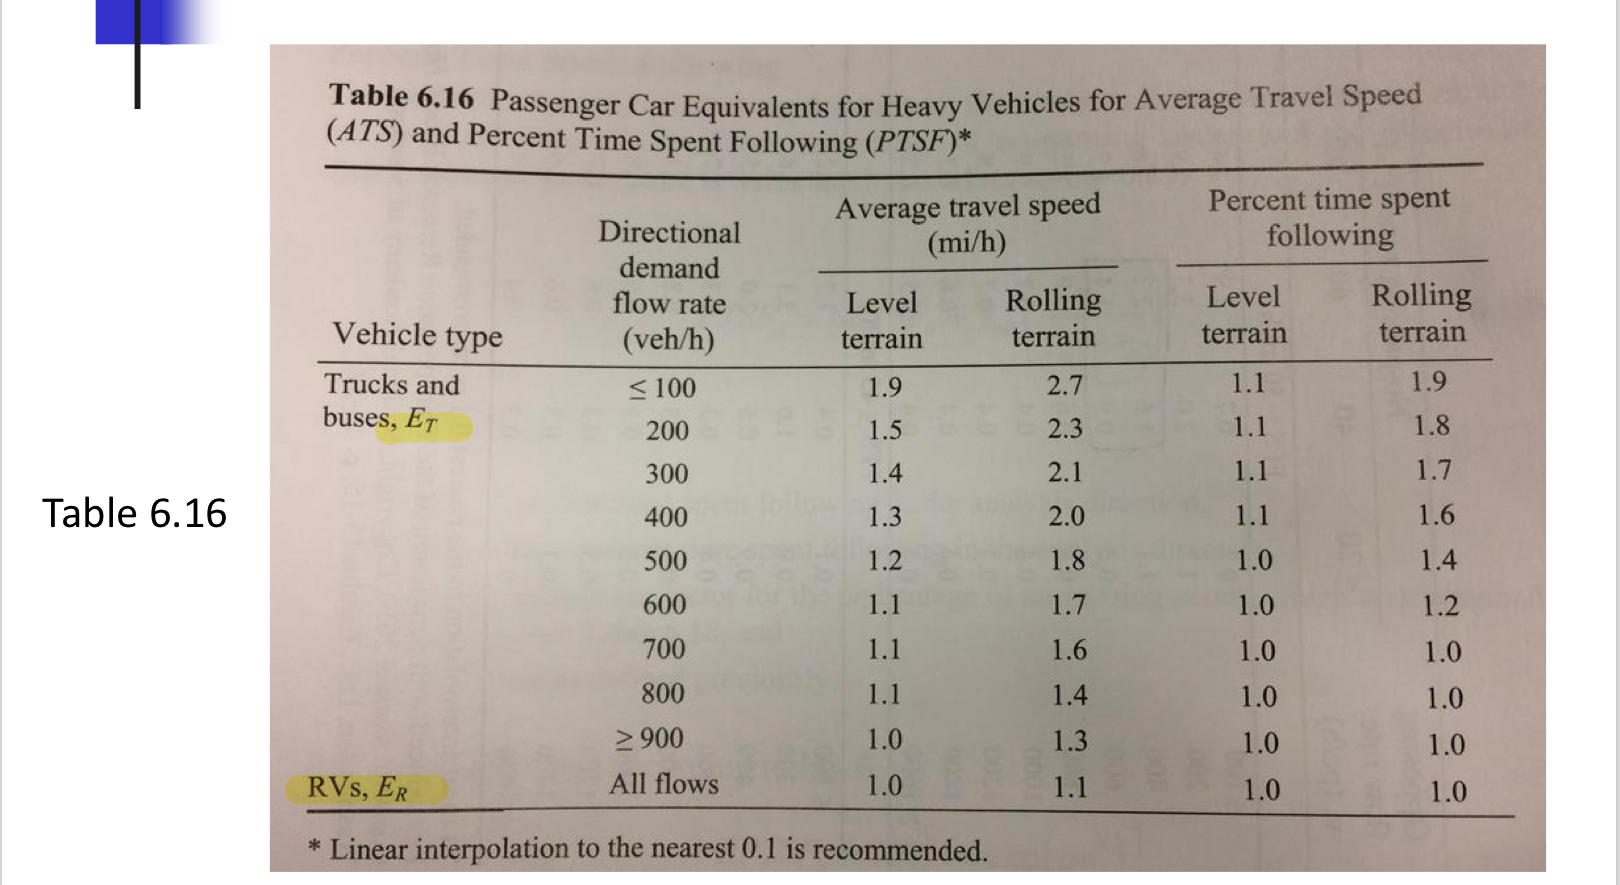
Table 6.17
two lane highway
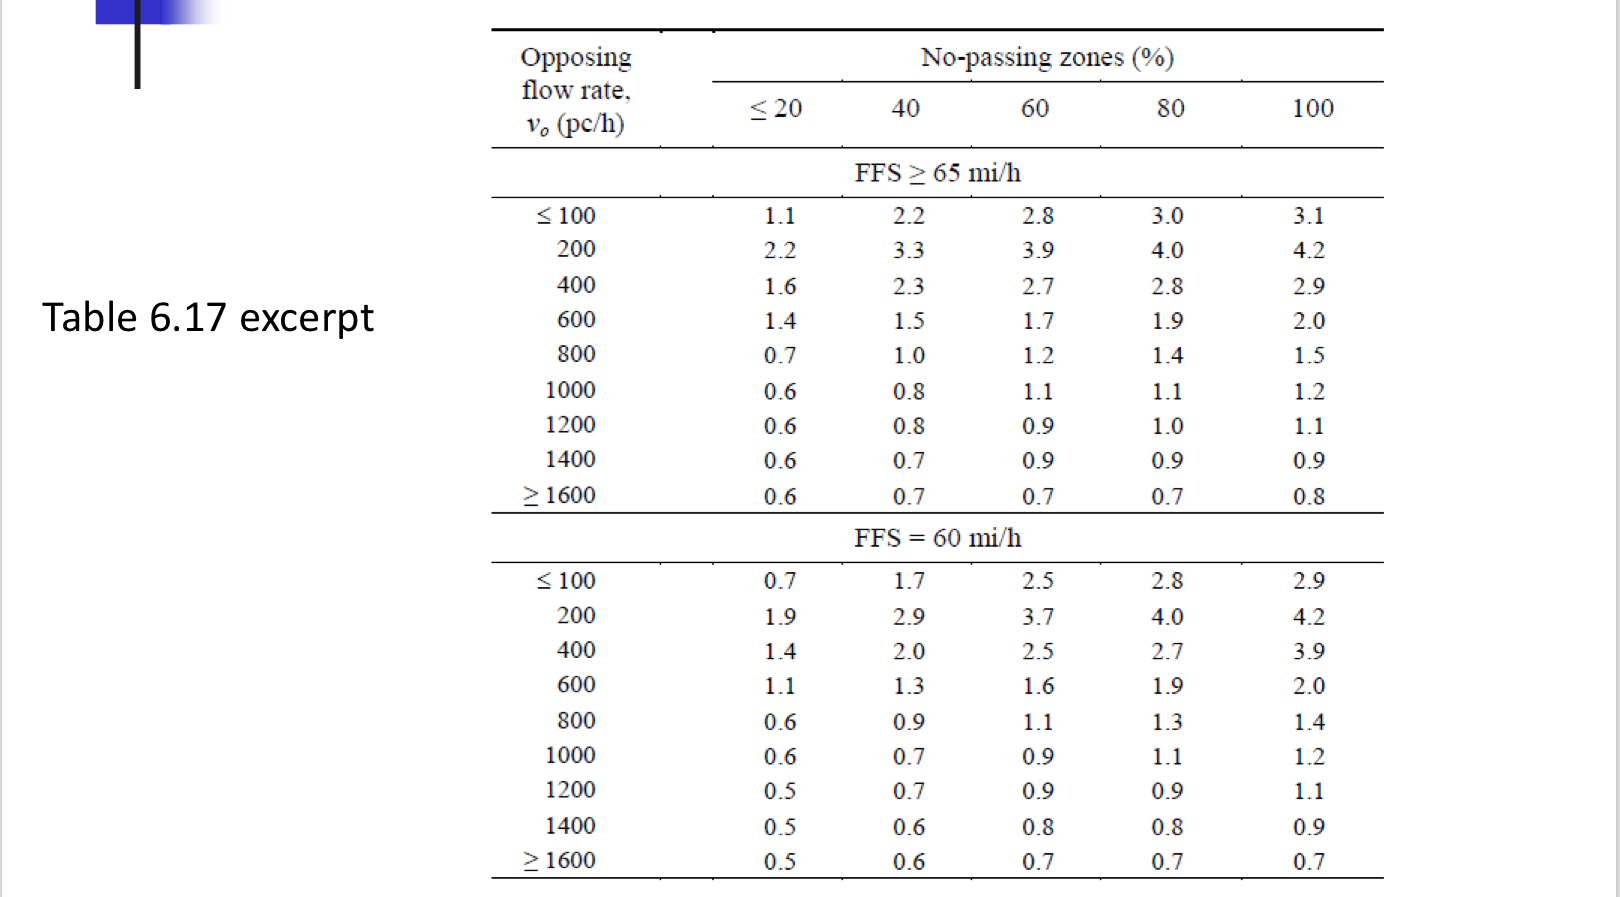
Table 6.18
two lane highways
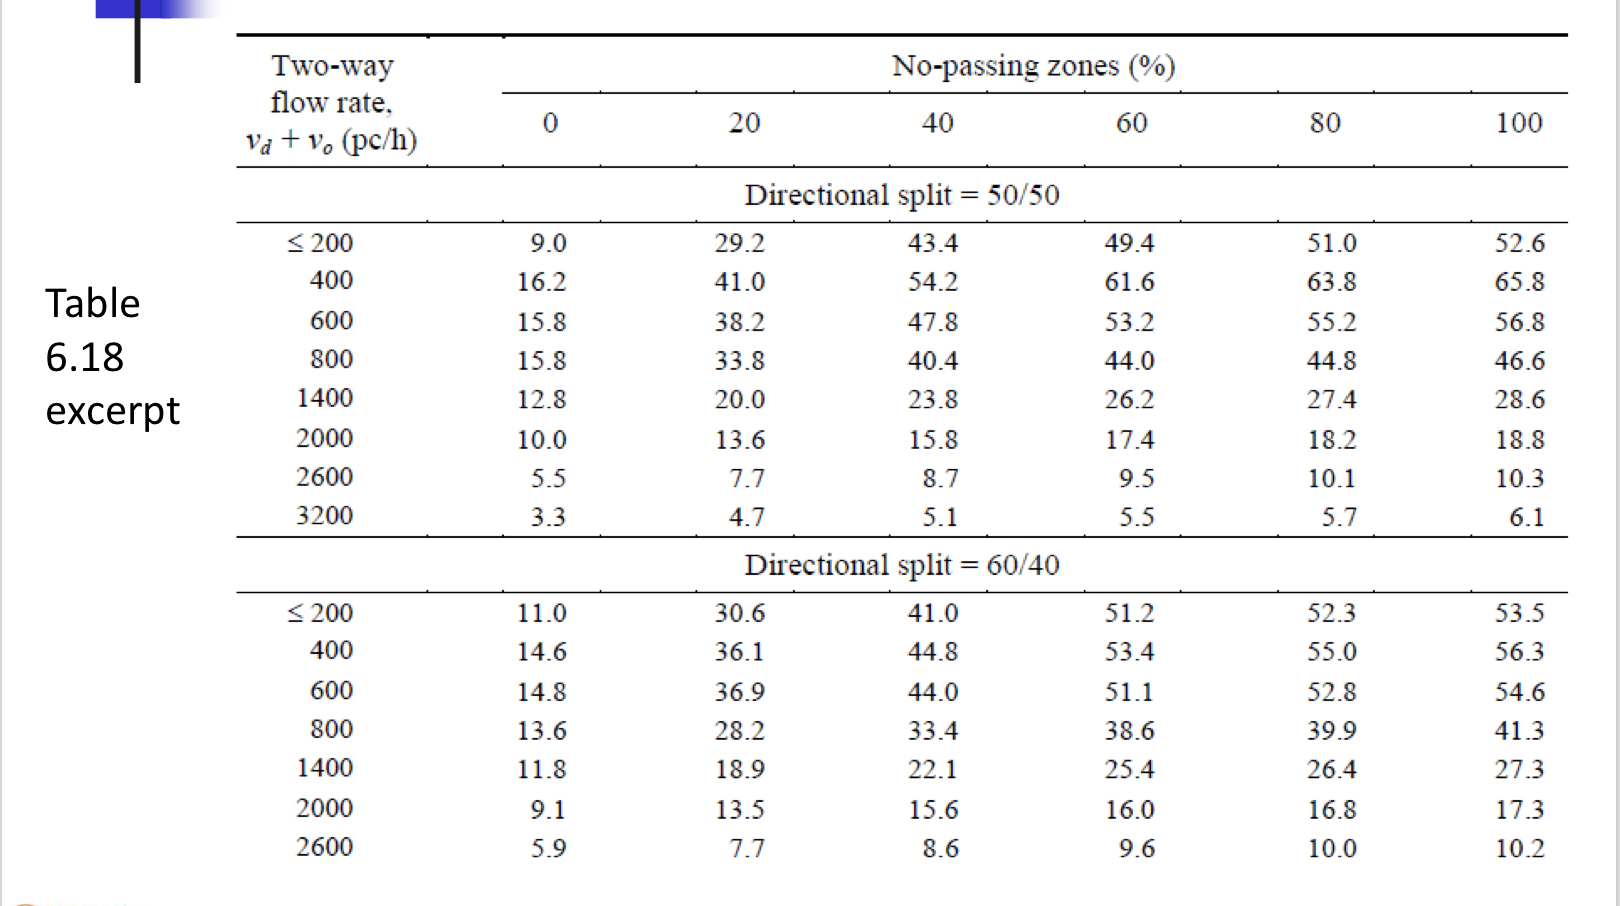
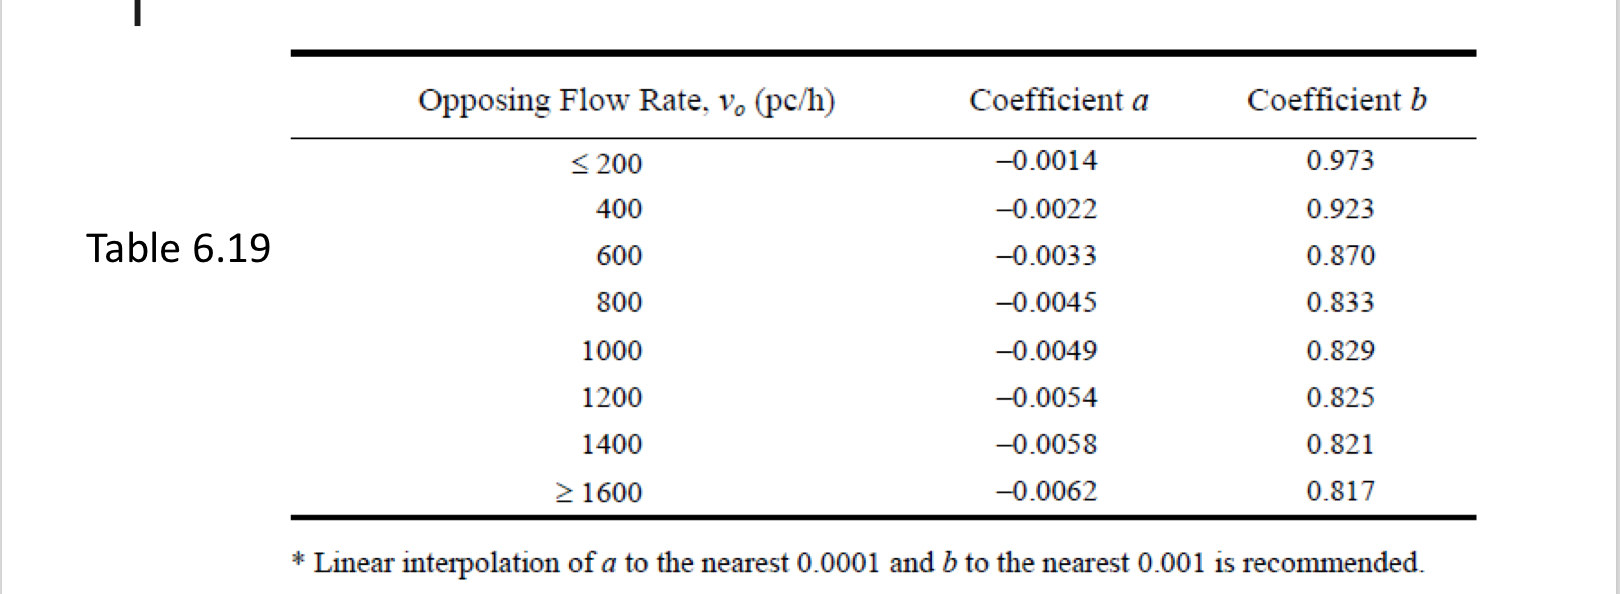
Table 6.19
two lane highways
