Populations and Ecosystems
1/67
There's no tags or description
Looks like no tags are added yet.
Name | Mastery | Learn | Test | Matching | Spaced |
|---|
No study sessions yet.
68 Terms
Niches
Each species in an ecosystem occupies its niche. A niche is the role of a species within its ecosystem or community – what it eats, where it eats and when it eats. Niches can be abiotic or biotic and niches can be separated by time, location, or behaviour.
Biotic Examples – what it eats and what organisms eat it
Abiotic Examples – the temperature range an organism can tolerate, the time of day it is active (e.g. nocturnal)
Organisms that occupy the same niches will compete as if they are the same species because they are sharing resources. If no interbreeding occurs the species with the highest birth rate will take over the niche and the other species will be competed out unless one can adapt to change their niche e.g. eat a different food source.
Examples:
Environment | Organisms | What makes the Niche different? |
Flying predators feeding on small flying insects. | Swifts and Pipistrelle bats | Time: swifts hunt in the day, bats at night |
Predators hunting grubs and small insects in trees. | Different species of Warblers | Spatial: Different Warblers are adapted to different temperatures and light intensities. Layer of the tree. |
Herbivores scavenging for high protein fruit and seeds from trees with the ability to store these to survive a large seasonal glut of the food source. | Red and Grey Squirrels | No difference: Grey Squirrels are hardier so outcompete the red squirrels in most environments as they occupy the same Niche. |
Top predators in the shore community (avian) who have omnivorous diets. | Flamingos, Ducks, Avocets, Oystercatchers, Plovers. | Behavioural: Each member of this community gathers food in a unique way. |
Bats flying and catching insects using echolocation in wooded areas in Britain | Common pipistrelle bat and Soprano pipistrelle bat | Physiological: the two types of bats use different frequencies for their echolocation so they will identify different insects. |
Problems with Investigating Niches
Experimental ecology is hard to do as the number of variables are very high and you can never replicate a proper ecosystem. Taking away variables does not mean you are controlling them and if these are influential, they might change your results.
The Experiment above shows how two bacterial species can show if they are competing because they share the same niche (competitive exclusion), or if they are uses resources differently so they have separate niches (resource partitioning).
Problem: If the results show competitive exclusion other factors may create separate niches in a real ecosystem, For example, if the mix of substrates they have been given in this experiment does not contain something that one of the species could metabolise in the wild so competition has been forced. Ecological experiments do not always represent what would happen in nature.
Similarly if you are observing animals in the wild and you try to claim you can identify their niche because you observed them feeding in different ways or feeding at different times you cannot always guarantee that other factors/variables are affecting what you recorded in a small window of time with one population.
Animals become Adapted to their Niche
An adaptation is a feature that members of the same species have that increases their chance of survvial and reproduction in their habitat. Organisms in a species with better adaptations to their environment are more likely to survive and reproduce and pass on the alleles that code for these adaptations – this increases the frequency of these alleles in the population. This process of natural selection means those adaptations become more common in the population, this can eventualy lead to evolution of a species.
Every species has had to adapt to use the ecosystem in a way no other species can – this is how they are able to occupy their own unique niche. Organisms are adapted to both the biotic (e.g specific predators) and abiotic (e.g temperature or amount of water) conditions of their ecosystems.

Explain the difference between community and population.
A community is populations of different species living in the same environment or habitat. A population is a group of the same species living in the same environment or habitat.
What is an ecosystem?
An ecosystem is all the organisms living in a community plus all the non-living abiotic conditions in the area (the habitat).
Name two ways in which an ecosystem is different to a community
An ecosystem contains non-living elements
Give a biotic and an abiotic factor that can affect an ecosystem and its inhabitants.
Biotic: competition, predation, pathogens. Abiotic: temperature, pH or soil or water, water availability
Write a definition for the term niche
The role of a species within its ecosystem or community
Why is it important the organisms occupy different niches?
To reduce competition and increase survival of both species
What is an adaptation and how do they occur?
An adaptation is a feature that members of the same species have that increases their chance of survvial and reproduction in their habitat. Occur through natural selection: Organisms in a species with better adaptations to their environment are more likely to survive and reproduce and pass on the alleles that code for these adaptations – this increases the frequency of these alleles in the population.
Give an example of two similar organisms and how they have adapted to occupy different niches.
Any from the table
In what ways can niches differ?
Niches can be abiotic or biotic and niches can be separated by time, location, or behaviour.
What is the problem with trying to demonstrate niche separation artificially?
The number of variables are very high and you can never replicate a proper ecosystem. Taking away variables does not mean you are controlling them and if these are influential, they might change your results.
Population
Population = all the organisms of one species in a habitat. Populations of different species come together to make up a community.
Predator-Prey Relationships
Predators are organisms which hunt and kill their food (they are always carnivores). They are specially adapted to successfully capture and kill their prey. As such over time a complex predator-prey relationship builds up. If conditions favour the prey, such as plentiful food, the prey will reproduce and increase in number. This then creates a large supply of food for the predator, so it is more successful and breeds increasing its number. This increase in predators causes hunting of the prey, reducing their numbers. This in turn reduces the food supply for the predators so their numbers decrease. The cycle continues.

Biotic and abiotic factors can change the numbers of predators or prey which can then increase or decrease the population of predators or prey in the food chain. Competition between different types of species can also reduce their numbers – when they must share food and space the populations will be smaller than when they don’t have to compete with other species in the same area.
Abiotic factors like temperature, chemicals (weed killer/pesticide), pH and light intensity can also affect organisms like insects and the plants they live on.
Population size
Population size is measured as the total number of organisms of one species in a habitat. Abiotic and biotic factors will affect the population size. An ecosystem can only support a certain population size that is stable. The maximum, stable population size of a species that an ecosystem can support is called the carrying capactiy (k). Because abiotic and biotic factors will affect the size of populations they also affect the carrying capacity of an ecosystem.
Abiotic factors which affect population size:
Amount of light, water or space available
Temperature
Chemical composition of their surroundings e.g. soil pH or mineral composition
When abiotic conditions are ideal for a species, individuals grow and reproduce successfully so population size increases. When abiotic conditions are not suitable for a species, organisms can’t grow as fast and they can’t reproduce as successfully so population size would go down.
Biotic factors which affect population size:
Biotic factors which affect population size:
1. Competition
Competition between organisms (plants or animals) of the same species is called Intraspecific competition. (Intra prefix means “within” so within your own species)
Competition between organisms (plants or animals) of different species is called Interspecific competition.
Interspecific competition
Interspecific competition occurs when different populations compete for the same resources e.g. food. If they are having to share a food source there will be less available for both so their population sizes will be limited as they will not be getting enough energy to grow and reproduce. If one species becomes better adapted to the surroundings e.g. more able to find or catch food, it can outcompete the other and that population will decline and could be wiped out from the habitat.
Intraspecific competition
Intraspecific competition occurs when individuals in the same population compete the same resources. It can cause cyclical change in the population size around the populations carrying capacity – where the population grows and shrinks then grows again.
Predator-prey relationships
Predation just means an organism killing and eating another as a source of food. The population sizes of predators and prey are interlinked as one changes it causes a change in the other. The hare and lynx example are often used to demonstrate this, but this is because they live in a very specific habitat where there are not many other predators or prey, so the food chain/web is very small. Predator prey relationships are usually a lot more complicated as there are multiple food sources for predators and multiple predators for each prey species. There are other factors also involved e.g. the availability of food for the prey. In the lynx and hare situation the initial decline after the peak of the hare population is because there is less food available (due to overeating) this is then accelerated by lynx predation as they are weaker and easier to catch!
Collecting data and interpreting graphs based on observations of predator/prey relationships:
Advantages: real interactions in an ecosystem are investigated and higher organisms can be tracked more easily.
Disadvantages: Causal relations can only be inferred
Interpreting carrying capacity graphs
When the population of a species is below the carrying capacity, the number of individuals will expand exponentially until the carrying capacity is reached. In many systems this results in an overshoot and then a further decline in the population.
Graph (A) shows fluctuations that can occur in a stable ecosystem that may well flatten out with a very fixed carrying capacity.
Graph (B) shows that there may be different carrying capacities in an ecosystem depending on human interactions with the environment (cultural carrying capacity).
Graph (C) shows a dynamic carrying capacity that changes due to the consumption of a resource by the species being monitored. This is often seen in bacteria – see experiment section next!

Investigating Carrying capacity
Experiment:
With enough food and space, the size of a population of microorganisms e.g. bacteria will grow at a steady rate – you can grow bacteria in a liquid containing nutrients that bacteria need to grow known as a broth. A nutrient broth containing growing bacteria can be called a broth culture.
A broth culture containing lots of bacteria will appear cloudy (turbid) so you can track the growth of the bacteria by measuring the turbidity (cloudiness) using absorbance or transmission of light with a spectrophotometer.
If you plot a graph of absorbance against time you can get an exponential graph (Fig 5) as the bacteria should double at regular intervals. As the absorbance is directly proportional to the number of bacteria in a sample you can convert the figures and draw a graph to show how the population of bacteria changes over time. You will need to use a log of the number of bacteria at each point and plot the graph using a log scale (See maths skills section). You can use the graph (Fig 6) to find the bacterial population at any given time on the x axis.
Advantages: causal effect of a factor on population size can be more easily identified
Disadvantages: hard to investigate realistic complicated systems as would be seen in nature.
Interpreting bacterial growth graphs:
The graph shows a typical growth curve from bacteria in a closed system (for example a conical flask). There is a lag as the bacteria adapts in cellular machinery to the environment, then an exponential phase until a carrying capacity is reached. As this is a closed system, the nutrients are used up, waste builds up and population declines as the carrying capacity lowers – the death phase.

What is the carrying capacity of a population?
The maximum stable population size of a species.
Sampling Techniques
To study an ecosystem ecologists need to know the abundance (how many) and the distribution (where) of organisms in an area.
Measuring these allows scientists to investigate how biotic and abiotic factors effect an ecosystem.
It is impossible to measure the exact amount of organisms in large areas so ecologists use sampling techniques to estimate the actual number.
Random sampling
Random sampling is a way of eliminating personal choice (bias) in the selection of a sample. For a sample to be random every part of your sample area should have an equal chance of being sampled every time you go to take a sample. Throwing a quadrat is not truly random as the whole area will not be equally as likely to be sampled it is restricted to your throw distance.
There are two main sampling techniques; Quadrats and Transects.
Quadrats = random sampling
A quadrat is a simple square frame that is placed randomly on the ground to count the number of plant species. It is then moved to a different random location and the process is repeated.
Only species completely within the frame are counted each time.
It is important that as many quadrats as possible are taken during the sampling to ensure the result are accurate. More quadrats would make a larger sample so the data would be more accurate.
It is also important that they are placed randomly to avoid bias. This can be achieved using a grid system and a random number generator or picking numbers out of a hat to select coordinates.
Once a large number of results have been recorded a mean can be calculated.
Transects = systematic sampling
Transects involve a tape measure being placed along a varied stretch of habitat (eg a coastline from sea to beach) and using a quadrat to record species at regular intervals along the line. Transects allow scientists to see how the distribution of a species changes as the habitat changes and is a useful way of investigating how abiotic factors affect a species.
Percentage frequency
Percentage frequency is the probability that a species will be found within a single quadrat.
% frequency = number of quadrats in which the species is found total/number of quadrats
Percentage cover
Percentage cover is faster but is more subjective. Simply estimate what percentage of the area enclosed by the quadrat is occupied by each species. One drawback of this method is that plants in flower tend to be over-estimated while low-growing plants are under-estimated.
Local frequency is easiest to measure if you have a gridded quadrat of 10 x 10 squares. For each species, count the number of squares which are at least half-occupied. The final figure (which will vary between 1 and 100) is the local frequency. This method is more time consuming than estimating percentage cover, but the results should be more accurate, as there is less risk of over-estimating some plants and under-estimating others.
Transect Types
Transects are really used to investigate the distribution of organisms across an area where there is often a change in habitat or abiotic factor. There are two types: Belt transects where quadrats are placed next to each other or interrupted transects where quadrats are spaced at regular intervals. This is faster and allows greater distance to be covered but less informative.
Sampling motile organisms
If you need to estimate populations of organisms in an area that move (are motile) you need to use equipment to capture them so that you can count them. The best method will depend on what organisms you are catching, where and over how long. It should also be ethical so as not to harm or stress the organisms too much – we will mention more about this later.
There is a range of equipment you can use including pooters (collects small insects by drawing them into a holding chamber by sucking on a mouthpiece), pitfall traps and sweep nets can be used for small insects, aquatic animals in larger nets, or Longworth traps (for larger mammals). Regardless of the equipment or environment the mark-release-recapture method is normally used to estimate the populations.
Mark-release-recapture technique
The size of populations of invertebrates or small mammals in an area can be estimated using mark-release-recapture technique.
A sample of animals is captured, counted and marked in some way. These are then released and allowed to re-mix with the population. A second sample is taken later. The population can be estimated from the proportion of marked animals in the second sample.
Method:
Take a sample from the population using appropriate equipment and count them.
Mark them in a harmless way e.g spot of paint (Figure 8) or using an identification tag (Figure 9)
Release them back into their habitat - you now know how many marked animals there are in the population.
Wait long enough for the marked animals to mix randomly with the rest of the population, at least 24hrs.
Take a second sample in exactly the same way as the first. Record (a) the total number of animals in the second sample, and (b) the number of marked animals in the second sample (recaptures)
Calculation to estimate population size:
You can now calculate a population estimate. If the animals have been mixing randomly, then the proportion of marked to unmarked animals in the population should be the same as the proportion of marked to unmarked animals in the second sample.

This method relies on assumptions!
Several assumptions made when estimating the size of population by mark-recapture. Some are more realistic than others:
The population is closed. In other words, there is no migration into or out of the population. In addition, it assumes there are no deaths or births in the time between the first and second capture.
Births and deaths can be either real or virtual. A real death happens when the animal actually dies while a virtual death means the animal is no longer available for sampling. Perhaps it has gone into hibernation or like a caterpillar has turned into a pupa.All members of the population mix randomly. In other words, each member of the population has an equal chance of capture. However, this may not be the case for everything. For example, male mice and voles are inquisitive and more likely to enter a trap then females. Lactating females are going to stay close to their nests, so you may effectively only be sampling from half the population.
The marks do not rub off or tags are not lost/removed between captures.
The mark does not harm the animal or affect its survival in another way. Does painting nail varnish onto a snail's shell make it more obvious to a predator like a bird?
Ethical considerations:
Some people think that capturing is unethical as it may cause stress. Handling should be kept to a minimum and all organisms treated carefully and with respect. If animals are put under too much stress during capture it could reduce their chances of survival after release or cause them to be wary and avoid traps in the future so this can affect the accuracy of the estimations of population size.
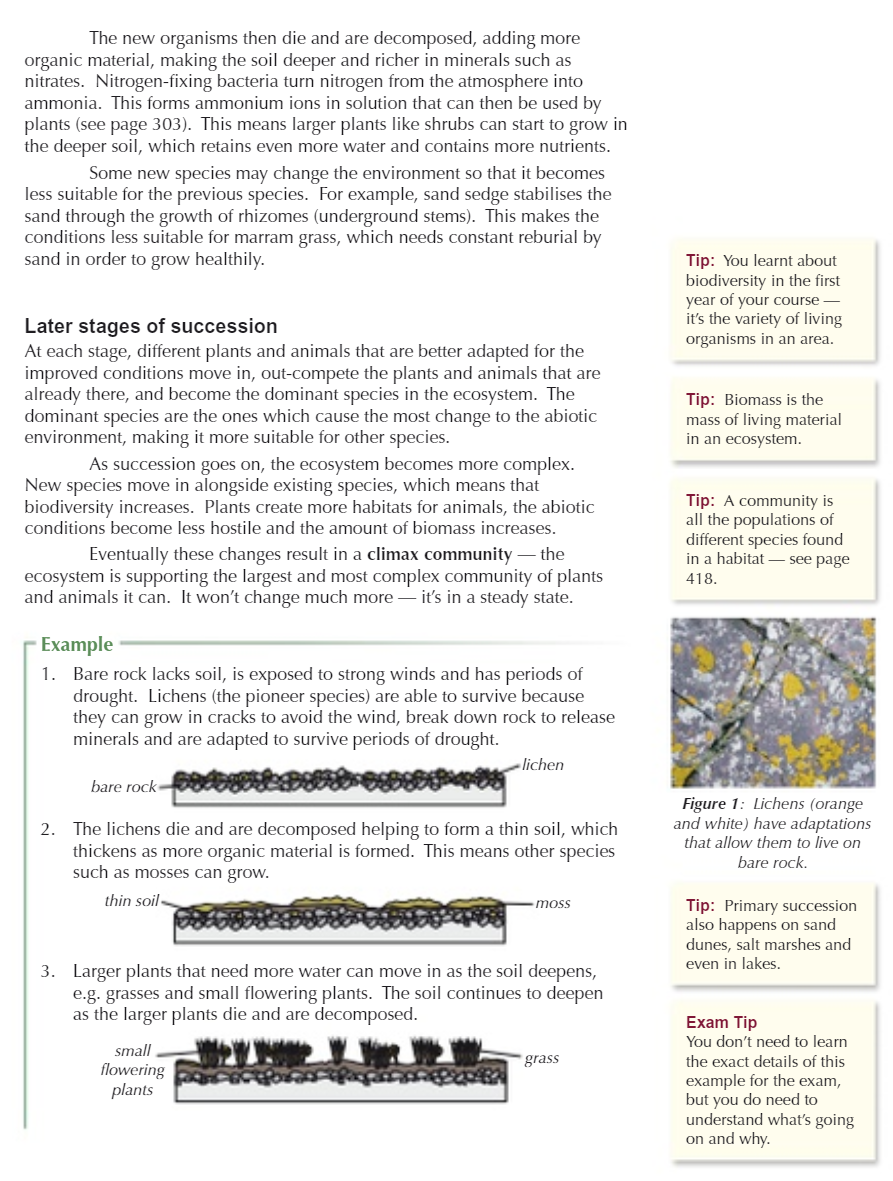
Succession


Biodiversity
Biodiversity is the variety of all the different species of organisms on earth, or within an ecosystem.
It is important to maintain biodiversity because:
We have a moral responsibility not to destroy the planet
Animals and plants can be useful for the development of medicines
Aesthetic reasons (nature is beautiful)
We need to conserve ecosystems so that the planet functions (i.e. we rely on microorganisms for the breakdown of waste/ recycling of nutrients).
It is important to ensure that human developments and activities are sustainable in order to ensure that sufficient resources are available for future generations. Many human activities reduce biodiversity (deforestation, peat extraction, pollution) and only recently have measures been taken to try to stop this reduction.

What can we do to help maintain biodiversity?
Have breeding programmes for endangered species
Protect and regenerate rare habitats
Reintroduce hedgerows in agricultural areas where farmers grow only one type of crop to increase biodiversity by increasing niche number
Reduce deforestation and carbon dioxide emissions by governments
Reduce, reuse and recycle resources rather than dumping waste in landfill
What is conservation?
Conservation is the protection and management of species and habitats in order to maintain biodiversity. There is often a conflict between human needs and conservation – careful management is needed to find a balance to maintain the sustainability of natural resources. Sustainable means that enough resources are taken to meet current needs of humans without reducing the ability to meet human needs in the future.
Conservation Methods
Conservation is dynamic process and methods need to adapt to changes caused naturally or humans that occur within ecosystems.
1 - Management of Succession
Conservation of habitats frequently involves the management of succession. If an area is left undisturbed, successional change will, in theory, eventually lead to the establishment of a stable climax community. Particular species and habitats present at earlier stage of succession will no longer be present. Maintaining a particular habitat may involve deliberate interference to prevent the ecosystem developing further. This could include animals grazing on moorland to prevent large shrubs or trees growing and keeping vegetation low or setting managed fires to allow secondary succession to occur so that pioneer plant species are being conserved as they will grow back first tree species will not have time to grow back before the next burning.
2 – Seed banks
A seed bank is a store of seeds from lots of different plant species, they act as a back up for conservation of plant species in the wild so that plants can be reintroduced if they go extinct.
Seed banks are good because they can conserve a large number of species in a small space. However, seeds will not always be viable (will not be able to germinate) after long periods of time in storage so they have to be regularly tested.
Seed banks also store crop seeds to allow us to reintroduce genetic variation and varieties if inbreeding causes an issue for example: if a disease wipes out a particular genotype of crop – other varieties can be grown and crossbred to increase allele number and potentially help develop resistance.
3 – Captive Breeding Programmes
Captive breeding programmes involve breeding animals in controlled environments like zoos. This is mostly done for species that are endangered or extinct in the wild, the idea is that numbers can be increased and so the species will not be entirely extinct.
Problems – animals aren’t always as likely to breed in captivity as well as in the wild (e.g pandas) and reintroducing animals to the wild is difficult and not always ethical as they may not be able to look after themselves if they have spent time in captivity and may not be wary enough of humans to avoid poachers or local villages/towns where they may be killed. Reintroductions can also have effects on other species.
4 – Fishing quotas
Fishing quotas restrict the amount of a certain fish species that is allowed to be caught. It is often unpopular with fishermen as it affects their income as well as there being lots of demand for fish for food in many countries. Some ships fish over their quota then throw back the extra which are dead so they do not get fined. In order to make fishing truly sustainable international cooperation is needed for quotas to be effective where ships from different countries fish in the same area.
5 - Protected Areas
The IUCN (International Union for the Conservation of Nature) define a protected area as "a clearly defined geographical space, recognized, dedicated and managed, through legal or other effective means, to achieve the long-term conservation of nature with associated ecosystem services and cultural values”. In other words, protected areas are defined areas in which the natural environment is protected by people and/or the law so that people can benefit from it without destroying it through building, industry (e.g fracking) and farming.
Many parts of the UK have designated status – legal protection to conserve important habitats and species.
POPULATION GENETICS
Genotype and phenotype.
When we describe how different organisms appear or look, we are describing their phenotype – their observable characteristics. A characteristic is an observable (can see it or measure it) quality, trait or feature of an individual e.g hair colour, eye colour, flower colour, leaf shape.
Different forms of the same gene are known as alleles. An organism’s genotype is the alleles an individual has for a certain characteristic.
Alleles
There are two copies of every chromosome in a body cell nucleus (one copy inherited from the mother the other copy inherited from the father).
Therefore, there are two copies of every gene. These may have different alleles and the combination of the two alleles (the genotype) determines the characteristic (the phenotype).
In this example there is a gene for flower colour, this plant has two copies of the flower colour gene one on each chromosome. This plant has two different alleles (versions of the flower colour gene) one allele codes for purple petals the other codes for white petals.
For most genes, one allele is said to be dominant and the other recessive. Only one dominant allele needs to be present for the dominant phenotype to be expressed. This means individuals that have two dominant alleles OR one dominant and one recessive allele will express the dominant phenotype. Two copies of recessive alleles need to be present for the recessive phenotype to be expressed. Due to this relationship, we often refer to the alleles using the same letter, the dominant in UPPER case and the recessive in lower case e.g. “B” is dominant, “b” is recessive.
Homozygous and Heterozygous
If the two alleles of a gene are the same, the individual is described as homozygous. Example: BB or bb
If two alleles of a gene are different, the individual is described as heterozygous. Example: Bb
Example: The gene for flower colour in pea plants has two alleles, purple and white. The purple allele is represented by “P” and the white allele by “p”.
Human cells
Human cells are diploid – they have two copies of each chromosome (one from each parent). This means there are two alleles for each gene, the fixed location of each allele on each chromosome is called its locus (loci pl.)
Remember– gametes are haploid so they only have one allele for each gene. When the parental chromosomes from each gamete come together in the nucleus of a fertilised embryo the diploid genotype is created. Genetic diagrams can be used to predict the genotypes (and therefore phenotypes) of offspring that cold be produced from two parents are crossed. The first set of offspring of two parents is called the F1generation.
Monohybrid Inheritance
This inheritance is the simplest as it involves characteristics which are controlled by a single gene. Monohybrid crosses show the probability of the alleles of that gene being inherited by offspring when two parents are crossed.
The outcomes will be different depending on the parental genotypes, however there are some predictable outcomes. The phenotypes of the offspring are expressed as phenotypic ratios):
If both parents homozygous e.g GG and gg = all offspring will be heterozygous (Gg) ratio = 100% and all have the same phenotype (e.g green pods)
If both parents Heterozygous e.g Gg = offspring will be GG:Gg:gg in a 3:1 ratio of phenotypes (e.g green:yellow pods)
The offspring of the first generation are known as the F2 generation.
The expected ratios are not always what is observed in actual offspring however, there are many reasons:
Fertilisation/fusion of gametes is random
Co-dominance
Sex-linkage
Samples taken from small populations
Remember: Meiosis also produces genetic variation in gametes due to:
Crossing over between chromatids which produces different combinations of alleles
Independent assortment of chromosomes which produces different combinations of maternal and paternal alleles
Codominance
Alleles can be codominant if they are both expressed in the phenotype as neither one is recessive. It can mean that both appear in the phenotype, or they can make a blend. You write the main gene as the normal capital letter (e.g C for flower colour) then the alleles are superscript (above) and they are also capitals because neither is recessive (e.g. CR or CW)
Dihybrid Inheritance and Multiple Alleles
Multiple allele crosses are when a gene has more than two alleles, it is a type of codominance. There are many characteristics where there are not simply two versions e.g hair colour, eye colour, coat/fur colour, and blood group.
The immunoglobulin gene (I) codes for the antigens on the surface of the red blood cells. There are three types which lead to different antigens: IA, IB, and IO. There are two homologous chromosomes that cause this, therefore two loci. IA and IB are codominant, but IO is recessive to both. People can be one of four different blood groups as seen in the table
Dihybrid Crosses
Dihybrid crosses is when two characteristics are inherited from two different genes which have different alleles. These can show the probability of inheriting certain combinations of two different characteristics from their parents.
For example, the gene for seed shape has two alleles: R for round (dominant) and r for wrinkled (recessive).
The seed colour gene also has two alleles G for yellow seeds (dominant) and g for green seeds (recessive).
The diagram shows that we express the diploid parental genotypes using four letters, to represent the two alleles on each chromosome:
RRGG = homozygous dominant for each gene
rrgg = homozygous recessive for each gene.
The gametes they can produce are simple because they will only be able to pass on the same allele for each gene: RG and rg. All offspring will be heterozygous and have round yellow seeds (RrGg).
It gets more complicated when heterozygous parents are crossed because there are four possible gametes from each parent, however there is an expected phenotypic ratio of 9:3:3:1. As before the expected ratio is not always observed because of other factors, in this case linkage or epistasis.
Sex Chromosomes
Genetic information for biological sex (male or female) is carried on two sex chromosomes – in mammals these are the X and Y chromosomes. Males usually have one of each chromosome XY and females have two copies of the X chromosome XX. Other organisms use different letter combinations! The punnet square shows that the probability of having male or female offspring is 50%.
If you are asked to predict the probability of getting a female or male child with a certain characteristic e.g. a blue-eyed girl then you just need to work out the probability of getting a child with the required characteristic then divide by two as the chance of getting a male or female is always 50%.
Sex-linkage
Some characteristics are coded for by genes that are only found on the sex chromosomes not autosomes, this means that they are sex-linked. There are some specific patterns:
The Y chromosome is smaller than the X chromosome and carries fewer genes | This means that most of the sex-linked genes are found on the X chromosome and are called X-linked e.g colour blindness and haemophilia. There are some Y-linked genes but they are rare. |
Males only have one copy of the X chromosome | This means that they only have one allele (copy) of each sex-linked gene. This means they express the characteristic of this allele even if it is recessive. This makes it more likely that males will have recessive phenotypes than females. This also means that males cannot be carriers of X-linked genes. |
All Y chromosomes are inherited from fathers | This means that males must always inherit their X chromosome from their mothers. So, any sex-linked genes will have been passed on from female parents. |
Females have two copies of the X chromosome | This means that females will always have two alleles of every X-linked gene, this means that unless they have two copies of a recessive allele they will always have a dominant allele which will be expressed. |
Example 2: Colour Blindness
Colour blindness is also a sex-linked disorder caused by a faulty gene found on the X chromosome. If a female carrier and an affected male have children, there will be a 50% chance of producing a child with colour blindness or 1:1.
Autosomal Linkage
Genes on autosomes can also be linked. Most genes on separate chromosomes are assorted independently so the allele received for one gene does not affect the allele received for another, this results in the typical 1:1:1:1 ratio or 9:3:3:1 ratio for a dihybrid cross as there are four outcomes.
If two genes are found close together on the same chromosome, they are more likely to be inherited together as they will stay together during independent segregation of chromosomes in meiosis I and enter the gametes on the same chromosome. This will produce an unexpected ratio as there are only two outcomes, so there are more gametes which contain the linked genes (parental) and fewer where they are separated (recombinant). Recombinant gametes will only be formed through crossing over in meiosis I. So having recombinant gametes with linked genes is evidence that crossing over has occurred.
Crossing over can put new alleles together in combination on the same chromosome. When genes are far apart, crossing over happens often but crossovers between two genes that are close together are not very common. This is because when there is a very short distance between genes the "target" for crossover is very small meaning that few such events will take place.
The closer together the loci are on the chromosome the lower the chance of a chiasma forming between them to separate them. This information can give an indication of how close two genes are on a chromosome.

Epistasis
Many different genes can interact to control the same characteristic, multiple alleles are caused by mutations at different positions on the gene. When these alleles mask or suppress the expression of genes at a different locus it is called epistasis. There are a few different examples of interactions, a lot involve visible phenotypes such as colour which is caused by pigments that can be changed by enzymes. Enzymes that change the colours are coded for by genes.
Epistasis will produce different variations on the 9:3:3:1 expected ratio of a dihybrid cross with unlinked genes.
Recessive epistasis occurs when the presence of two recessive alleles at the first locus will prevent the expression of the allele at the second locus. For a cross between homozygous recessive and homozygous dominant parents the ratio in F2 offspring is 9:3:4. | Dominant epistasis occurs when having at least one allele of the gene at the first locus will block the expression of the gene at the second locus. This time if you cross a homozygous recessive and homozygous dominant parent the ratio of F2 offspring will be 12:3:1. |
Example: Fur colour in mice Aa/AA = agouti, aa = solid black Bb/BB = gene A expressed bb masks A so no colour (bb = white) So, the phenotype of Gene A is masked by two recessive alleles of gene B and will only be seen if a dominant allele of the B gene is inherited. | Example: Fruit colour of squash AA/Aa = yellow, aa = green BB/Bb = masks gene A so no colour (BB/Bb = white) bb = gene A expressed So, the phenotype of Gene A is masked by dominant alleles of gene B and will only be seen if two recessive alleles of the B gene are inherited. F1 phenotype F1 gametes F2 genotypes F2 phenotypes |
Population genetics
A population is a group of organisms of the same species occupying a particular space at a particular time that can potentially interbreed. The total number of alleles that are present in that population would be known as the gene pool and the allelic frequency would be the proportion of a certain allele in the gene pool relative to the other alleles for that gene expressed as a decimal or percentage.
The Hardy-Weinberg equation can be used to estimate the frequency of alleles, genotypes and phenotypes in a population to see whether any changes are occurring over time. The principle states that the allele frequency in a population will not change from one generation to the next if the following assumptions are true:
That no mutations occur (no new alleles are created)
There is no movement of alleles into or out of the population due to migration of organisms
The population is suitable large
There is no selection occurring (so all alleles have an equal chance of being inherited)
Mating is random (all possible genotypes can breed with all others)
If frequencies do change between generations then it suggests that there is an influence, e.g selection of some kind.
There are two formulae that you need to know:
p + q = 1.0 and p2 + 2pq + q2 = 1.0
This makes sense because:
P = the frequency of the dominant allele (A)
Q = the frequency of the recessive allele (a)
So:
P2 = frequency of AA (homozygous dominant)
2pq = frequency of Aa (heterozygous)
q2 = frequency of aa (homozygous recessive)
Both are designed to be used where a gene has two alleles. To work out frequencies you need to know which allele is dominant and which is recessive then you can work all the rest out!
Allele Frequency
When looking to calculate allele frequency e.g the frequency of a dominant allele relative to a recessive one then you would use p + q = 1.0. If a frequency of an allele is 0 then no organisms have that allele, if it 1 then it is the only allele in the population. If it id 0.5 then it makes up half the alleles in the gene pool, the other allele for that gene will make up the other half.
Phenotype/Genotype Frequency
When looking to calculate a genotype or phenotype frequency you need to use p2 + 2pq + q2 = 1.0. You need to be careful and make sure you know whether you have been given genotype or phenotype in the question. E.g if you are asked to calculate the frequency of red hair and this is caused by a recessive genotype then you are trying to calculate q2. But if you are looking for the frequency of a phenotype caused by a dominant allele like brown hair then you will be looking for p2 + 2pq as both of these genotypes can result in the brown hair phenotype.
If you know p or p2 (or q or q2) we can work out all the rest, using the two equations.
Example: The frequency of the homozygous dominant phenotype is 50%.
We know p2 = homozygous dominant so p2 = 0.5
We can work out p by square rooting. So, p = 0.7
Now we’ve got p, we can work out q using the first equation:
p + q = 1 so q = 1 – 0.7 = 0.3
Now we have p and q we can find out the frequency of any of the other genotypes or phenotypes:
Homozygous recessive genotype/recessive phenotype = q2 = 0.32 = 0.09
Heterozygous = 2pq = 1 – 0.5 – 0.09 = 0.41
Dominant phenotype = p2 + 2pq = 1 – 0.09 = 0.91
Check: does it add up to 1? 0.5 + 0.41 + 0.09 = 1
Tips:
For If the frequencies for two alleles add up to more than one the then they are not alleles for the same gene. If they come to less than one, then there are more than two alleles for that gene.
You can use these equations on codominant alleles or if you don’t know which allele is dominant or recessive. Just assign each allele to a letter and if you are consistent then it will work out ok.
Task | Question | Method/Equation to use |
Predicting allele frequency | There are two alleles for flower colour (R and r), so there are three possible genotypes-RR, Rr and rr. If the frequency of genotype RR is 0.56 in Population X, what is the allele frequency of r? | Looking for allele frequency of recessive allele So use the simple equation to find q |
Predicting genotype frequency | If there are two alleles for flower colour (R and r), there are three possible genotypes RR, Rr and rr. In Population Y, the frequency of genotype RR is 0.34 and the frequency of genotype Rr is 0.27. Find the frequency of rr in Population Y. | rr is the homozygous genotype so it is equal to q2 So use the large equation to find q2 |
Predicting phenotype frequency | If R is dominant and r is recessive, then a plant with a red flower phenotype could have the genotype RR or the genotype Rr. Plants with the genotype rr will have a white flower phenotype. In population Z, the frequency of the genotype Rr is 0.23 and the frequency of the genotype rr is 0.42. Find the frequency of the red flower phenotype in population Z. | The frequency of plants with red flowers in Population Z is equal to the genotype frequencies of RR and Rr added together. So use the large equation to find p2 = 2pq |
Predicting the % of a population that will have a certain genotype | The frequency of cystic fibrosis (genotype ff) in the UK is currently approximately 1 birth in 2500. Use this information to estimate the percentage of people in the UK that are cystic fibrosis carriers (Ff). | Need to find the frequency of the heterozygous genotype Ff So use both equations to find 2pq (You can't just use the large one as you only know one of the three - q²) |
Show if external factors are having an effect on allele frequency | If the frequency of cystic fibrosis is measured 50 years later it might be found to be 1 birth in 4500. Use this information to decide if the Hardy-Weinberg principle applies to this population. | Need to estimate the frequency of the recessive allele in the population So use 1/4500 = q2 to find q If this has changed then HW no longer applies |
Causes of variation
Variation is the differences that exist between individuals in a population, most variation is due to individuals having different combinations of different alleles producing different phenotypes. Variation can be caused by environmental or genetic causes, but most is caused by a combination of both:
Environmental | Genetic |
|
|
Natural Selection
Natural selection is one process that drives evolution, the other is genetic drift. In a population not all organisms will survive and be able to reproduce (they will have low fitness). Some individuals will die or fail to reproduce due to predation, disease or competition for resources (food, water, space, mates, light). These are known as selection pressures.
Organisms with variations that make them more likely to survive are said to have a selective advantage. They are more likely to reproduce and pass on those alleles to the next generation, so these favourable alleles increase in frequency in the gene pool. Evolution is the change in the frequency of a gene in the population. If selection pressures are different for different populations, then evolution can occur, and new species can emerge once the populations can no longer interbreed.
Summary of how natural selection drives evolution:
There is variation in a population
Due to mutation some individuals have favourable alleles which help them to survive and reproduce
They pass on these favourable alleles to offspring, so the frequency of these alleles increases
If no interbreeding with other populations occurs, then new species can be formed
Variation in a population can be shown as a bell-shaped curve of the frequency of phenotypes.
Natural selection favours allele combinations which produce advantageous phenotypes depending on the environment. Changes will promote or eliminate certain genotypes and therefore phenotypes.
Types of Natural Selection
Stabilising | Directional | Disruptive |
|
|
|
Mean stays in the middle but the range of phenotypes is reduced. | Mean moves in a direction away from the original (mean= 6 before) | Mean in the middle decreases and range increases (opposite of stabilising) |
Example: Robins typically lay four eggs because larger clutches may be harder to feed and result in malnourished chicks whereas smaller clutches may result in not enough offspring hatching. Stabilising selection maintains the average clutch size of four eggs. | Example: Light coloured moths are better camouflaged against clean trees whereas dark coloured moths are better camouflaged in a sooty environment. As the industrial revolution produced more sooty trees in England the peppered moth population shifted from light to dark | Example: In a hypothetical population grey and white and grey rabbits are better able to blend in with their rocky habitat in the Himalayas than white rabbits, this results in diversifying selection as the number of white rabbits reduces due to predation. |
Speciation
Speciation is when a new species arises from an existing species due to certain conditions. It occurs when populations of the same species become reproductively isolated from each other, this means that they can no longer interbreed to produce fertile offspring.
Natural selection can result in new species but so can speciation and genetic drift because they also result in changes in the allele and phenotype frequency. There are two types of speciation which cause reproductive isolation:
Allopatric Speciation | Sympatric Speciation |
|
|
Example: Darwins finches which became separated on islands of the Galapagos with different food resources. Over time their beaks changed as they specialised to eat one type of seed, this eventually led to them becoming separate species. | Very rare as it is difficult for a section of the population to become completely reproductively isolated from the rest without geographical isolation. Example: mutation causing polyploidy (change to the number of chromosomes). |
Mechanisms of reproductive isolation
Reproductive isolation occurs because changes in alleles, genotypes or phenotypes prevent individuals from successfully breeding with individuals which don’t have the changes. These can include:
Temporal changes
Different breeding/flowering seasons or becoming sexually active at different times of the year – no breeding can occur as they are not active at the same time
Feeding times e.g nocturnal vs diurnal – no breeding can occur as they are not awake at the same time
Mechanical changes
Physical mismatch of reproductive parts – change in size, shape or function can prevent successful mating
Gamete incompatibility – e.g sperm killed in female’s reproductive tract or polyploidy (mutation causing different number of chromosomes) prevents gametes from fusing and producing viable embryo.
Behavioural changes
Different courtship displays e.g change in song – prevents members of the opposite sex being attracted to each other so no mating occurs
Genetic Drift
Evolution occurs by natural selection but it can also occur due to genetic drift. Genetic drift is not influenced by environmental factors creating selection pressures which determine the survival and reproduction ability of organisms, what alleles get passed on is due to random chance. It is often due to only some of each generation in the population reproducing.
Mechanism:
Individuals in a population show variation in genotypes
By chance an allele for one genotype is passed on to more offspring than the others. So the number of individuals with this allele increases in frequency in the population.
If by chance this same allele is passed on more often over repeated generations then this can lead to evolution as the allele changes in frequency in the population.
This is more apparent in small populations because chance changes have a greater influence on the gene pool. It can also be the reason for changes in allele frequency between isolated populations and could eventually lead to reproductive isolation and speciation.
Evolutionary Diversity
Speciation and evolutionary change over millions of years has produced the diversity of life on Earth today. All species evolved from a population of single celled organisms, the population was divided, and the new populations evolved into separate species. This was repeated over a long period of time to create millions of new species. This can be seen in the evolutionary tree of life.