Reaction Kinetics
 Call Kai
 Learn
Learn Practice Test
 Spaced Repetition
 Match
Match Flashcards
 Knowt Play
1/21

There's no tags or description
Looks like no tags are added yet.
Name | Mastery | Learn | Test | Matching | Spaced | Call with Kai | Chat |
|---|
No analytics yet
Send a link to your students to track their progress
22 Terms
Collision Theory
Particles must collide in the correct orientation
Particles must collide with sufficient minimum energy (activation energy) to bring about necessary reorganisation of bonds in colliding particles
Rate of Reaction
Effective collision: when particles collide at the correct orientation and sufficient energy
Greater the frequency of effective collisions, greater the rate of reaction
Factors affecting rate
Concentration / pressure —> frequency of effective collisions
Surface area —> frequency of effective collisions
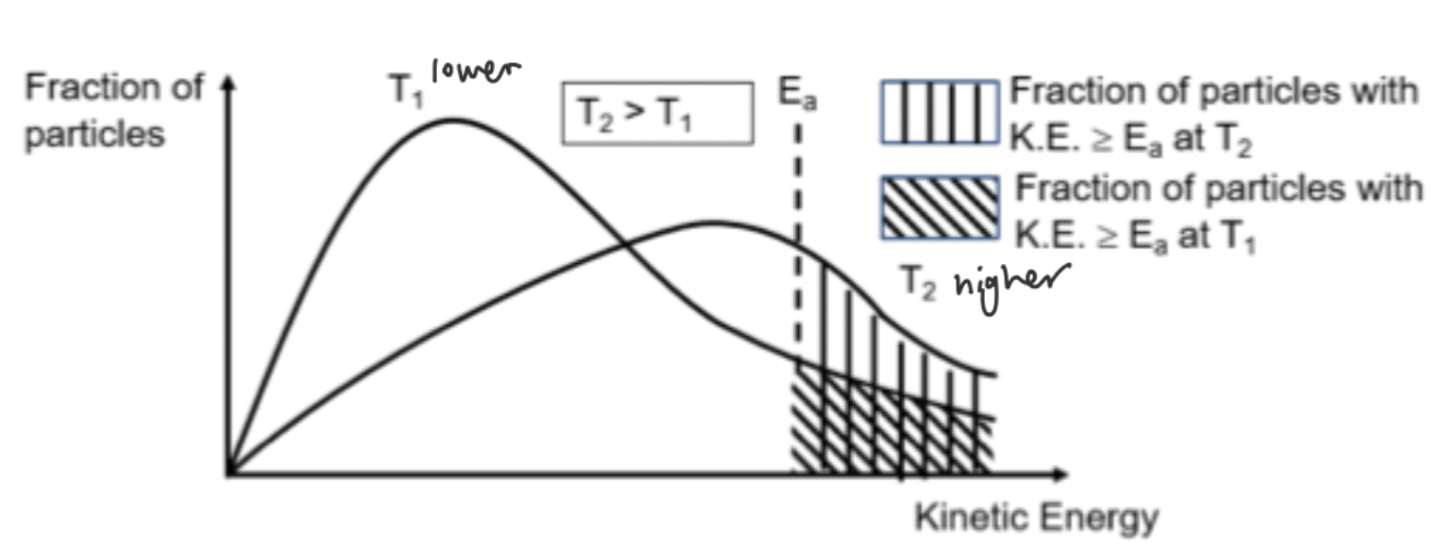
Temperature —> greater KE, greater fraction of particles with sufficient KE above EA
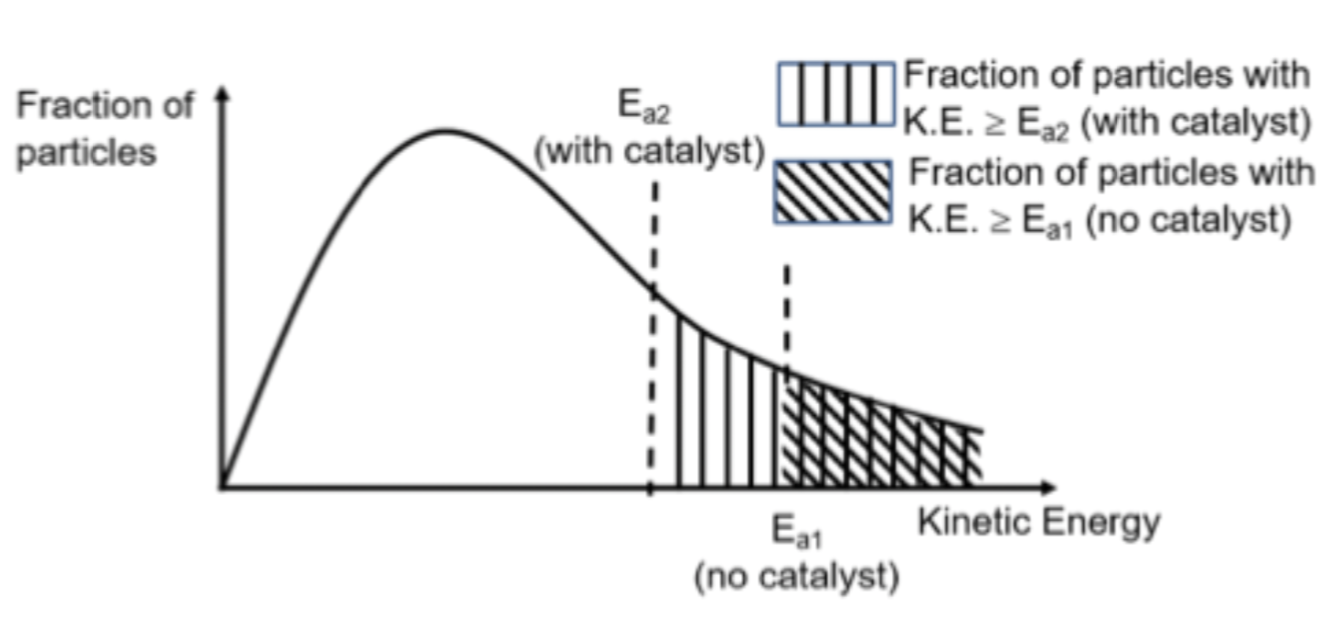
Catalyst —> alternative pathway with lower EA, greater fraction of particles with sufficient KE above EA
Boltzmann Curve — higher temp
Boltzmann Curve — catalyst present
Heterogeneous catalyst
Usually solid catalyst and gaseous reactants
Brings ALL reactant particles closer to each other and weakens all bonds, hence providing alternative pathway of lower activation energy
One step reaction
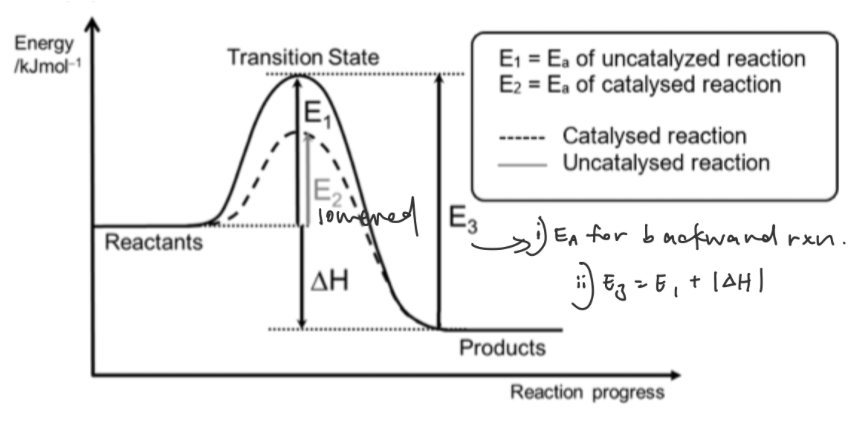
Mode of Action of heterogenous catalyst
Adsorption: of reactants particles onto surface of catalyst, weak IMF formed between reactant and catalyst
Reaction: reactants brought closer to each other and existing interactions in reactant molecules are weakened
Desorption: products leave catalyst, catalyst regenerated
Homogenous catalyst
Catalyst and reactants in the same phase
Two step reaction
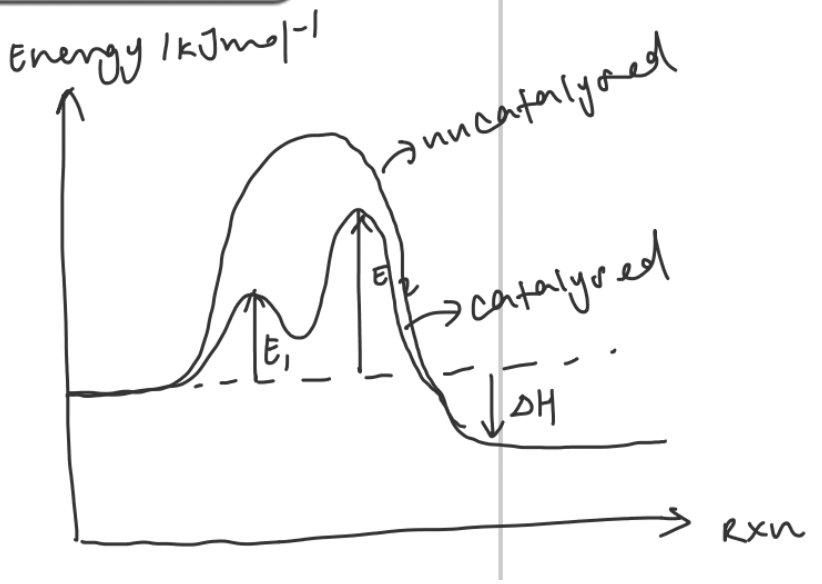
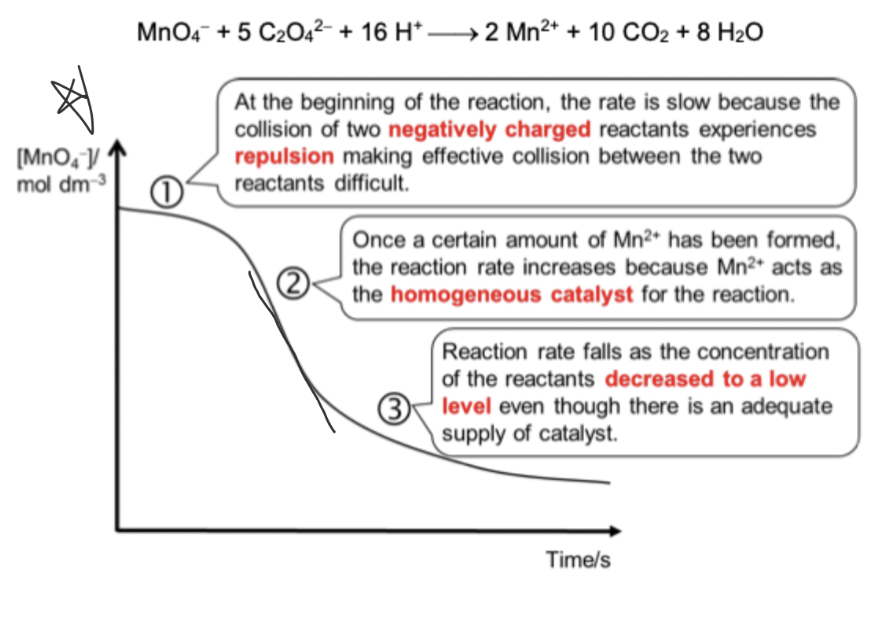
Autocatalyst
Biological catalyst
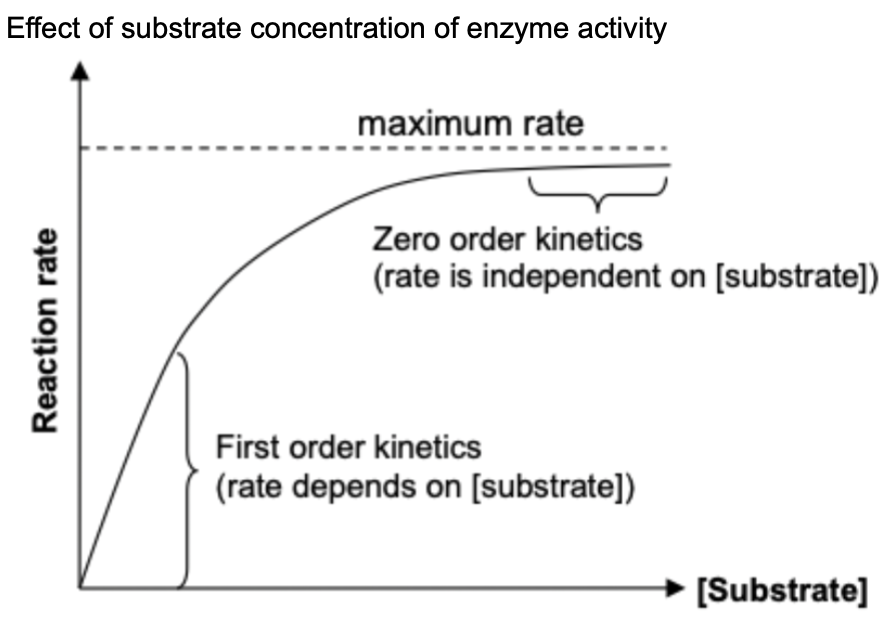
Enzymes have specific active site that is complementary to reactant molecules in shape and charge
Rate equation
rate = k[A]x[B]y
Order of reaction
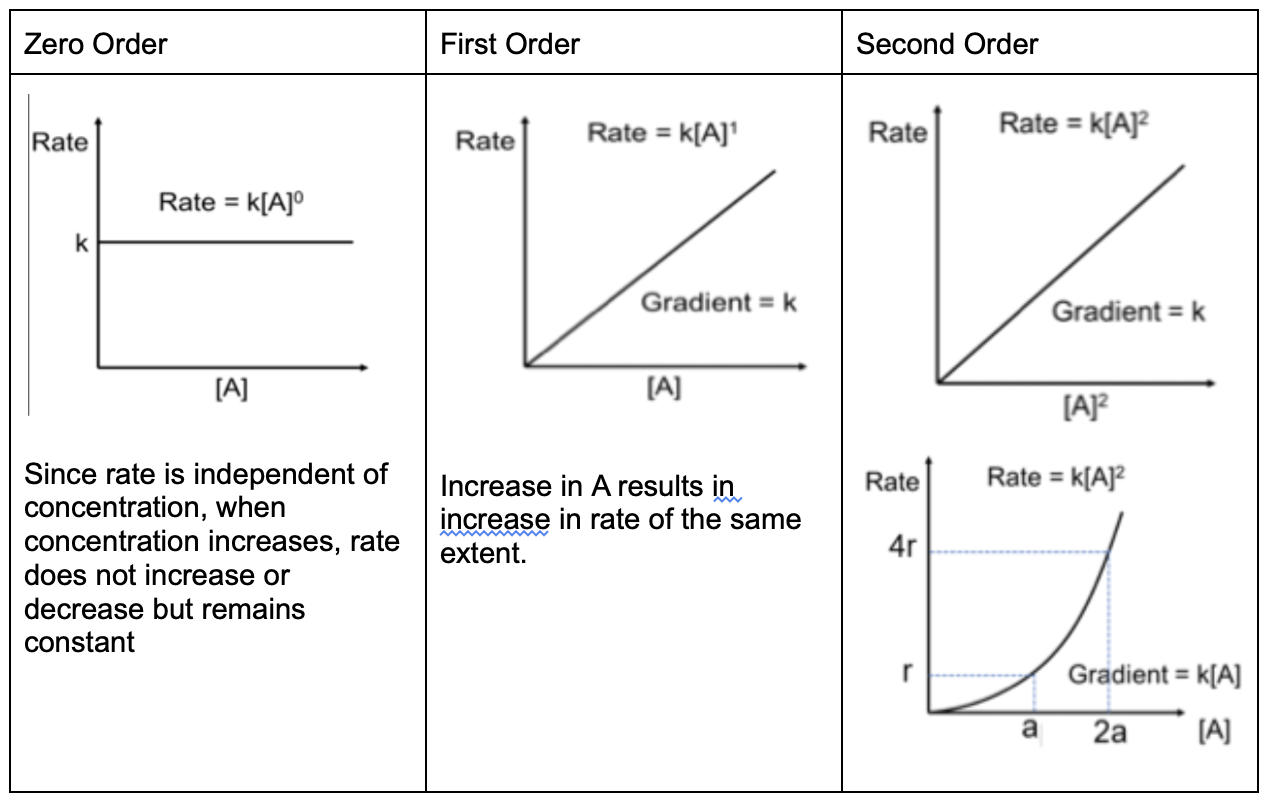
Zero: rate is not affected by reactant
First: rate is directly proportional to the concentration of reactant
Second: rate is directly proportional to the SQUARE of concentration of reactant
Factors affecting k (rate constant)
Concentration: no change
Temp: increases
Addition of catalyst: increases
Initial rate method
Multiple experiments
Collect time taken in each experiment
Rate-concentration graph to be plotted
Continuous method
Single experiment
Collect concentration remaining in reaction
Concentration-time graph to be plotted
Physical experiments to find rate equation
Gas collection
Gravimetric
Pressure change
pH change
Electrical conductivity
Colorimetry
Titrimetric method — continuous
Titration result (concentration of reactant or product) are plotted against time
Analysis of shape and half-life of concentration-time graph enables one to find the overall order of reaction
Order wrt A can be investigated if all other reactants is present in large excess
Clock reaction — initial rate
Appearance of colour: can be simplified to rate = 1/(time taken)
Disappearance of colour: cannot be simplified to rate = 1/(time taken)
Deducing order of reaction (initial rate table)
Comparing Exp 1 and 2 where [X] is the same,
When [Y] of E2 is twice of [O2] of E1, rate of E2 is twice of rate of E1, therefore order wrt to O2 must be zero/one/two
Deducing order of reaction (initial rate graph)
Rate / Concentration — Look at shape
Deducing order of reaction (continuous graph)
Concentration-time graph
Shape: if linear, zero order
Half life: if at least 2 half lives are equal, first order. Otherwise, second order
For 1st order, t1/2= ln2 / k
Initial + Continuous methods
A + B (large excess) —> C
Continuous:
[B] is assumed to be constant, rate eqn= k’[A]m —> find order of reaction wrt A. Observe shape and use half life to determine order of reaction wrt A
Initial rate:
Keep [A] constant, change [B] (but still in large excess). Compare time taken for both reactions to reach same [A] left, use inspection method to determine order of reaction wrt B