Class 2: Descriptive Statistics, Probability, and Measures of Central Tendency
1/23
There's no tags or description
Looks like no tags are added yet.
Name | Mastery | Learn | Test | Matching | Spaced | Call with Kai |
|---|
No analytics yet
Send a link to your students to track their progress
24 Terms
Central Tendency
Indicator of the centre of data
Mode
The most frequently occurring value or category in the distribution. When a unimodal distribution has only one mode, it is called .
Binomial
Having two values or categories that have the highest occurrence and that are equal frequencies.
Extreme Outlier
An outlier in a data set that is more than 3 times the interquartile range either above or below the interquartile range (±3 × the length of the box above or below the box on a box and whiskers plot).
Frequency Distribution
Lists all the possible outcomes of an experiment and tallies the number of times each outcome occurs.
Mean
The sum of the values divided by the total number of observations. It is the most commonly known measure of central tendency but requires interval or ratio data. Can not be used to calculate ordinal or nominal data.
Median
For ordinal, interval, and ratio data, the value in the middle when all the measured values are lined up in order from least to most; the 50th percentile value.
Multimodal
Having more than two modes.
Normal distribution
“68%,95%, 99%” A probability distribution in which the mean, median, and mode are equal, with a bell-shaped distribution curve.
Probibility
The chance that a particular outcome will occur after an event.
Probability distribution
The probability of all the possible outcomes of the variable.
p-Value
The probability of finding the reported results if the null hypothesis is true.
Range
The difference between the maximum and minimum values in a distribution.
Sampling Distribution
Plots realized frequencies of a statistic versus the range of possible values that statistic can take.
Skewed distribution
An asymmetrical distribution of the values of the variable around the mean, making one tail longer than the other.
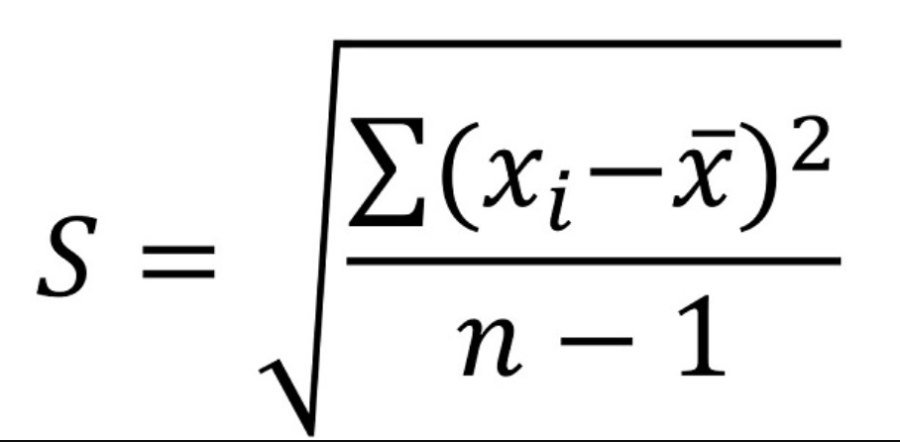
Standard deviation
The average distance that the values in a distribution are from the center.
Turkey fences
A cutoff value indicating that an observation is an outlier in a data set because it is more than 1.5 times the interquartile range either above or below the interquartile range (±1.5 times the length of the box above or below the box on a box and whiskers plot).
Z-score
A measure that indicates how many standard deviations a value is from the mean value.
Null-hypothesis
Where you sample is an ideal reflection of the population.
Variable
An operational diffrence
Range
The difference between the maximum and minimum values.
Varience
The average of squared differences from the mean.
Table 1
Usually the first table in a research study, Describes the sample
Descriptive studies
Track trends of diseases over time
Healthcare resource planning
Safety outcome monitoring
Hypothesis generation