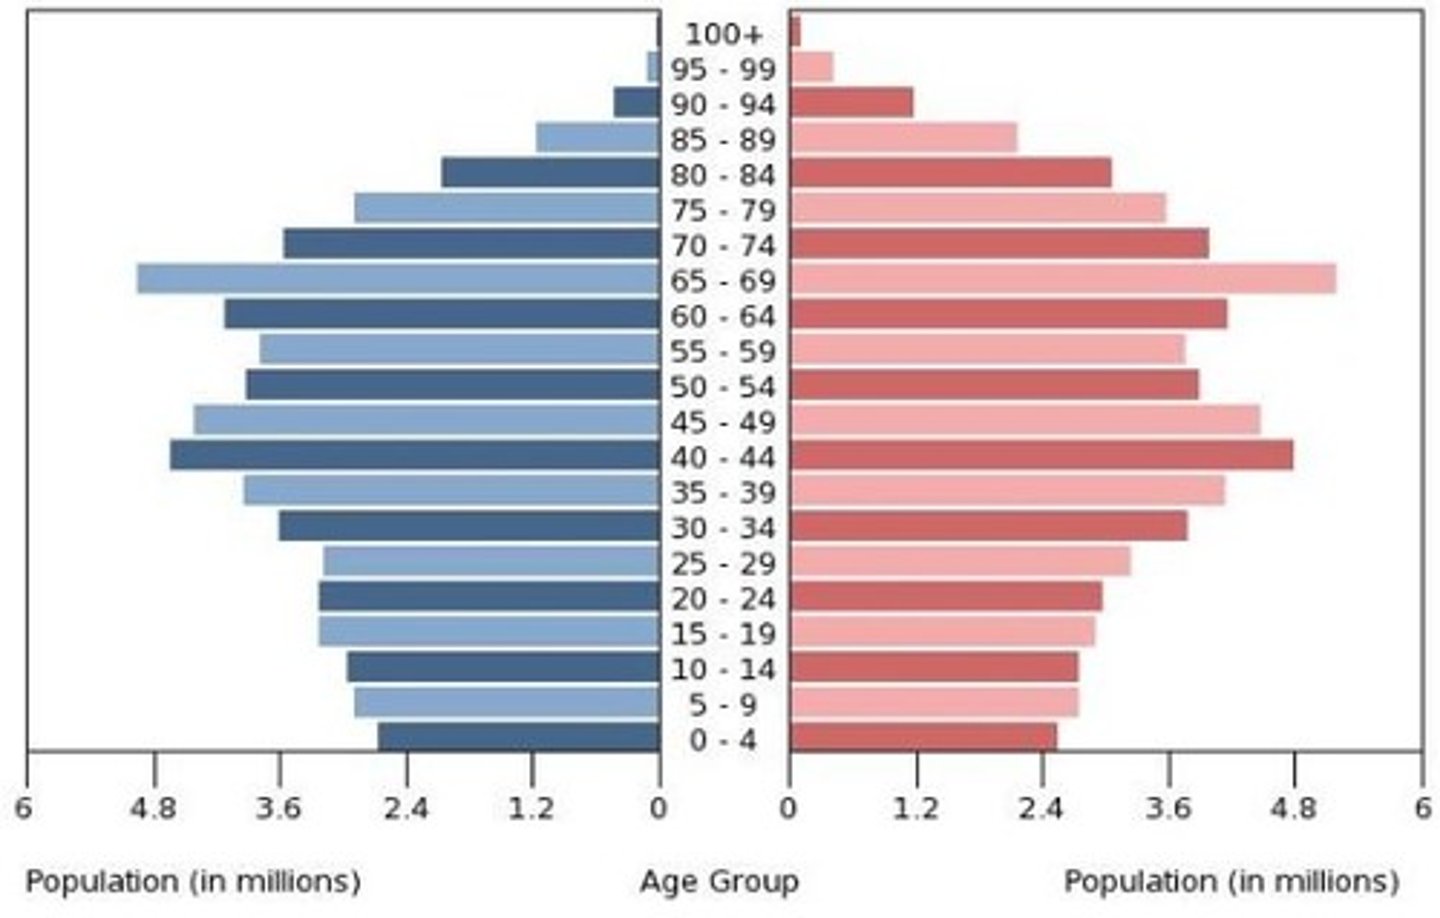
Models of Population & Population Pyramids
1/22
There's no tags or description
Looks like no tags are added yet.
Name | Mastery | Learn | Test | Matching | Spaced |
|---|
No study sessions yet.
23 Terms
Demographic Transition Model
A sequence of demographic changes in which a country moves from high birth and death rates to low birth and death rates through time.
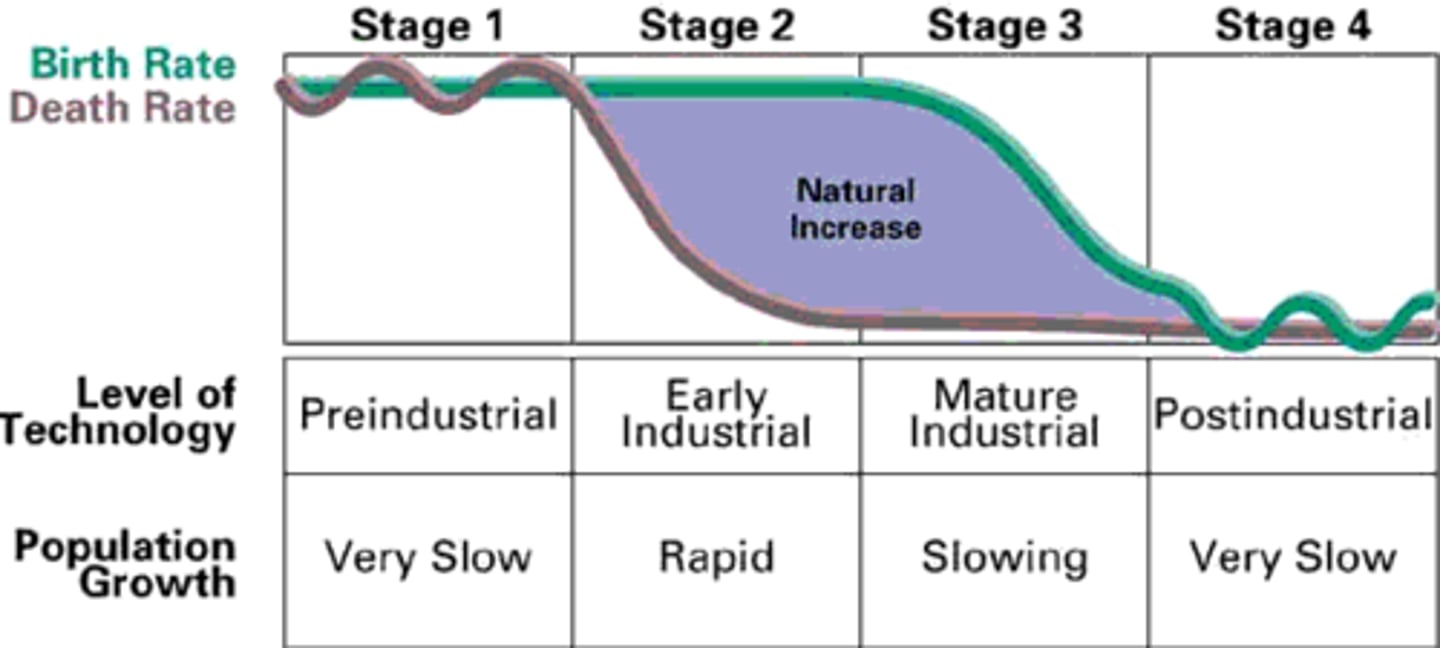
DTM Stage 1: High Stationary
high death rates and high birth rates.
DTM Stage 2: Rapid Growth
rapid population growth: high birth rates & declining death rates
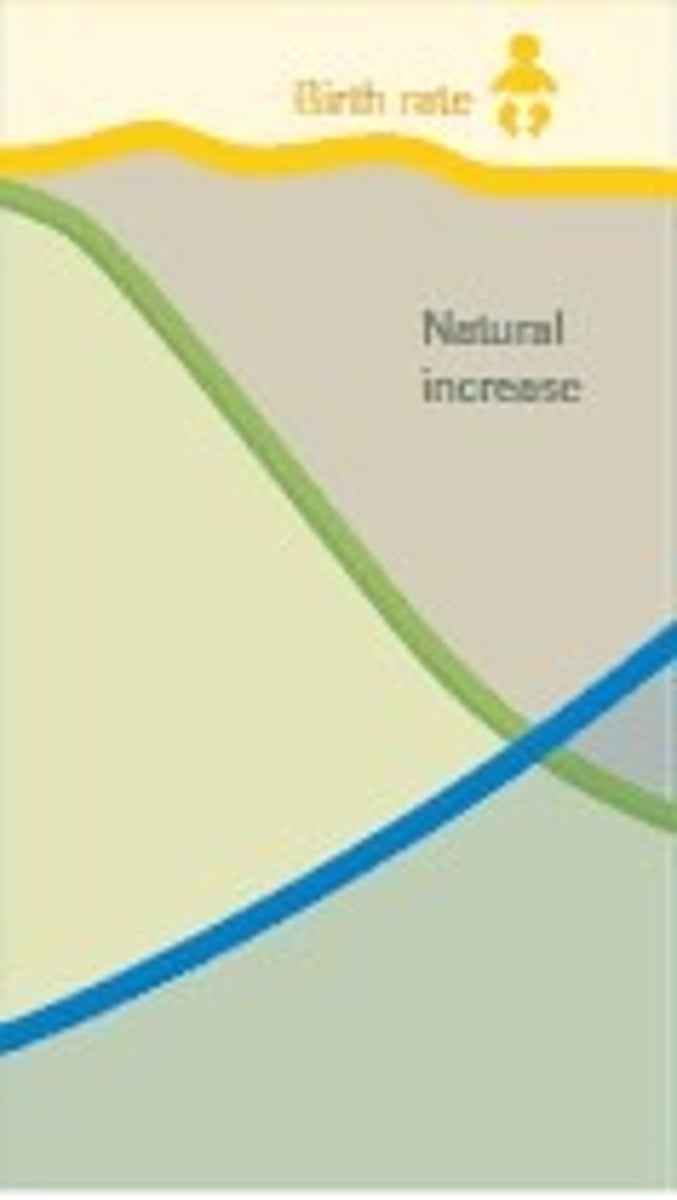
DTM Stage 3: Moderate Growth
Low death rate and declining birth rate. Stage 3 represents late industrial stage of DTM.

DTM Stage 4: Low Stationary
There is a low growth rate in Stage 4. The life-expectancy is longer and the TFR is extremely low.

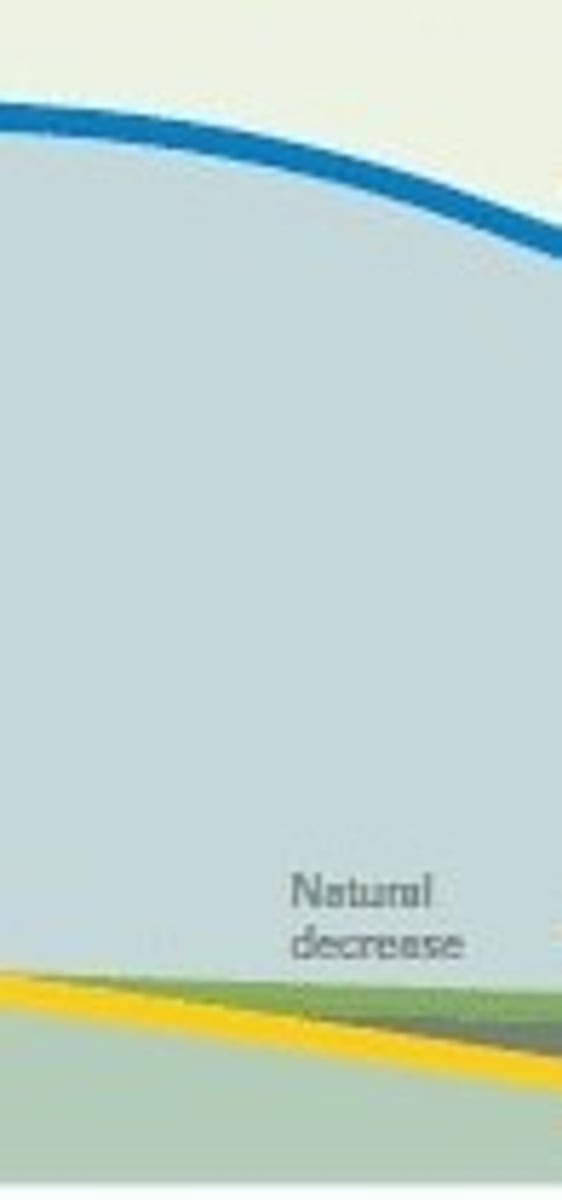
DTM Stage 5: Declining
CDR is greater than or equal to CBR, leading to zero population growth or a natural decrease in the population.
Epidemiological Transition Model
Refers to the distinct causes of death in each stage of the demographic transition.

ETM Stage 1 (Pestilence and Famine)
Pestilence, animal attacks, famine, and human conflict cause high CDR (Ex. Black Plague)
ETM Stage 2 (Age of Receding Pandemics)
the : Death rates decline due to better sanitation and health care though their remains a steady dose of communicable diseases (Viruses & Parasites)
ETM Stage 3 (Degenerative and Human Created Diseases)
People are living longer an begin to die of degenerative illnesses such as cancer and heart disease.
ETM Stage 4 (Delayed Degenerative Diseases)
Degenerative illneses are still the primary cause of death however people are able to delay death improved medical care and coverage life expectancy reaches a peak.
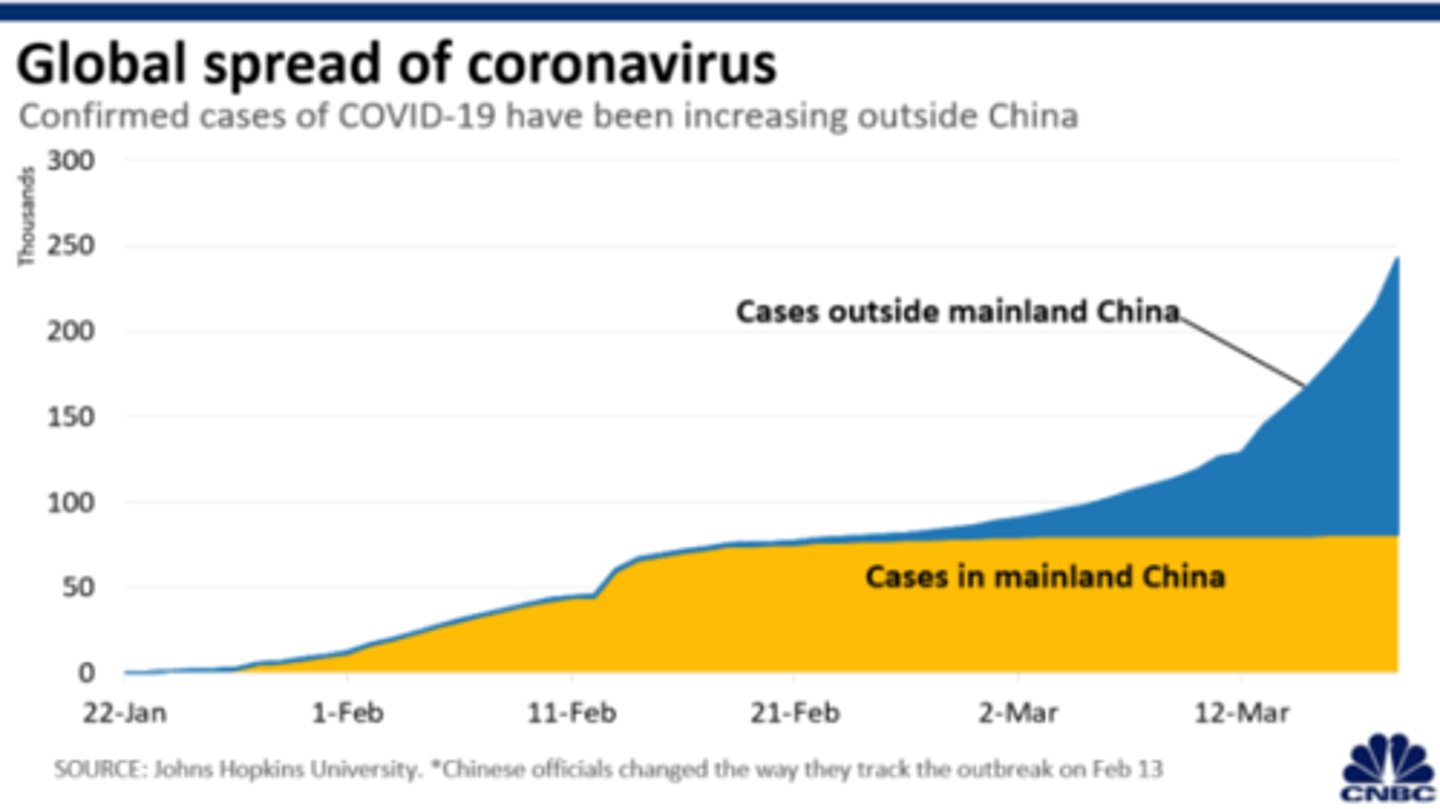
ETM Stage 5 (Reemerging Diseases)
a theoretic stage where it is hypothesized that infectious and parasitic diseases again becomes a dominant cause of death among a rapidly globalizing World. The recent Covid 19 pandemic must make one wonder if this stage is still theoretical?
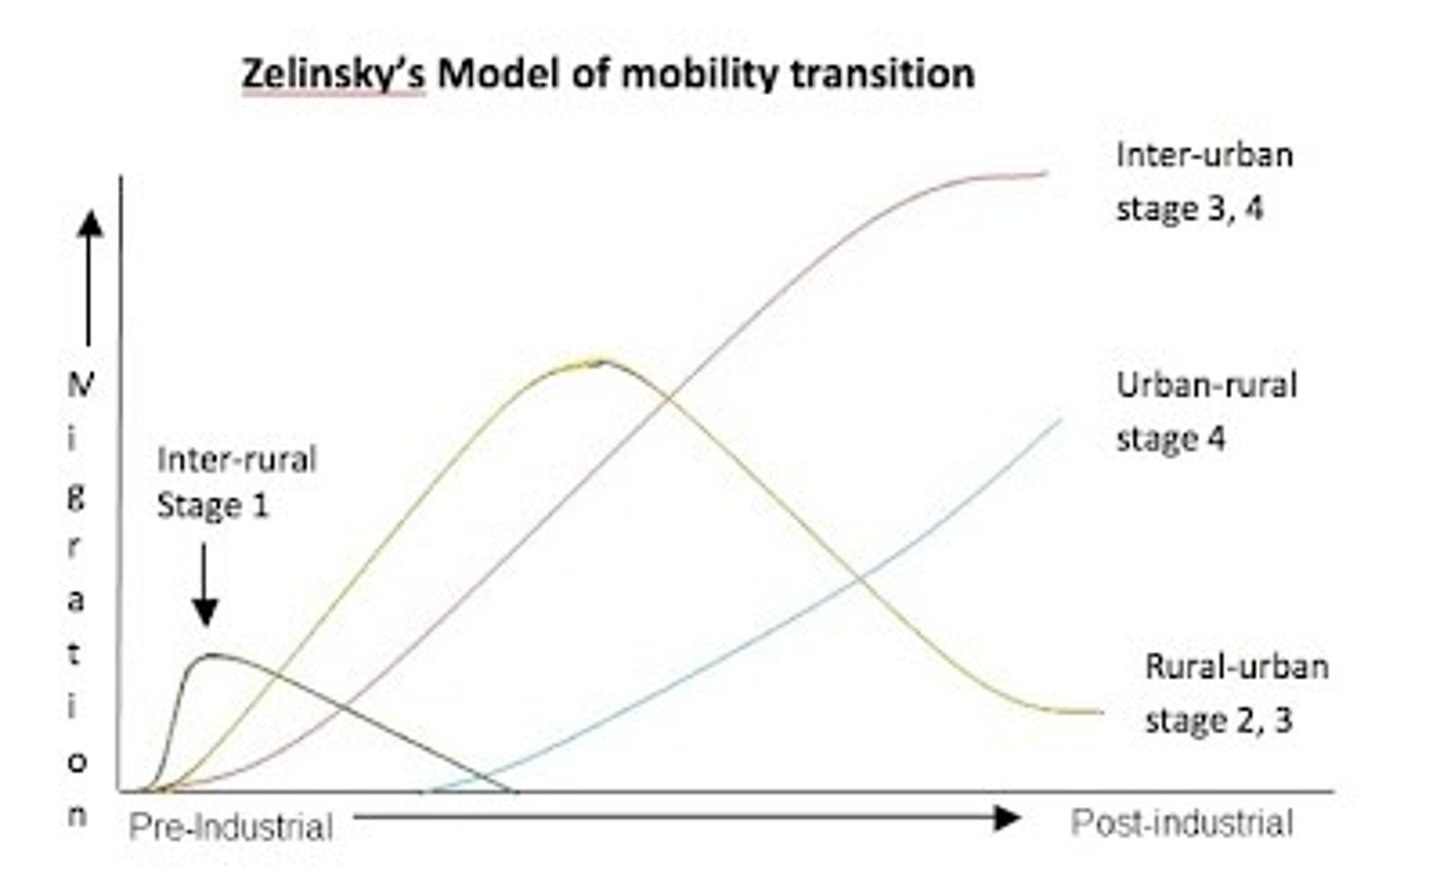
MT Stage 1
daily or seasonal circulation in search of food.
MT Stage 2
international migration from rural to urban areas (Urbanization). These states have more out migration.
MT. Stage 3
Urbanization continues internationally where interan migration occurs from the cities to the suburbs (suburbanization). These states yield a net out migration
MT Stage 4
internal migration from cities to the suburbs. Experiencing some migration from urban to rural (counter urbanization). These States yield a net in migration.
MT Stage 5
internal movement slows though Counter Urbanization steadily continues. low birthrates encourages net in migration from guest workers from stage 3 countries.
Migration Transition Model
Refers to the unique migration patters a country/society experiences at each stage of the demographic transition.
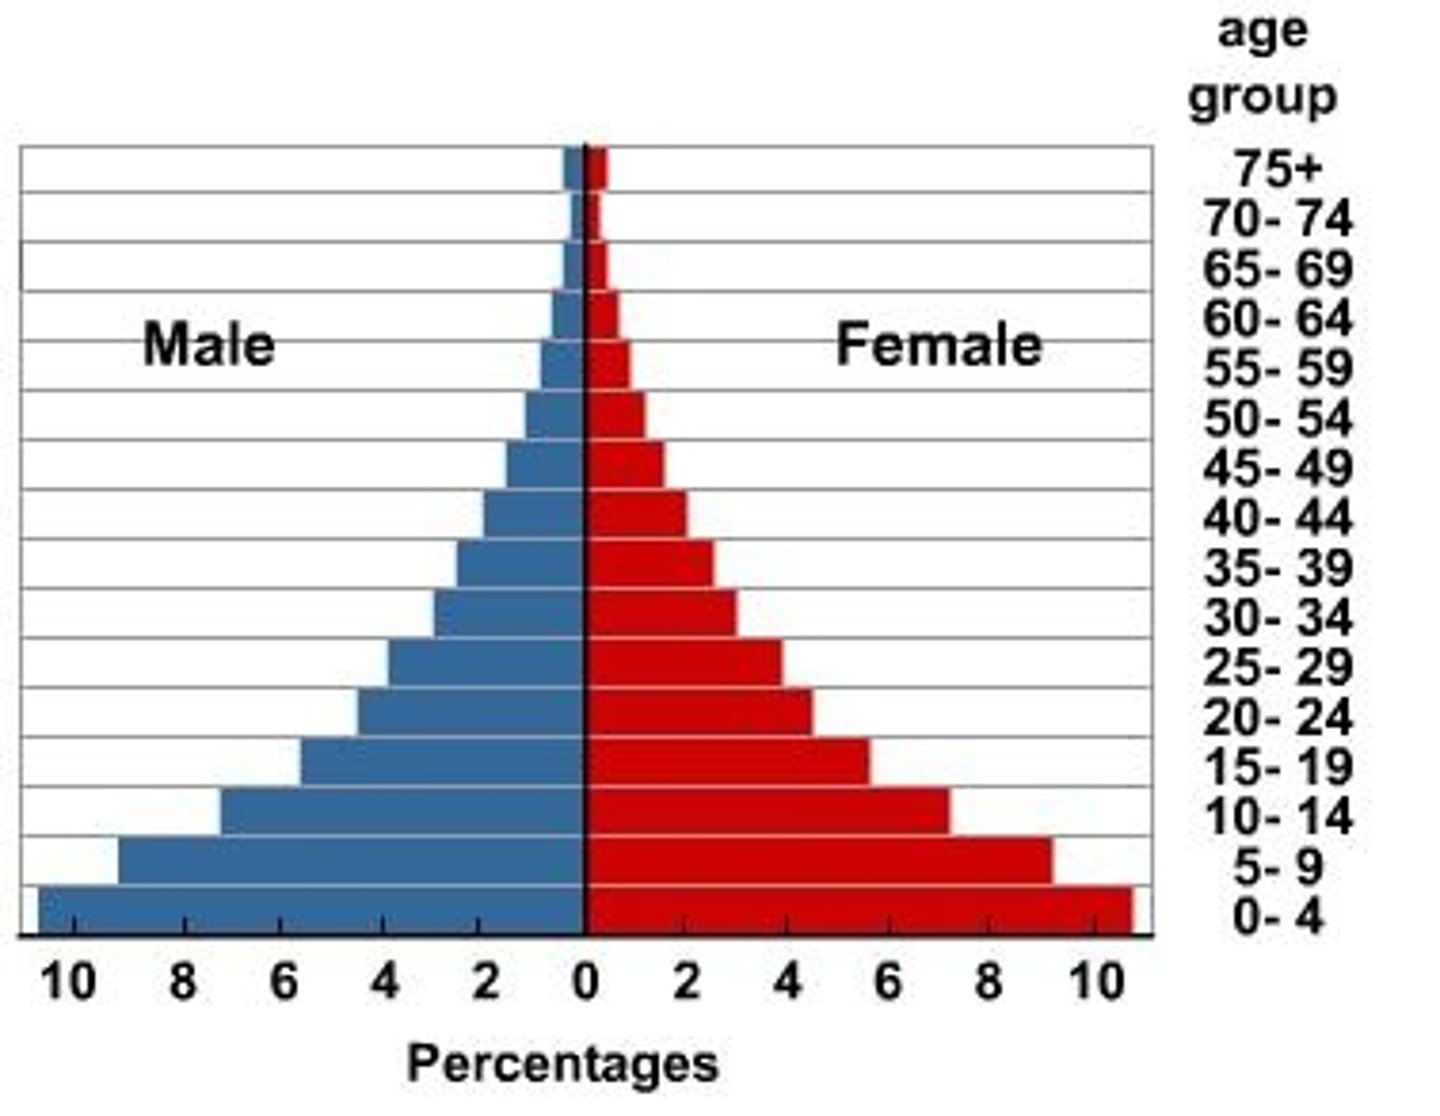
Stage 1 Population Pyramid
A large base implies high birth. Each subsequent cohort greatly decreases in size implying very high death rates.
Stage 2 Population Pyramid
A large base implies high birth rates. Cohorts don't begin to rapidly drop off until the age of 20 implying poor but improving healthcare (medical revolution).
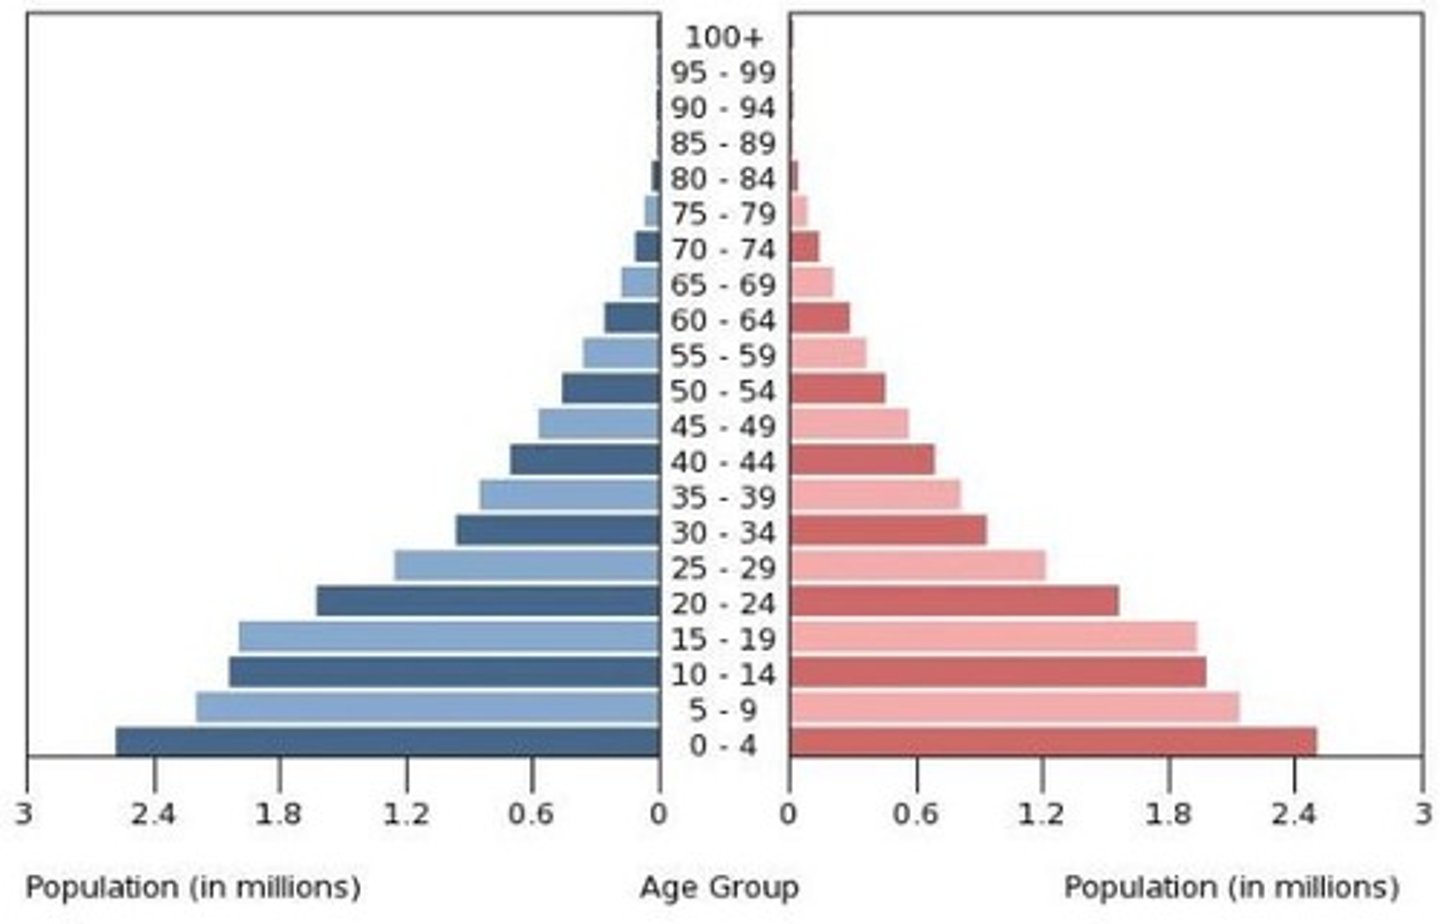
Stage 3 Population Pyramid
The base of this pyramid has decreased is not quite as big as the previous ones and the population does not begin to decline until the mid 30s. Larger older cohorts implies that people are beginning to live longer.
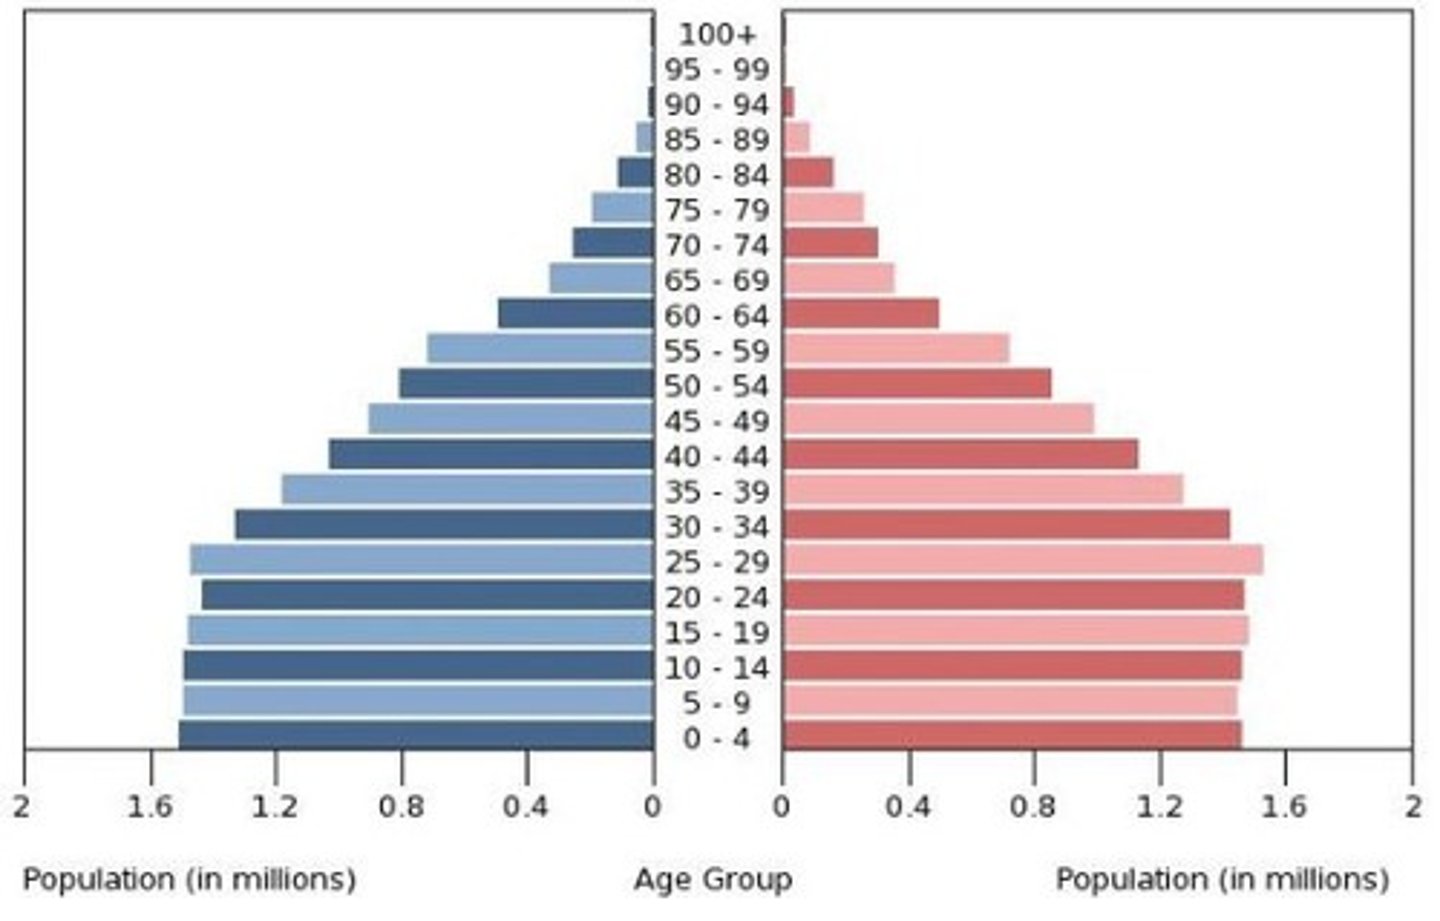
Stage 4 Population Pyramid
The number of children at the base of the pyramid is comparable to that of the elderly implying a replacement population showing little to no growth. Because their is little decline in the population up to the age of 65 The labor force is consistent and stable.
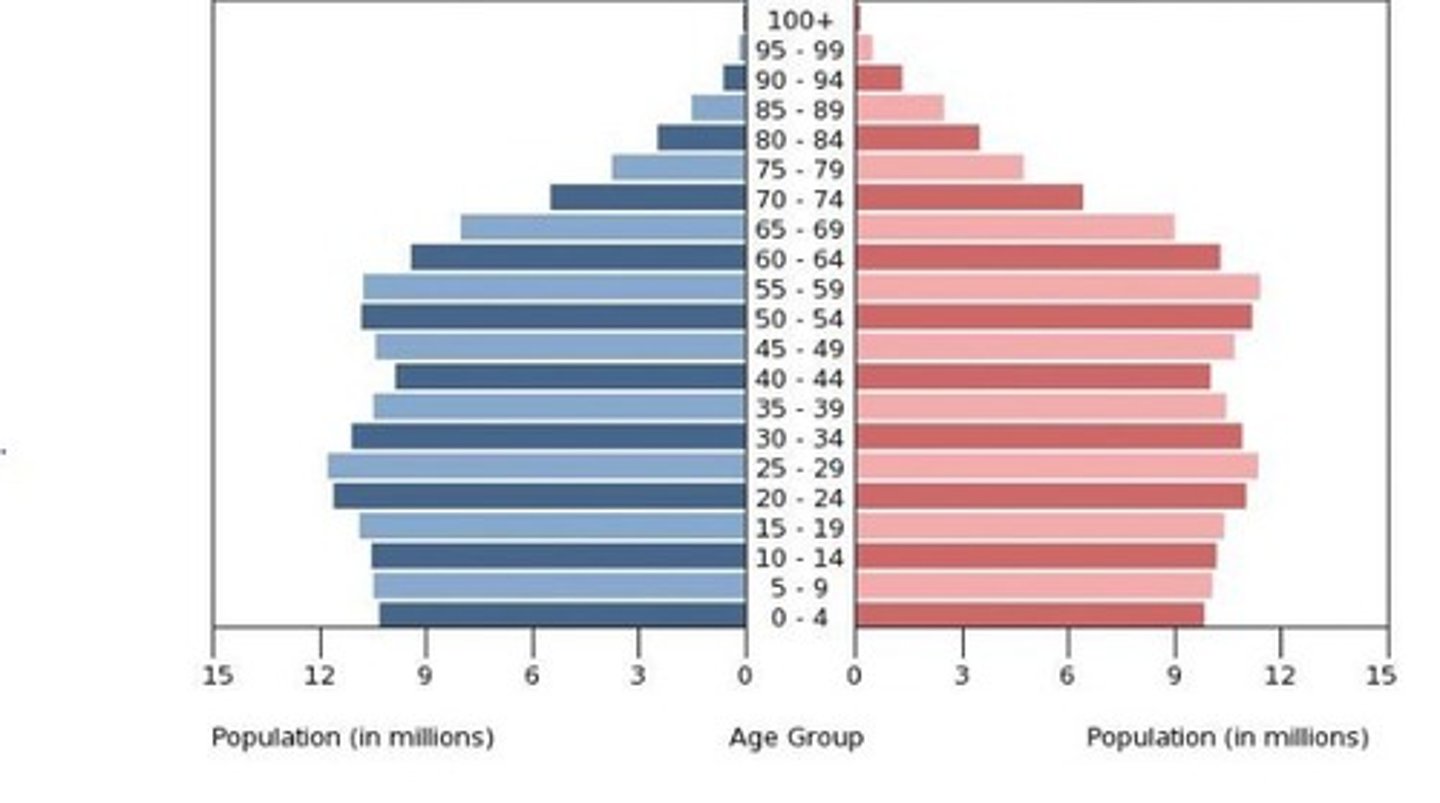
Stage 5 Population Pyramid
This pyramid is top heavy containing more elderly children at the base. This population could be experiencing negative population growth and an uncertain labor force to support retirees.
