Data analysis midterm 1
1/101
There's no tags or description
Looks like no tags are added yet.
Name | Mastery | Learn | Test | Matching | Spaced | Call with Kai |
|---|
No analytics yet
Send a link to your students to track their progress
102 Terms
Correlational designs
Measures two variables as a naturally occurred to see if there’s a relationship
Operational definition
Describes how your variable is measured and what it means
Experimental method
Manipulating one variable while controlling the other variable to see if there’s a relationship
Independent variable
Predictor variable, variable that’s being manipulated in an experiment eg. Sitting with a friend versus sitting with a stranger.
Dependent variable
The outcome variable, the variable that’s being measured as the outcome eg. Roller coaster enjoyment.
Systematic variation
Difference in outcome created by a specific experimental manipulation (eg. Sitting with a stranger versus sitting with a friend.)
Unsystematic variation
Variation that’s not due to the effect we’re interested in (eg. Natural differences, time of day, etc..) things that may affect ride enjoyment that are not a part of the experiment
Within subject
The same entities take part in all experimental conditions
Problem for within subject, design, designs, and the solution
Practice effects, familiarity and boredom
Solution can be counter balancing: some will start with a different condition and then go to the stranger condition, vice versa
Between subject designs
Having different entities in experimental conditions
Types of variables
Discrete and continuous
Discrete variables
Finite numbers (whole number) eg. Age
Continuous variables
Numbers that have infinite number of possible values (fractions, decimals, time, weight, grades)
Scales of measurement
Nominal, ordinal, interval, and ratio
Nominal
Data that can be separated into exclusive categories (eg. Jobs (teacher, lawyer doctor.) relationship status (married single divorce)
Ordinal
Assigning numerical values to categories in an order sequence (eg. Gold,Silver,Bronze in a race = 1,2,3
Interval and ratio
Assigning numerical values in an order sequence (eg.timed races)
Interval
Zero is arbitrary, doesn’t include a true zero (eg.temperature, 0° doesn’t mean no more temperature)
Ratio
Zero is as meaningful as absolute zero (eg. Gas tank with zero gas means gas is absent.)
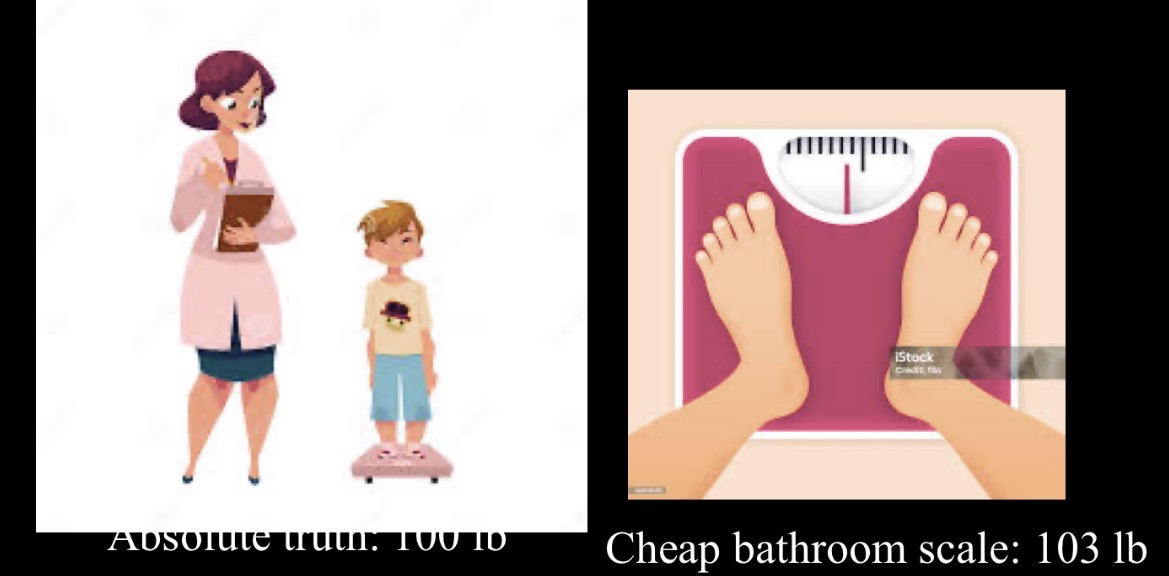
Measurement error
The difference between what we know is true and what we measure. In this image, the measurement error would be 3 pounds because the absolute truth was 100 pounds and the cheap bathroom scale was 103 so we would just subtract the two measurements
Validity
Is it measuring what needs to be measured?
Reliability
Weather an instrument can be interpreted consistently across situations
Central tendencies
Mean, median, and mode
Mode
The most frequent scores
Bimodal
Having 2 modes
Multimodal
Having several modes
Median
The middle score when scores are ordered
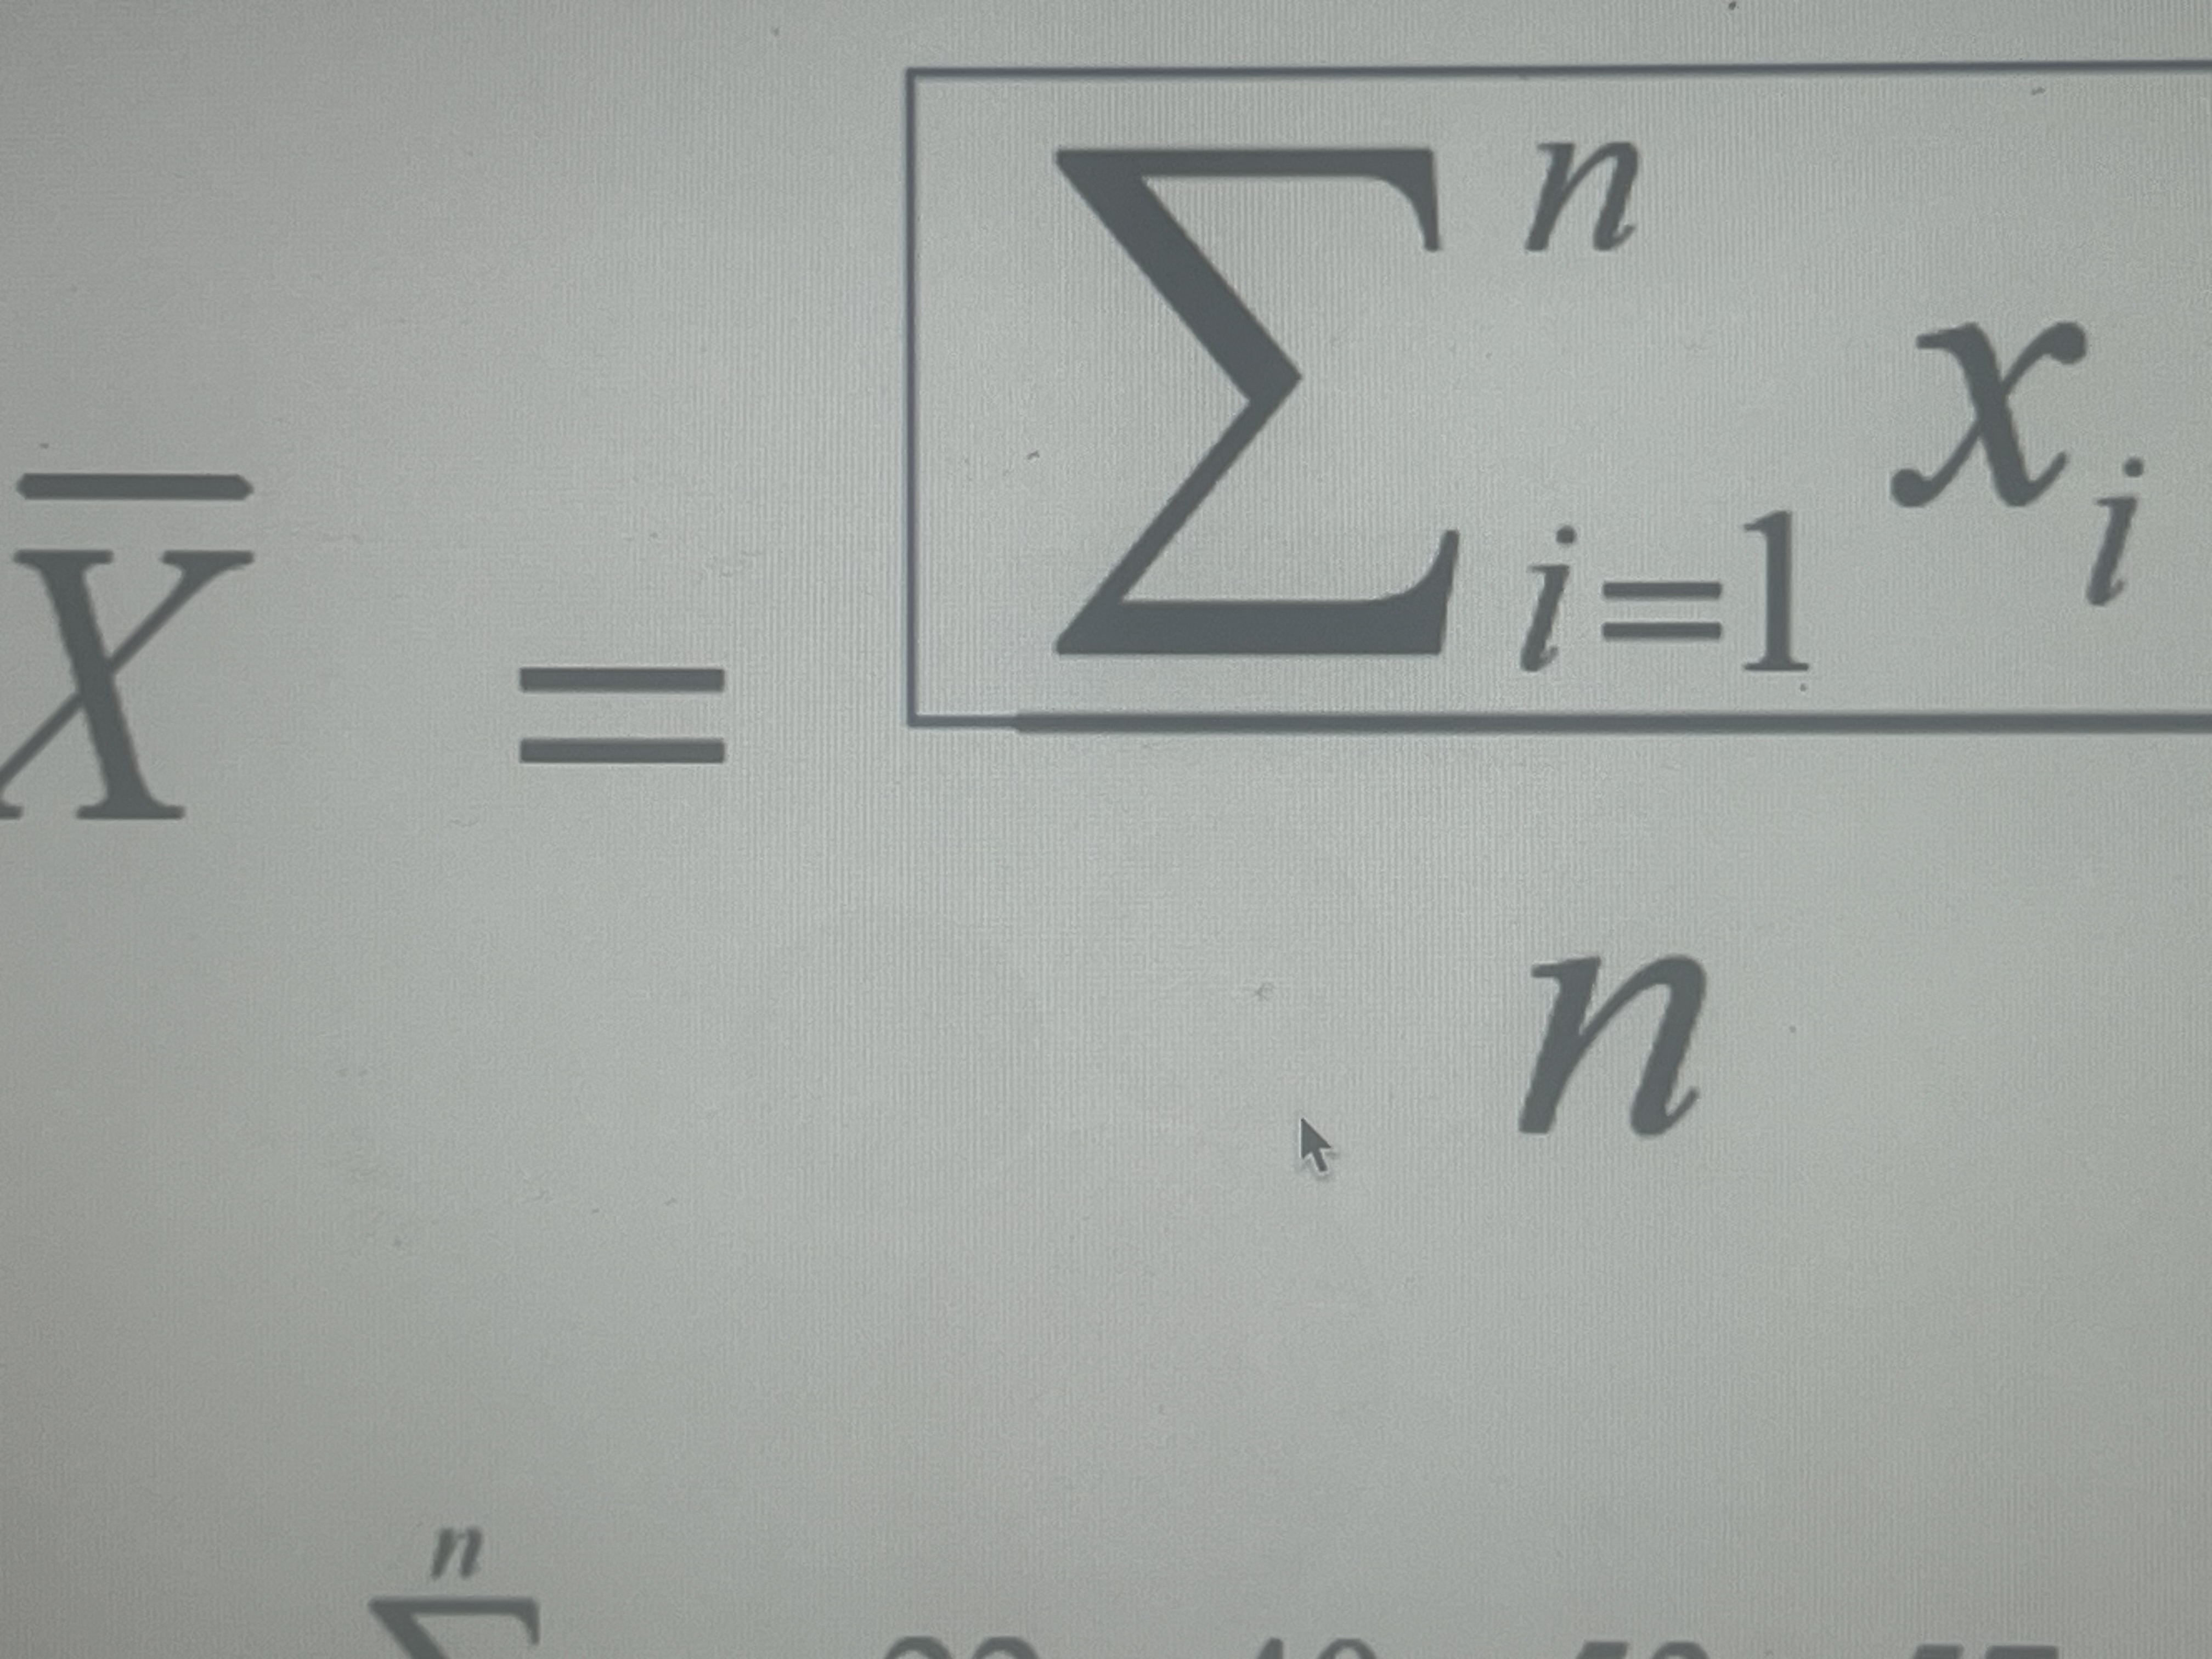
Sum of score is divided by the number of scores
Mean equation
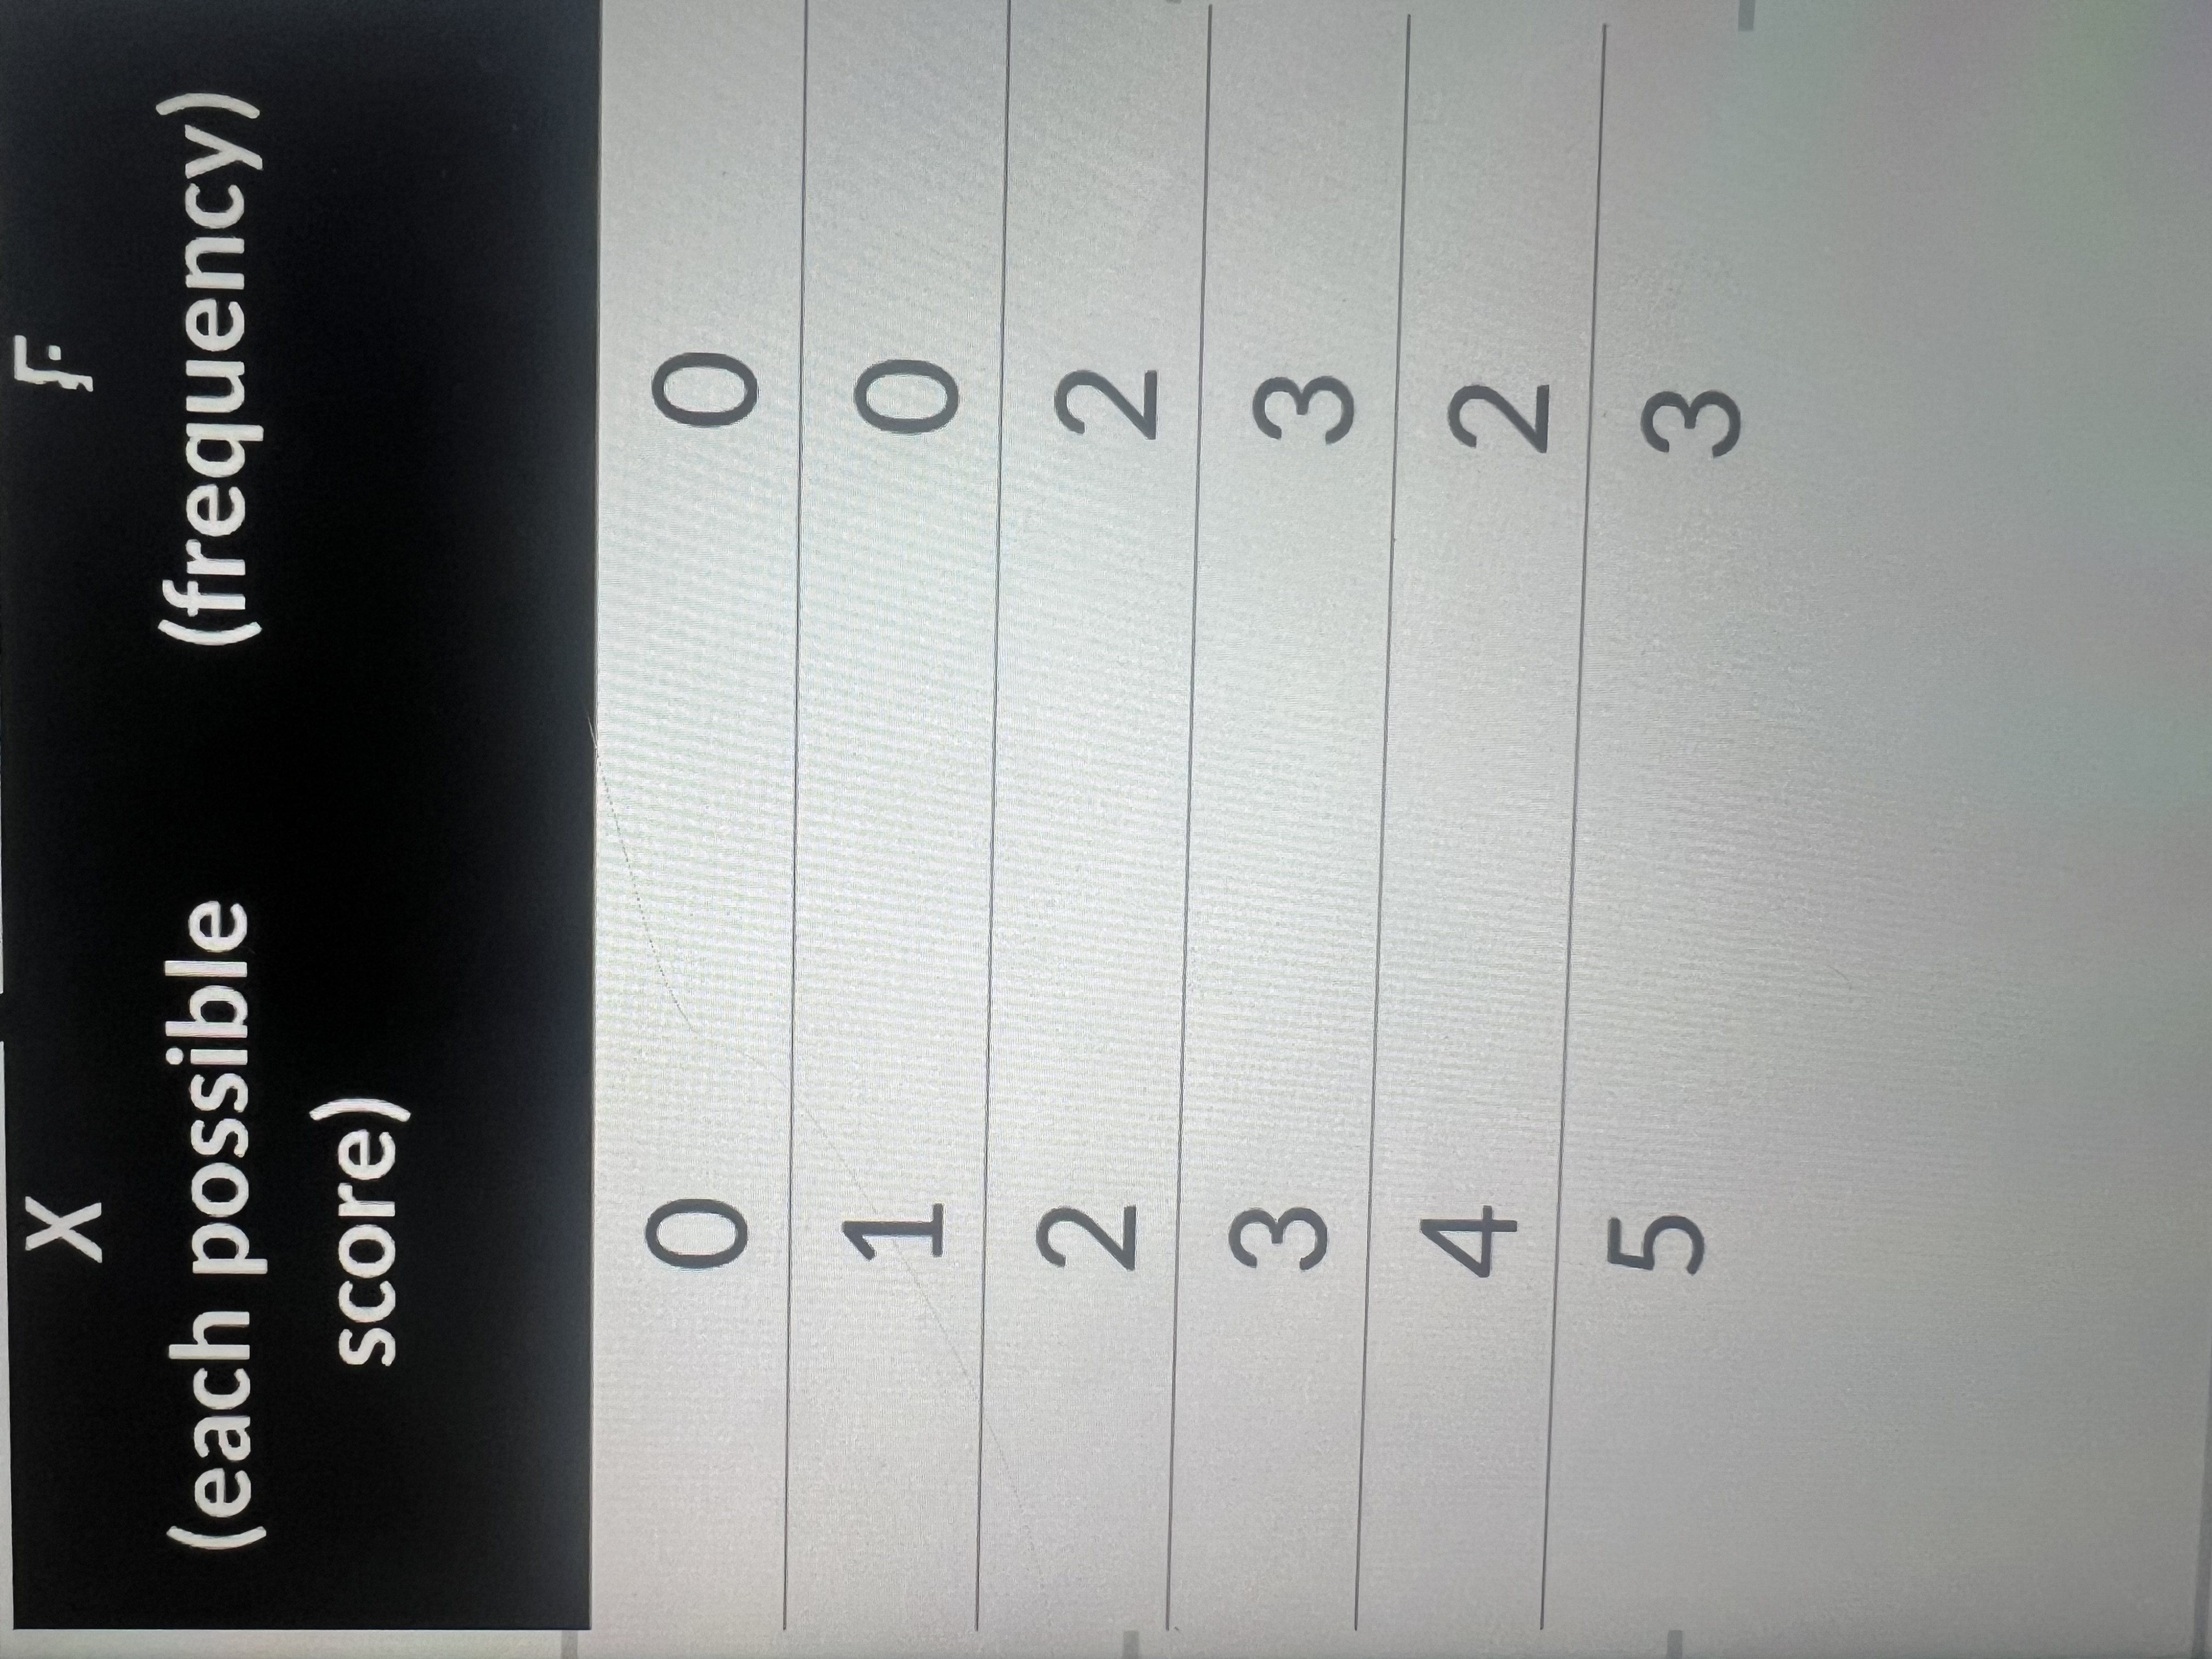
frequency distribution
Organize data by the number of individuals located within each category

N = 10
N= the amount of people in the study

%= f (frequency) divided by n (number of participants x 100
Percentages equation
Percentile ranks
The percent of people what score is equal to or less than a specific value (if I scored in the 70th percentile 70% of people score lower than me
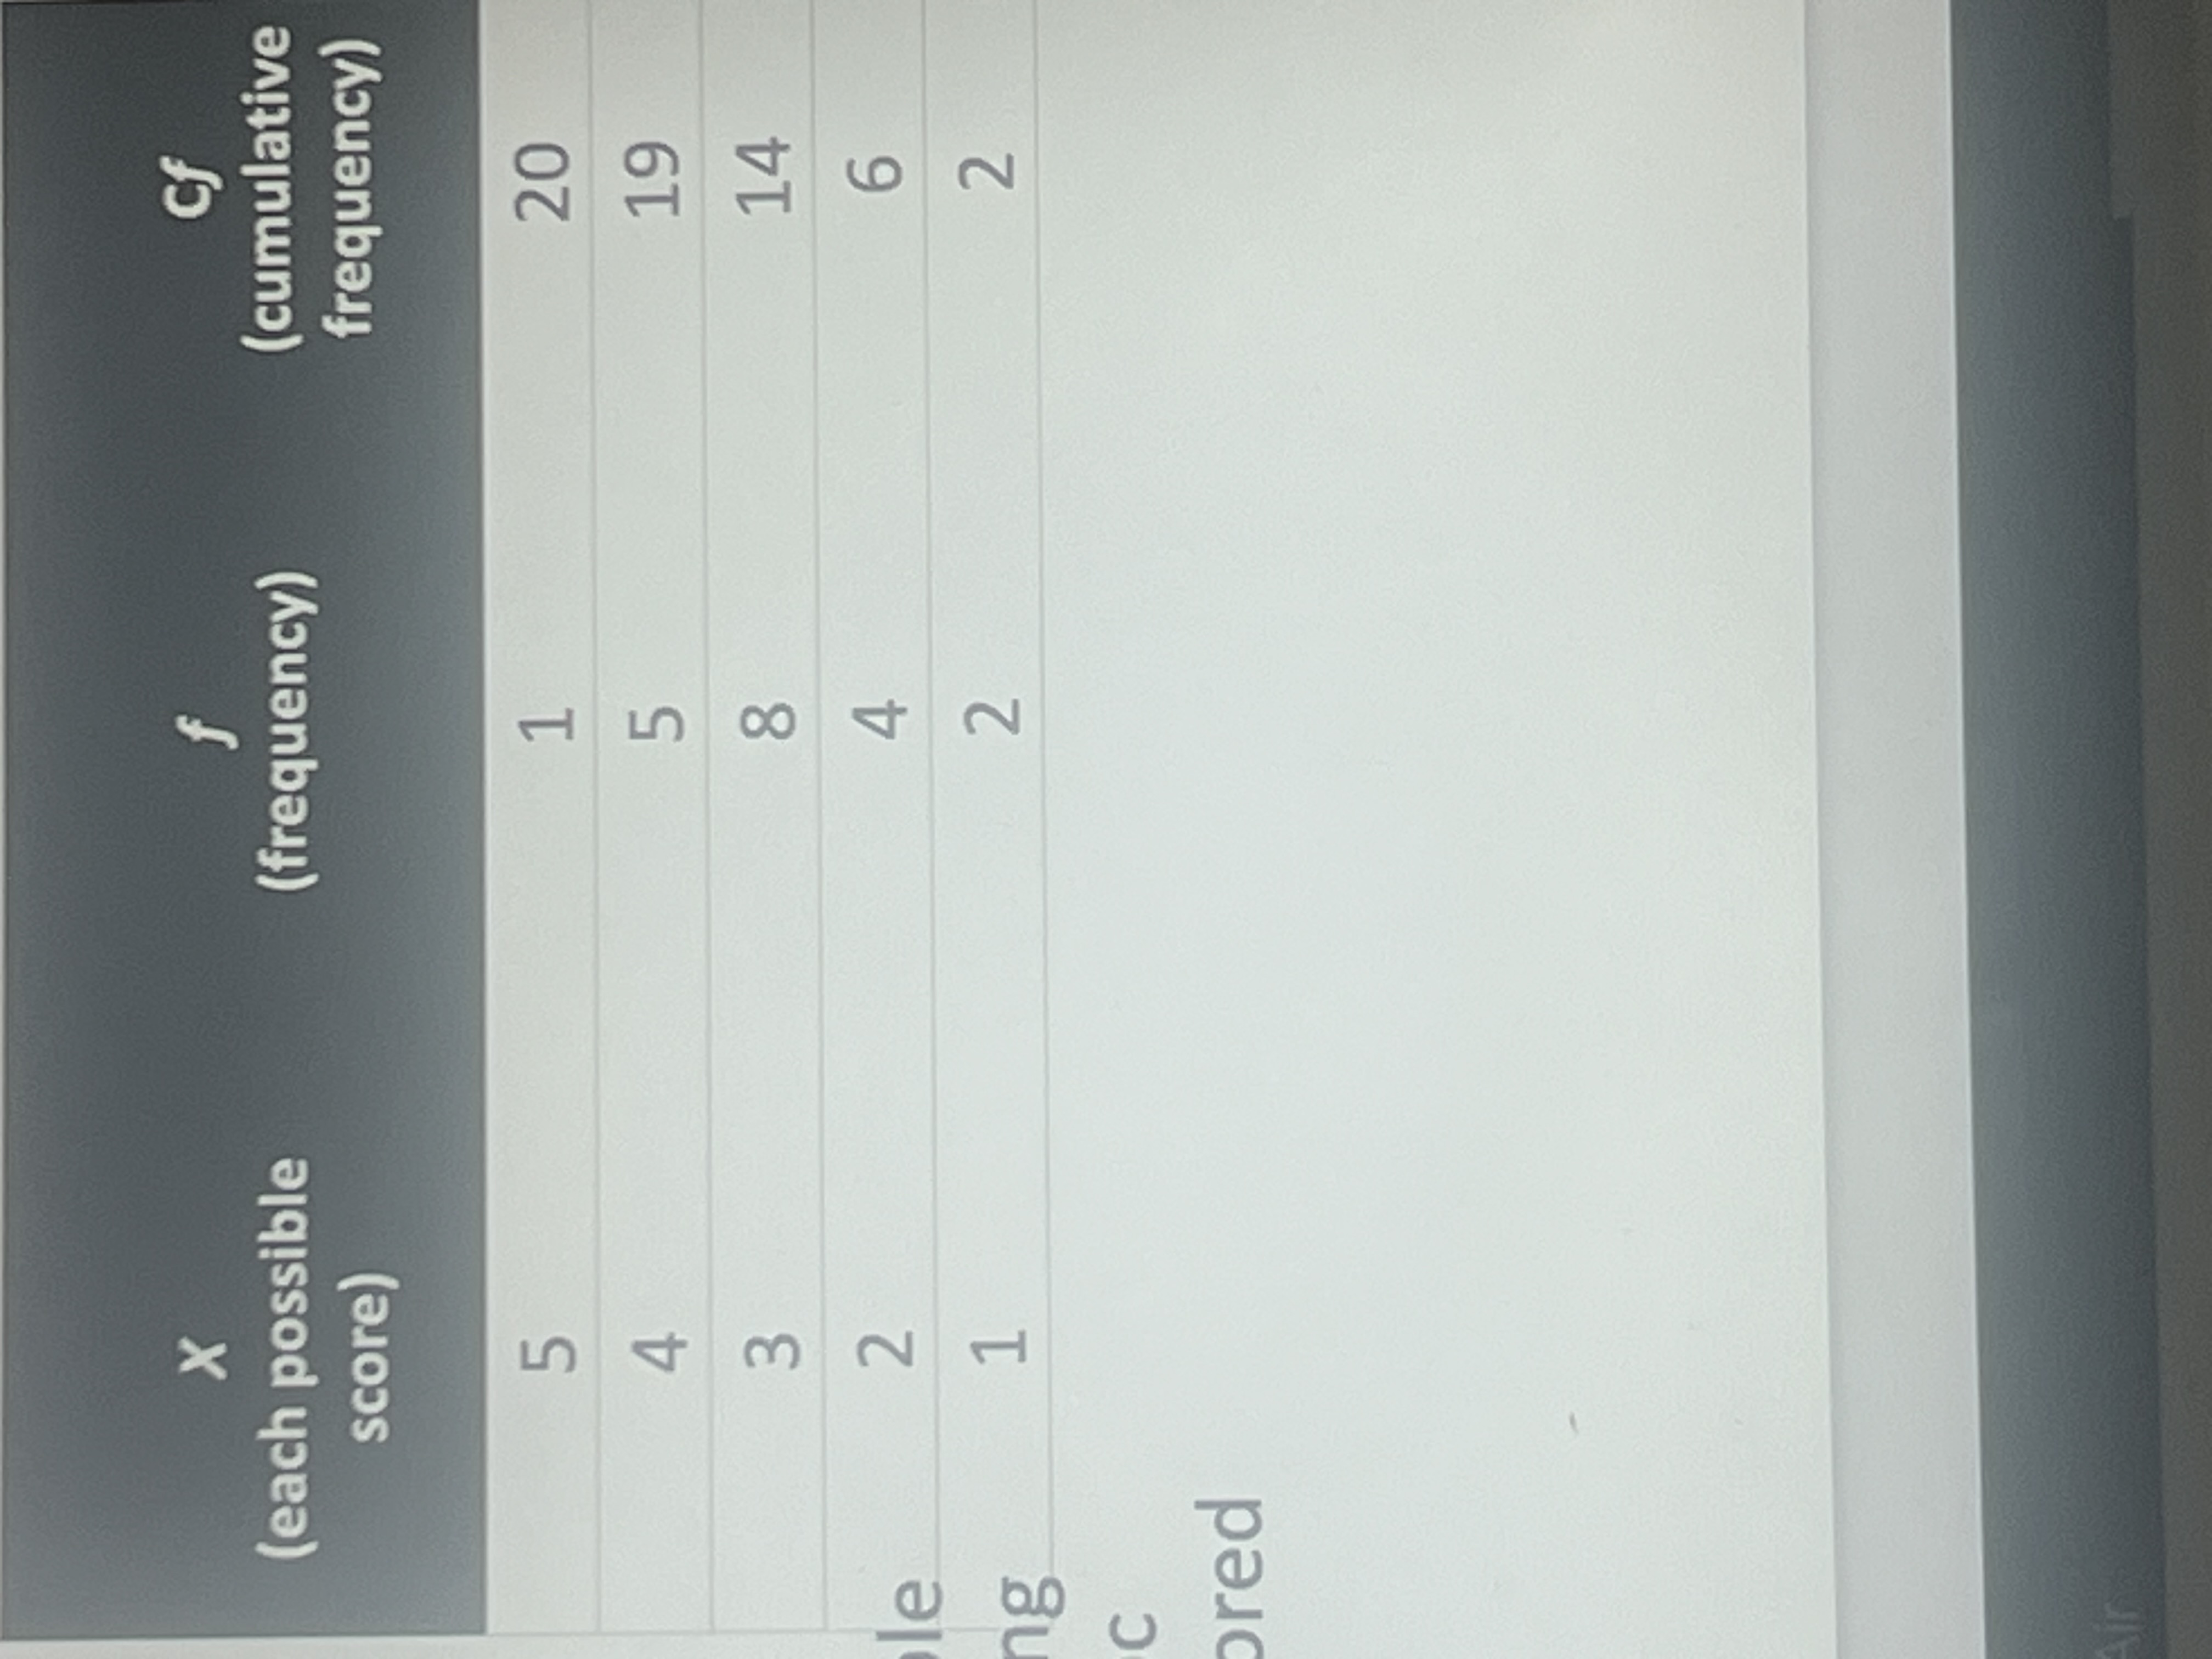
Cumulative frequency
The amount of people at or below a square
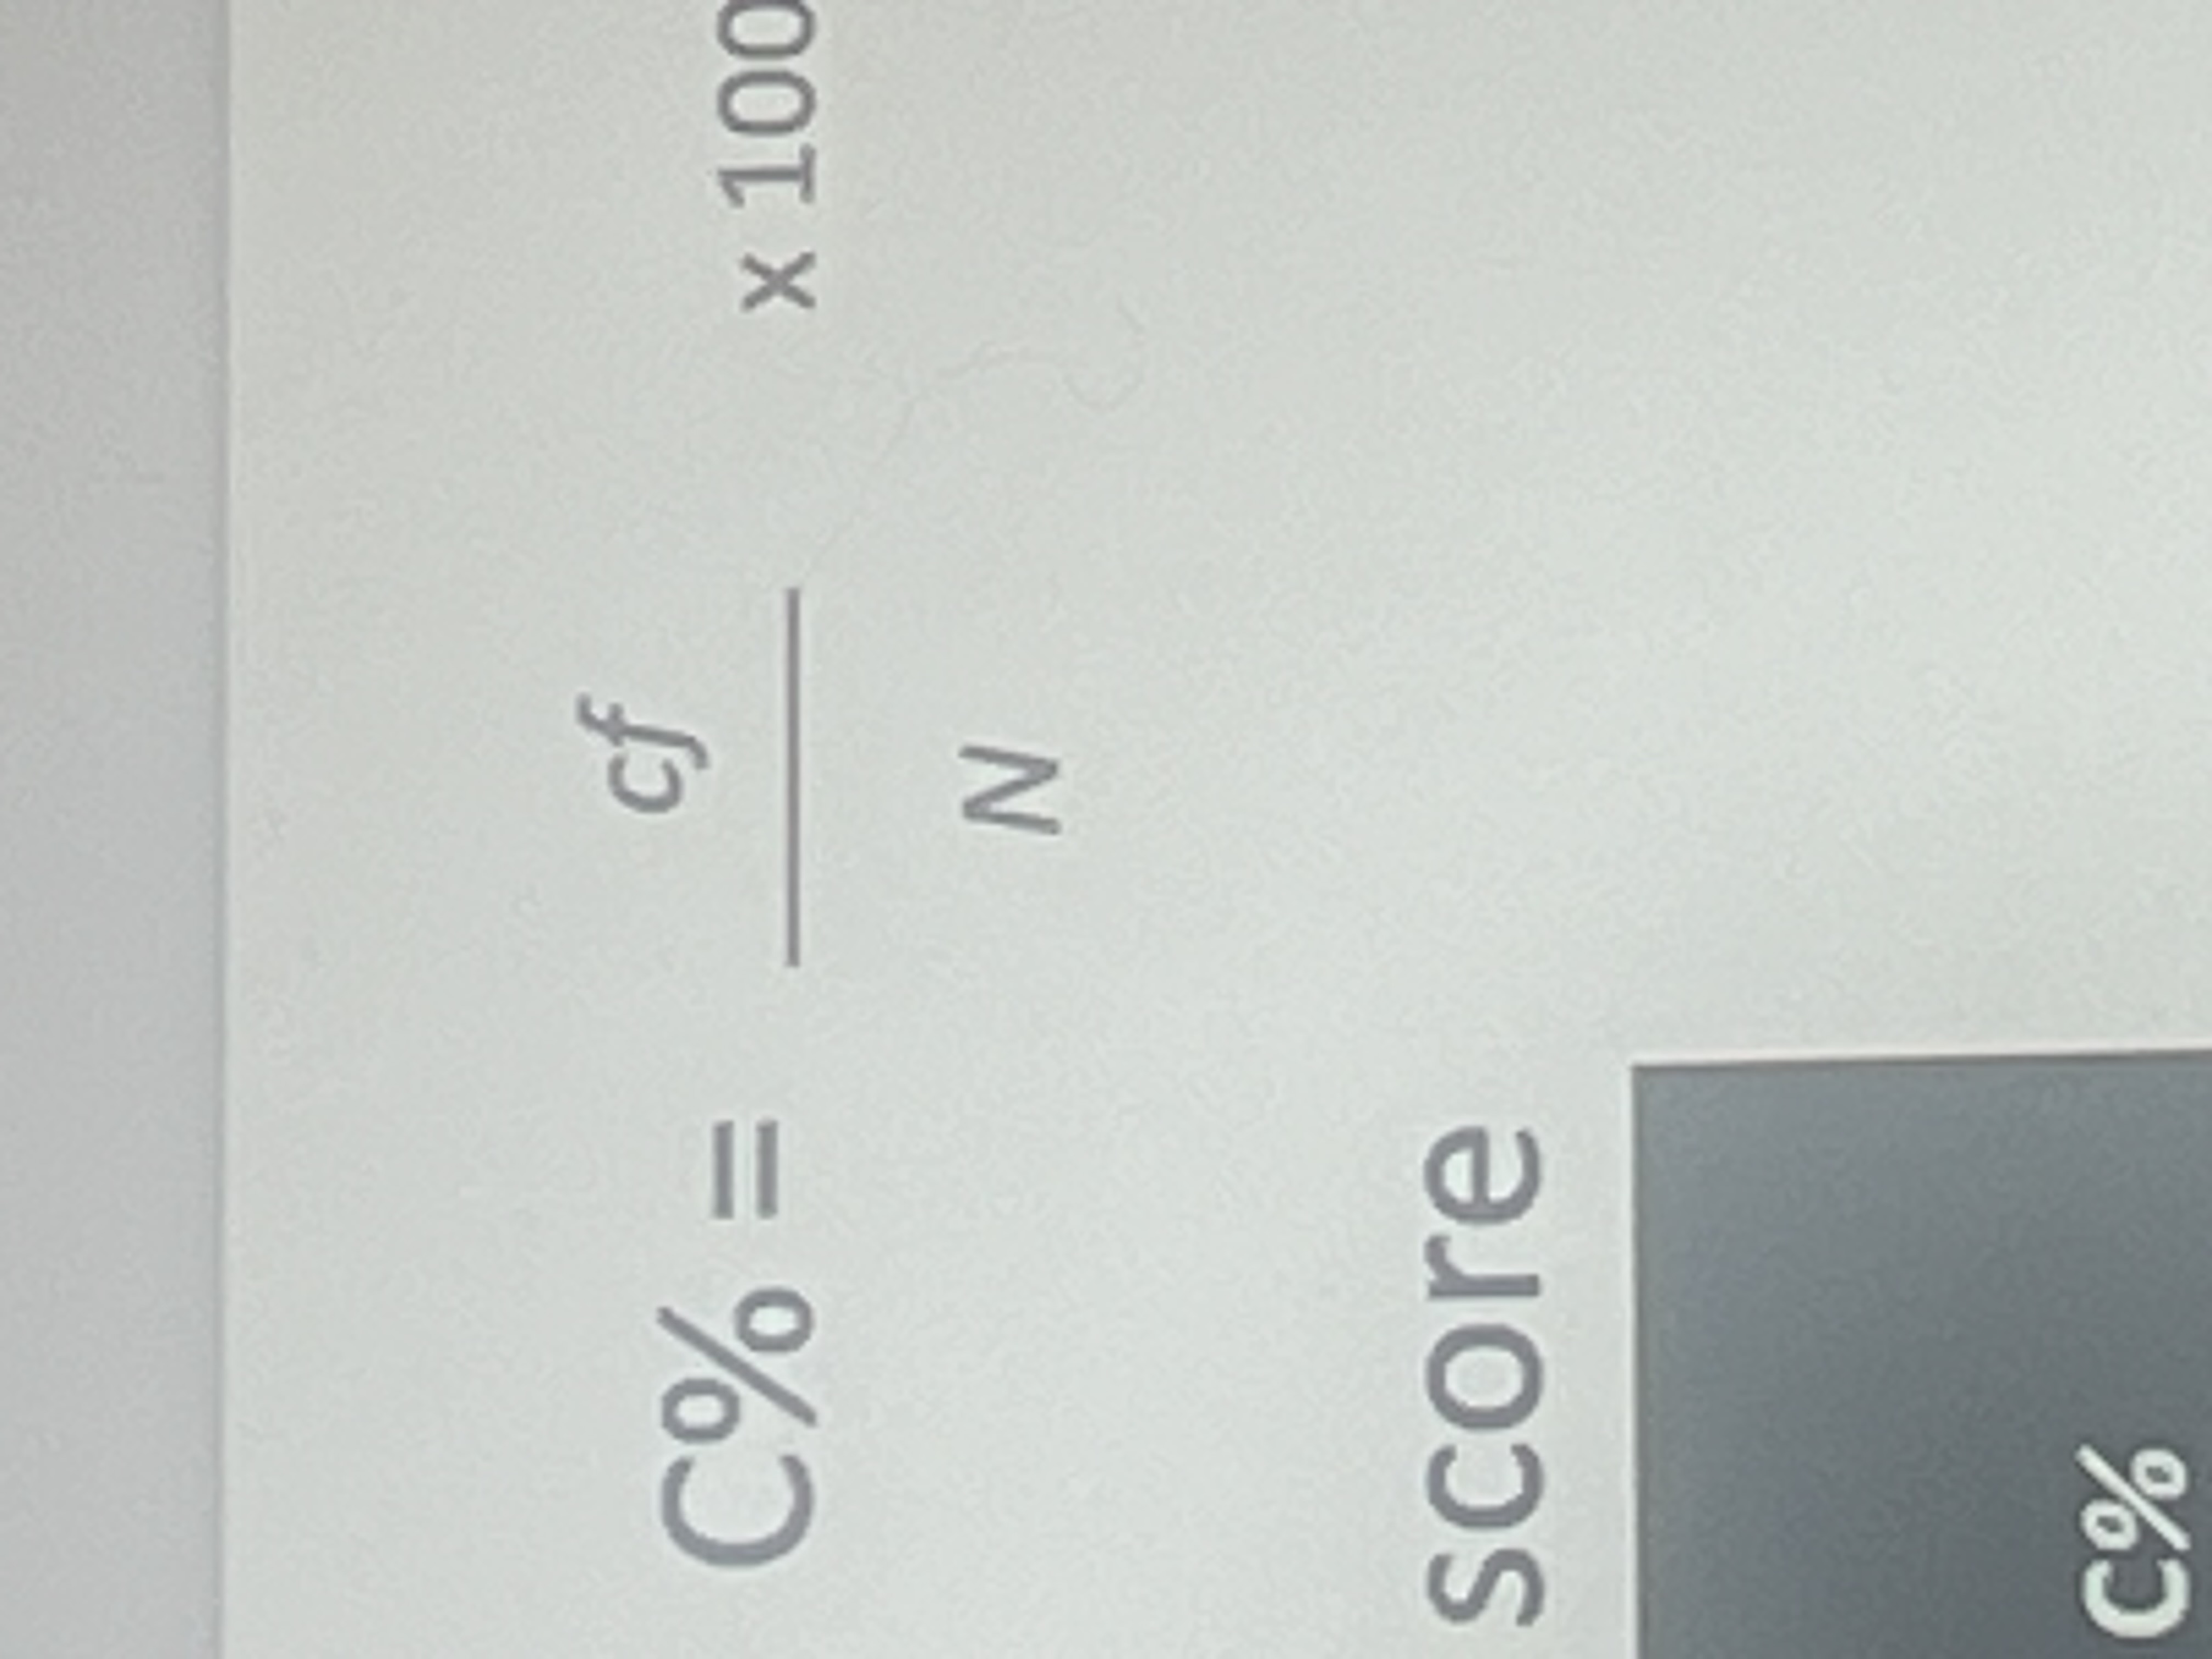
Cumulative percentage equation (percentage rank)
C%= cf (cumulative frequency) divided by n x 100
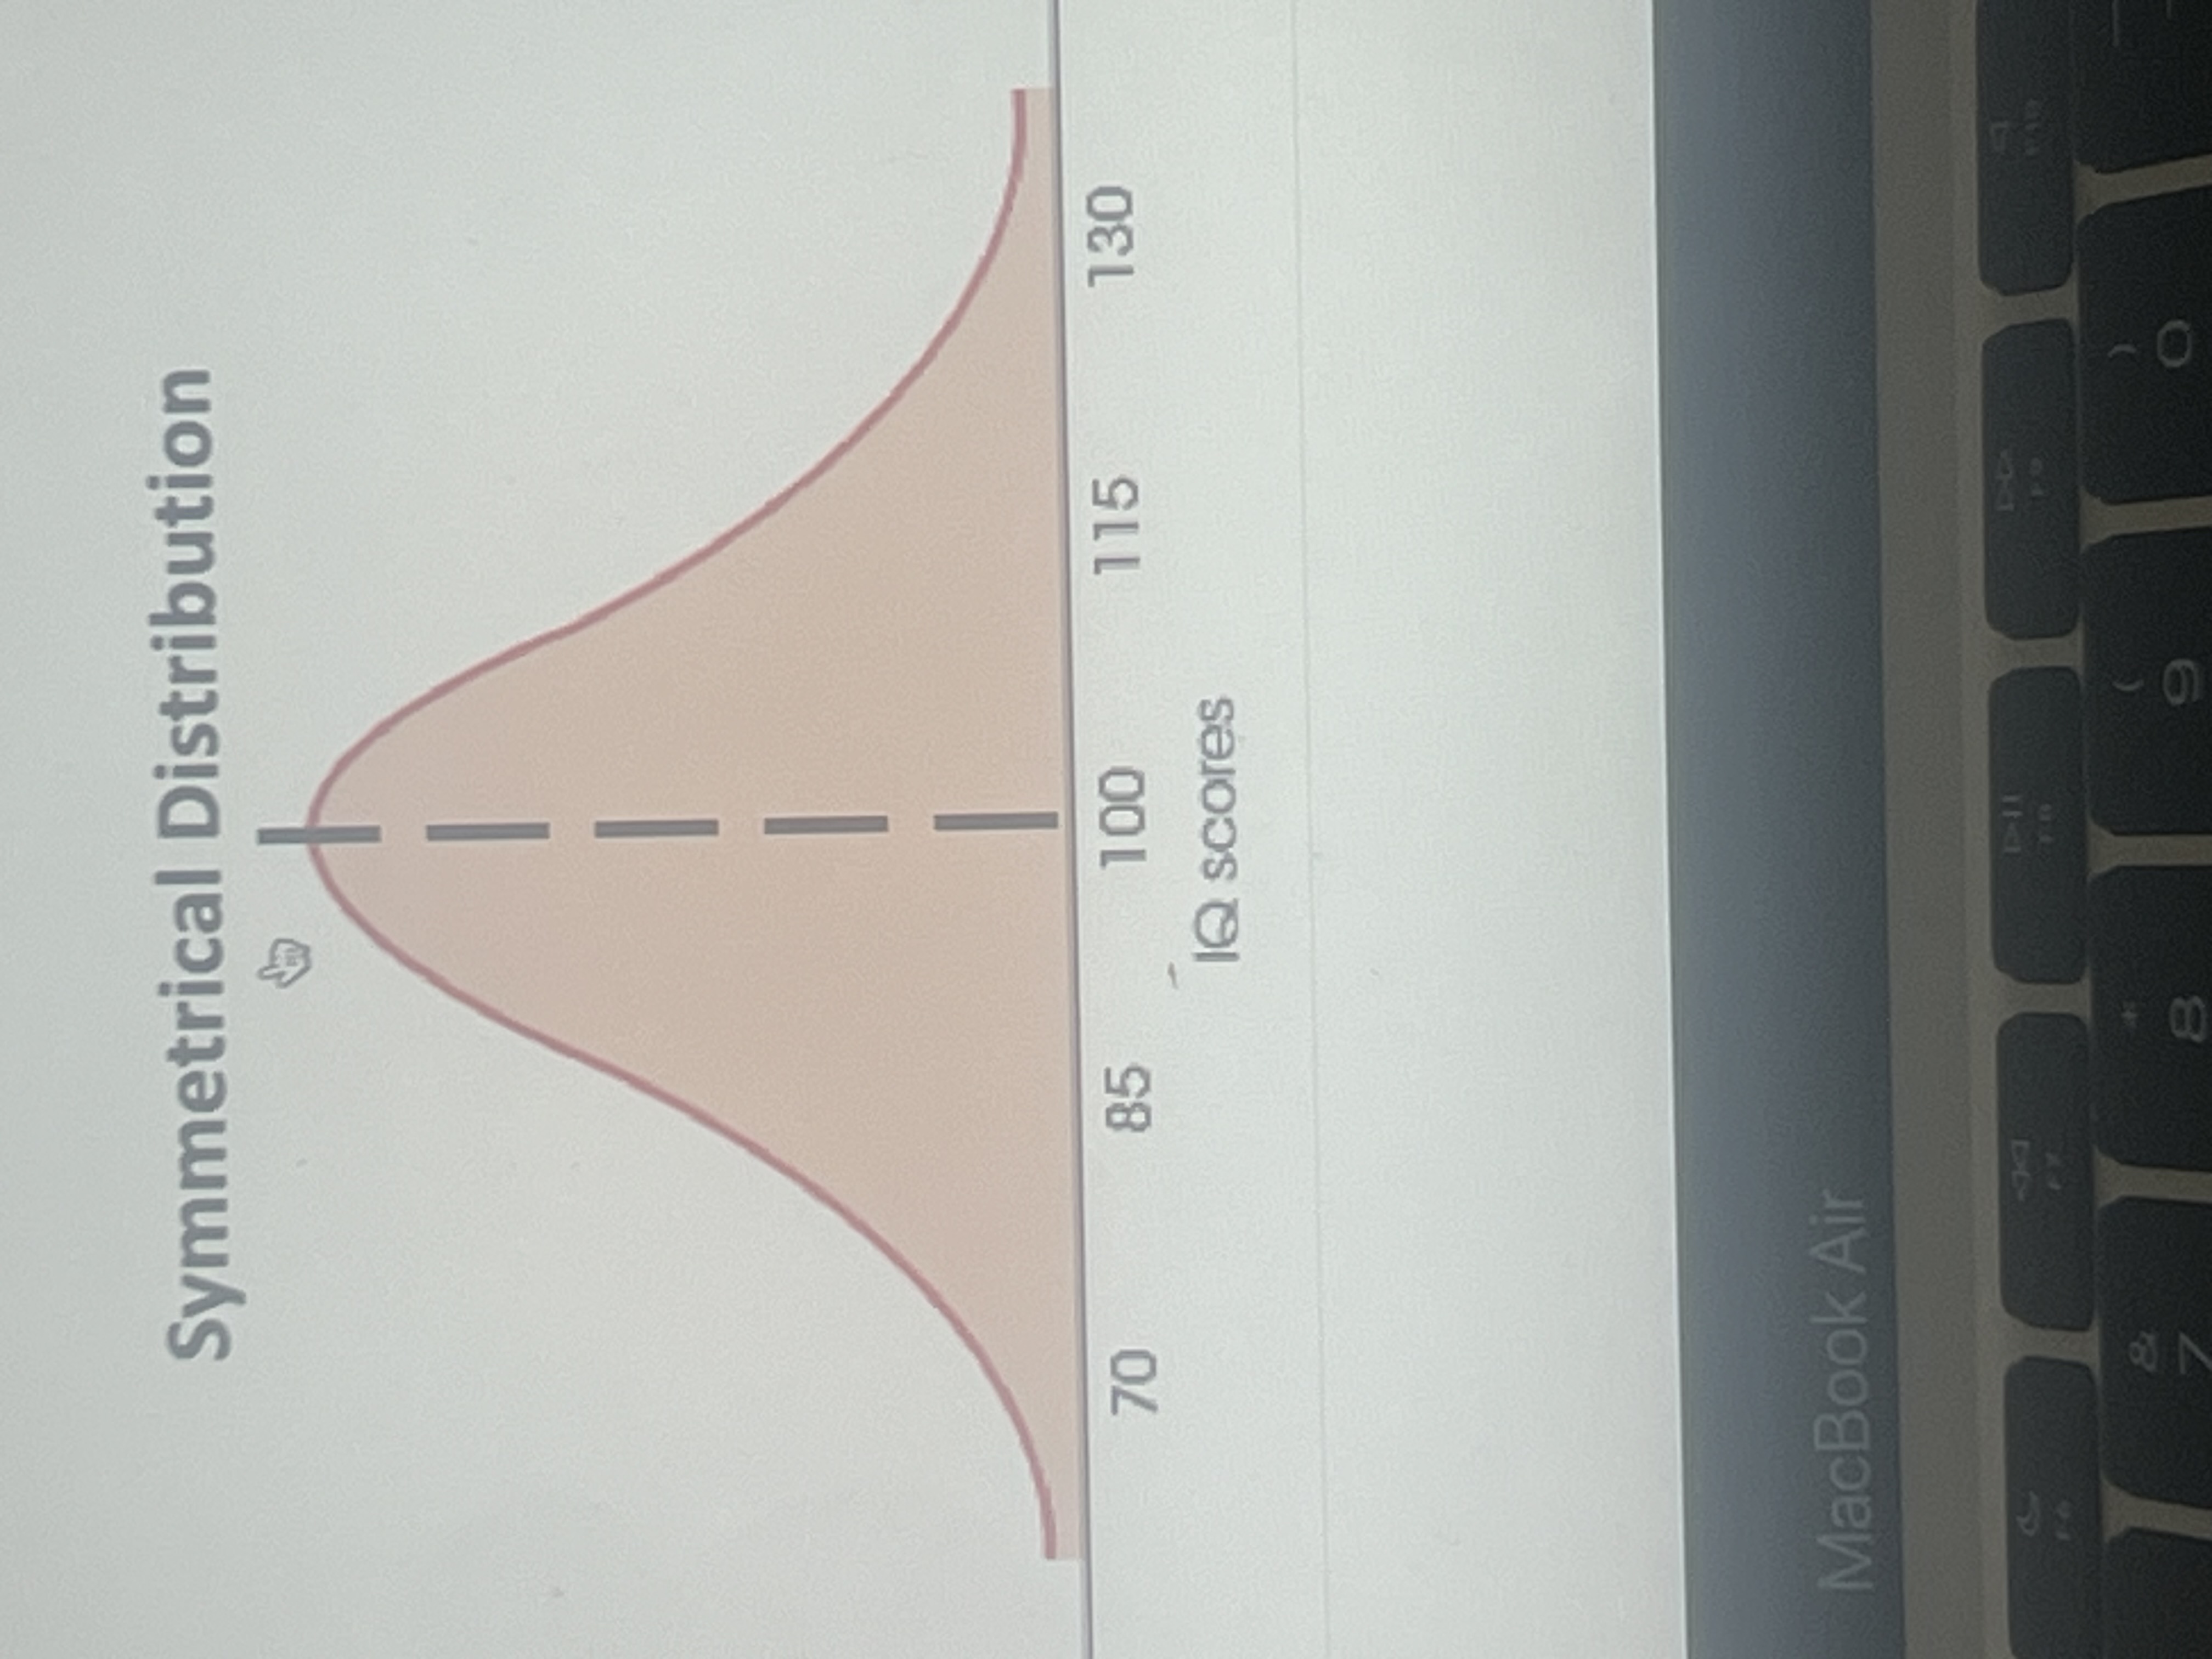
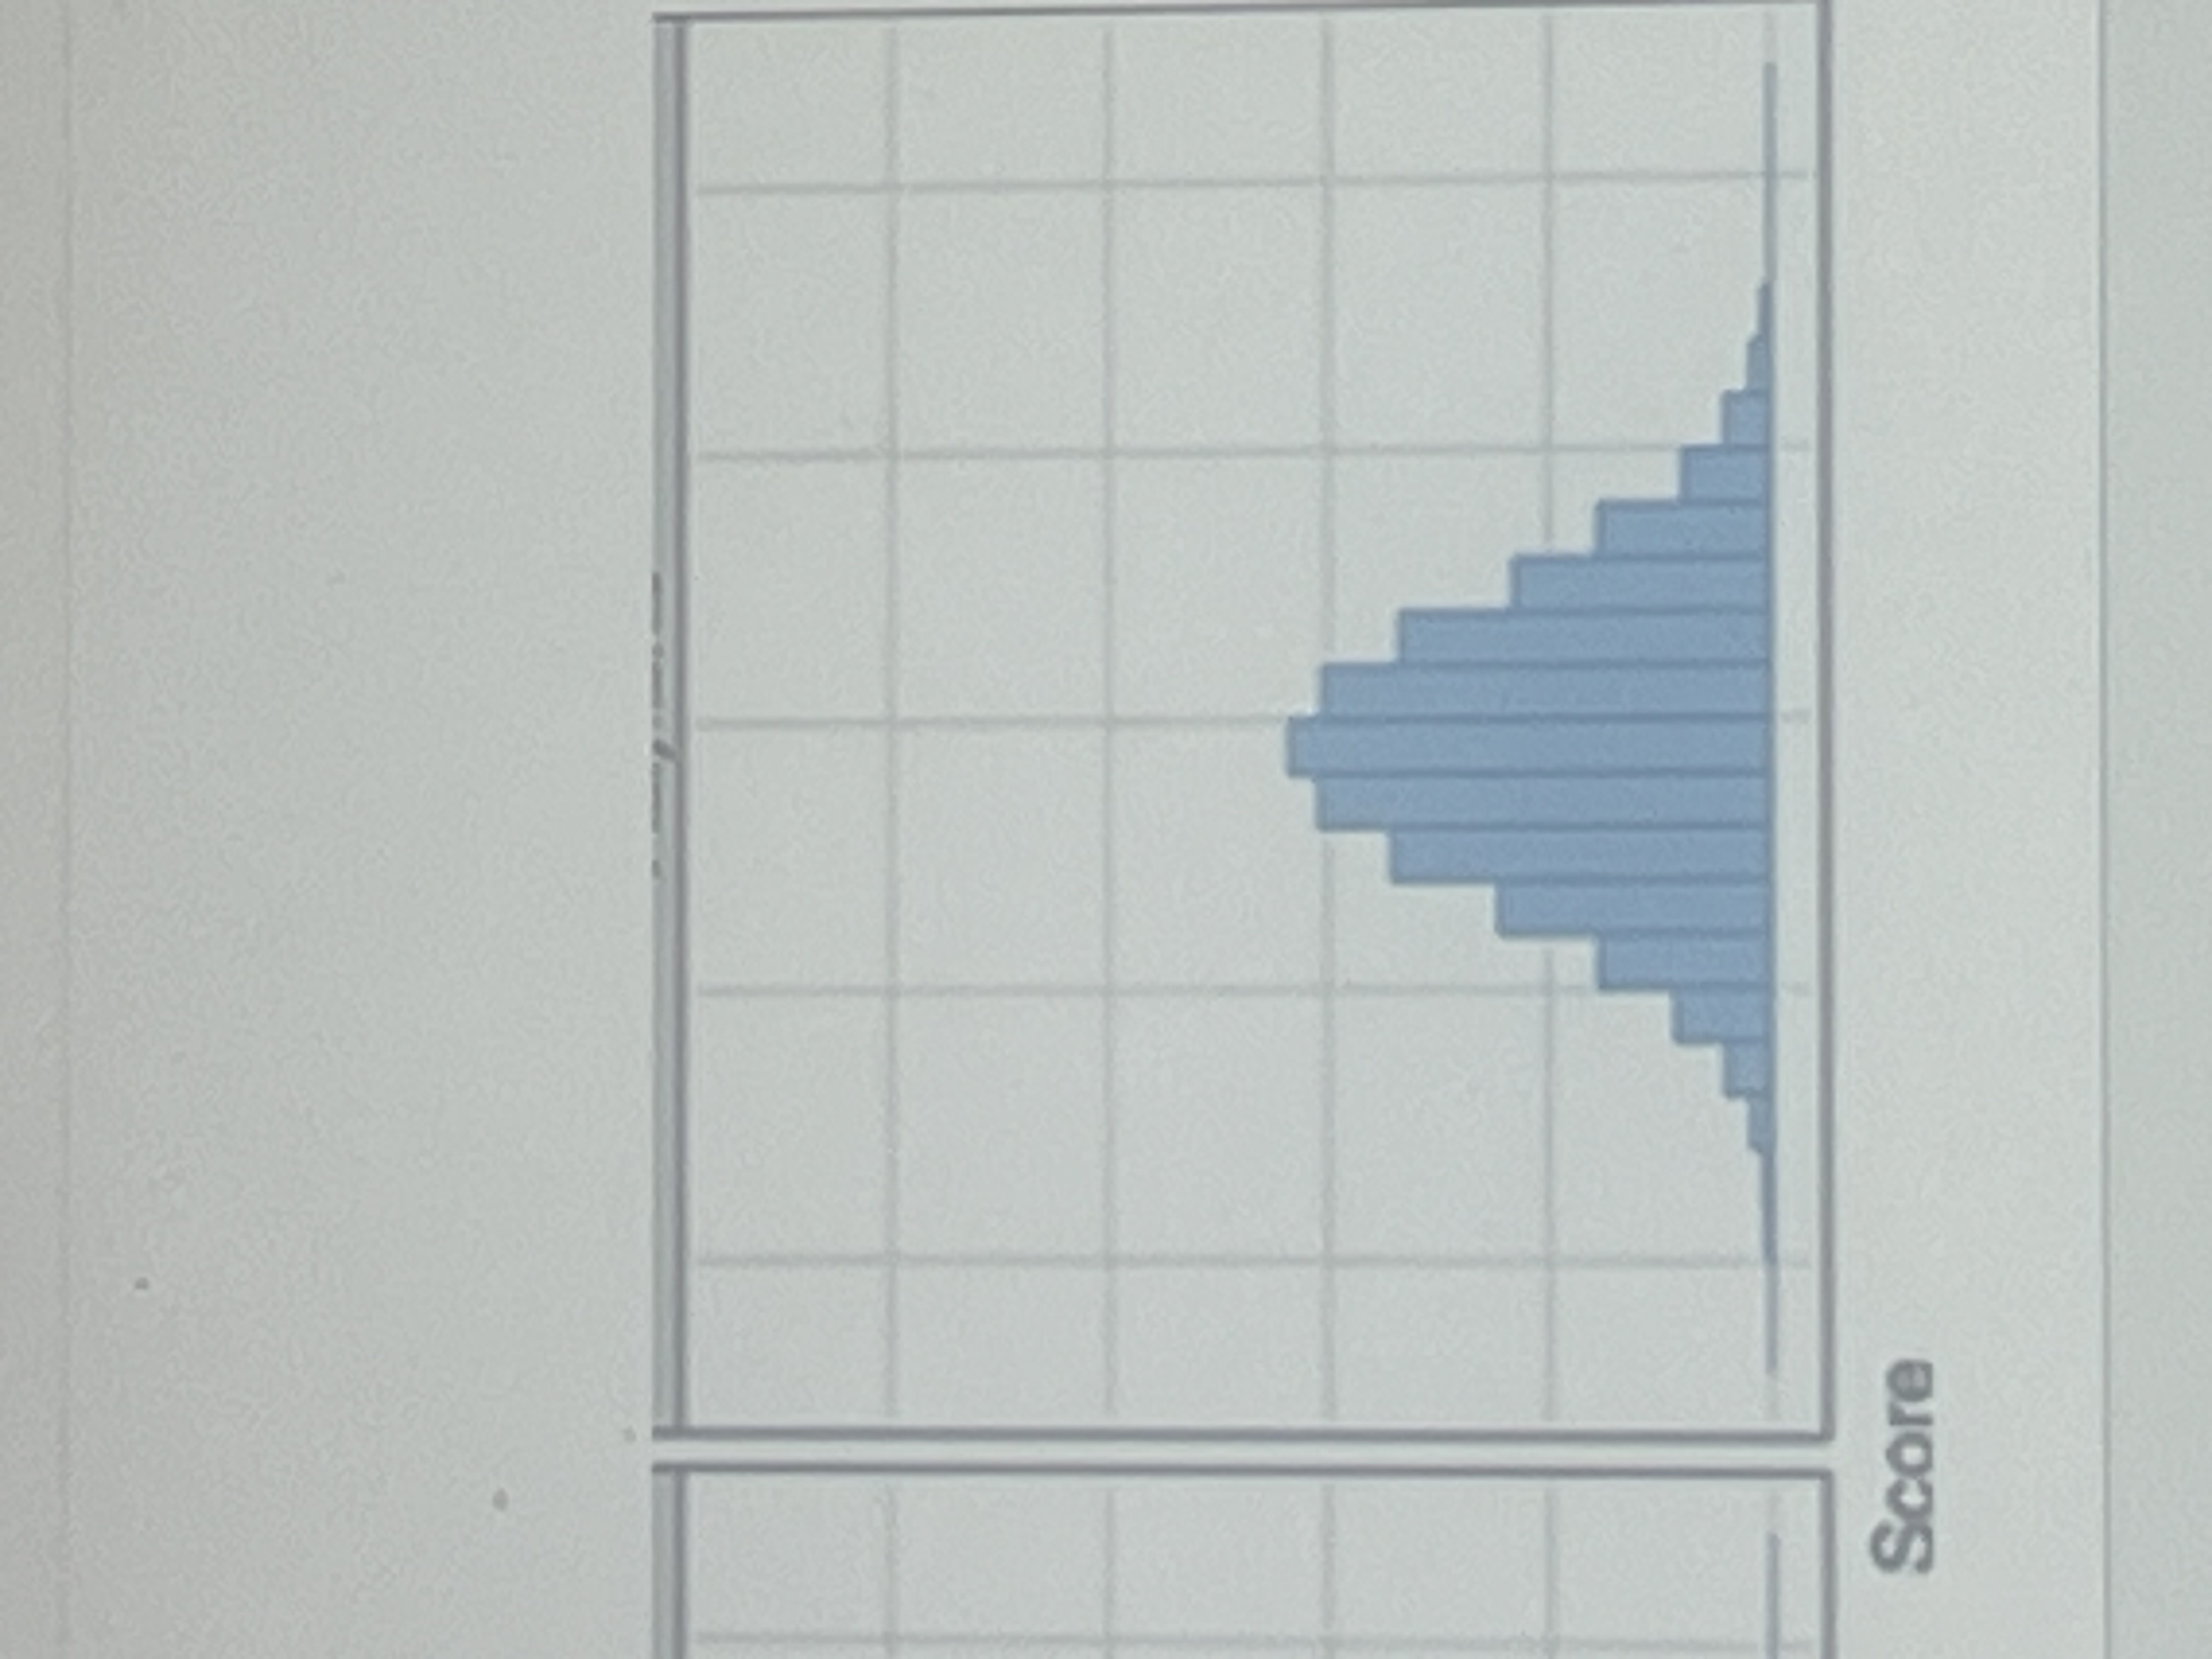
Symmetrical distribution
If it’s perfectly symmetrical, it means the main median and mode are the same
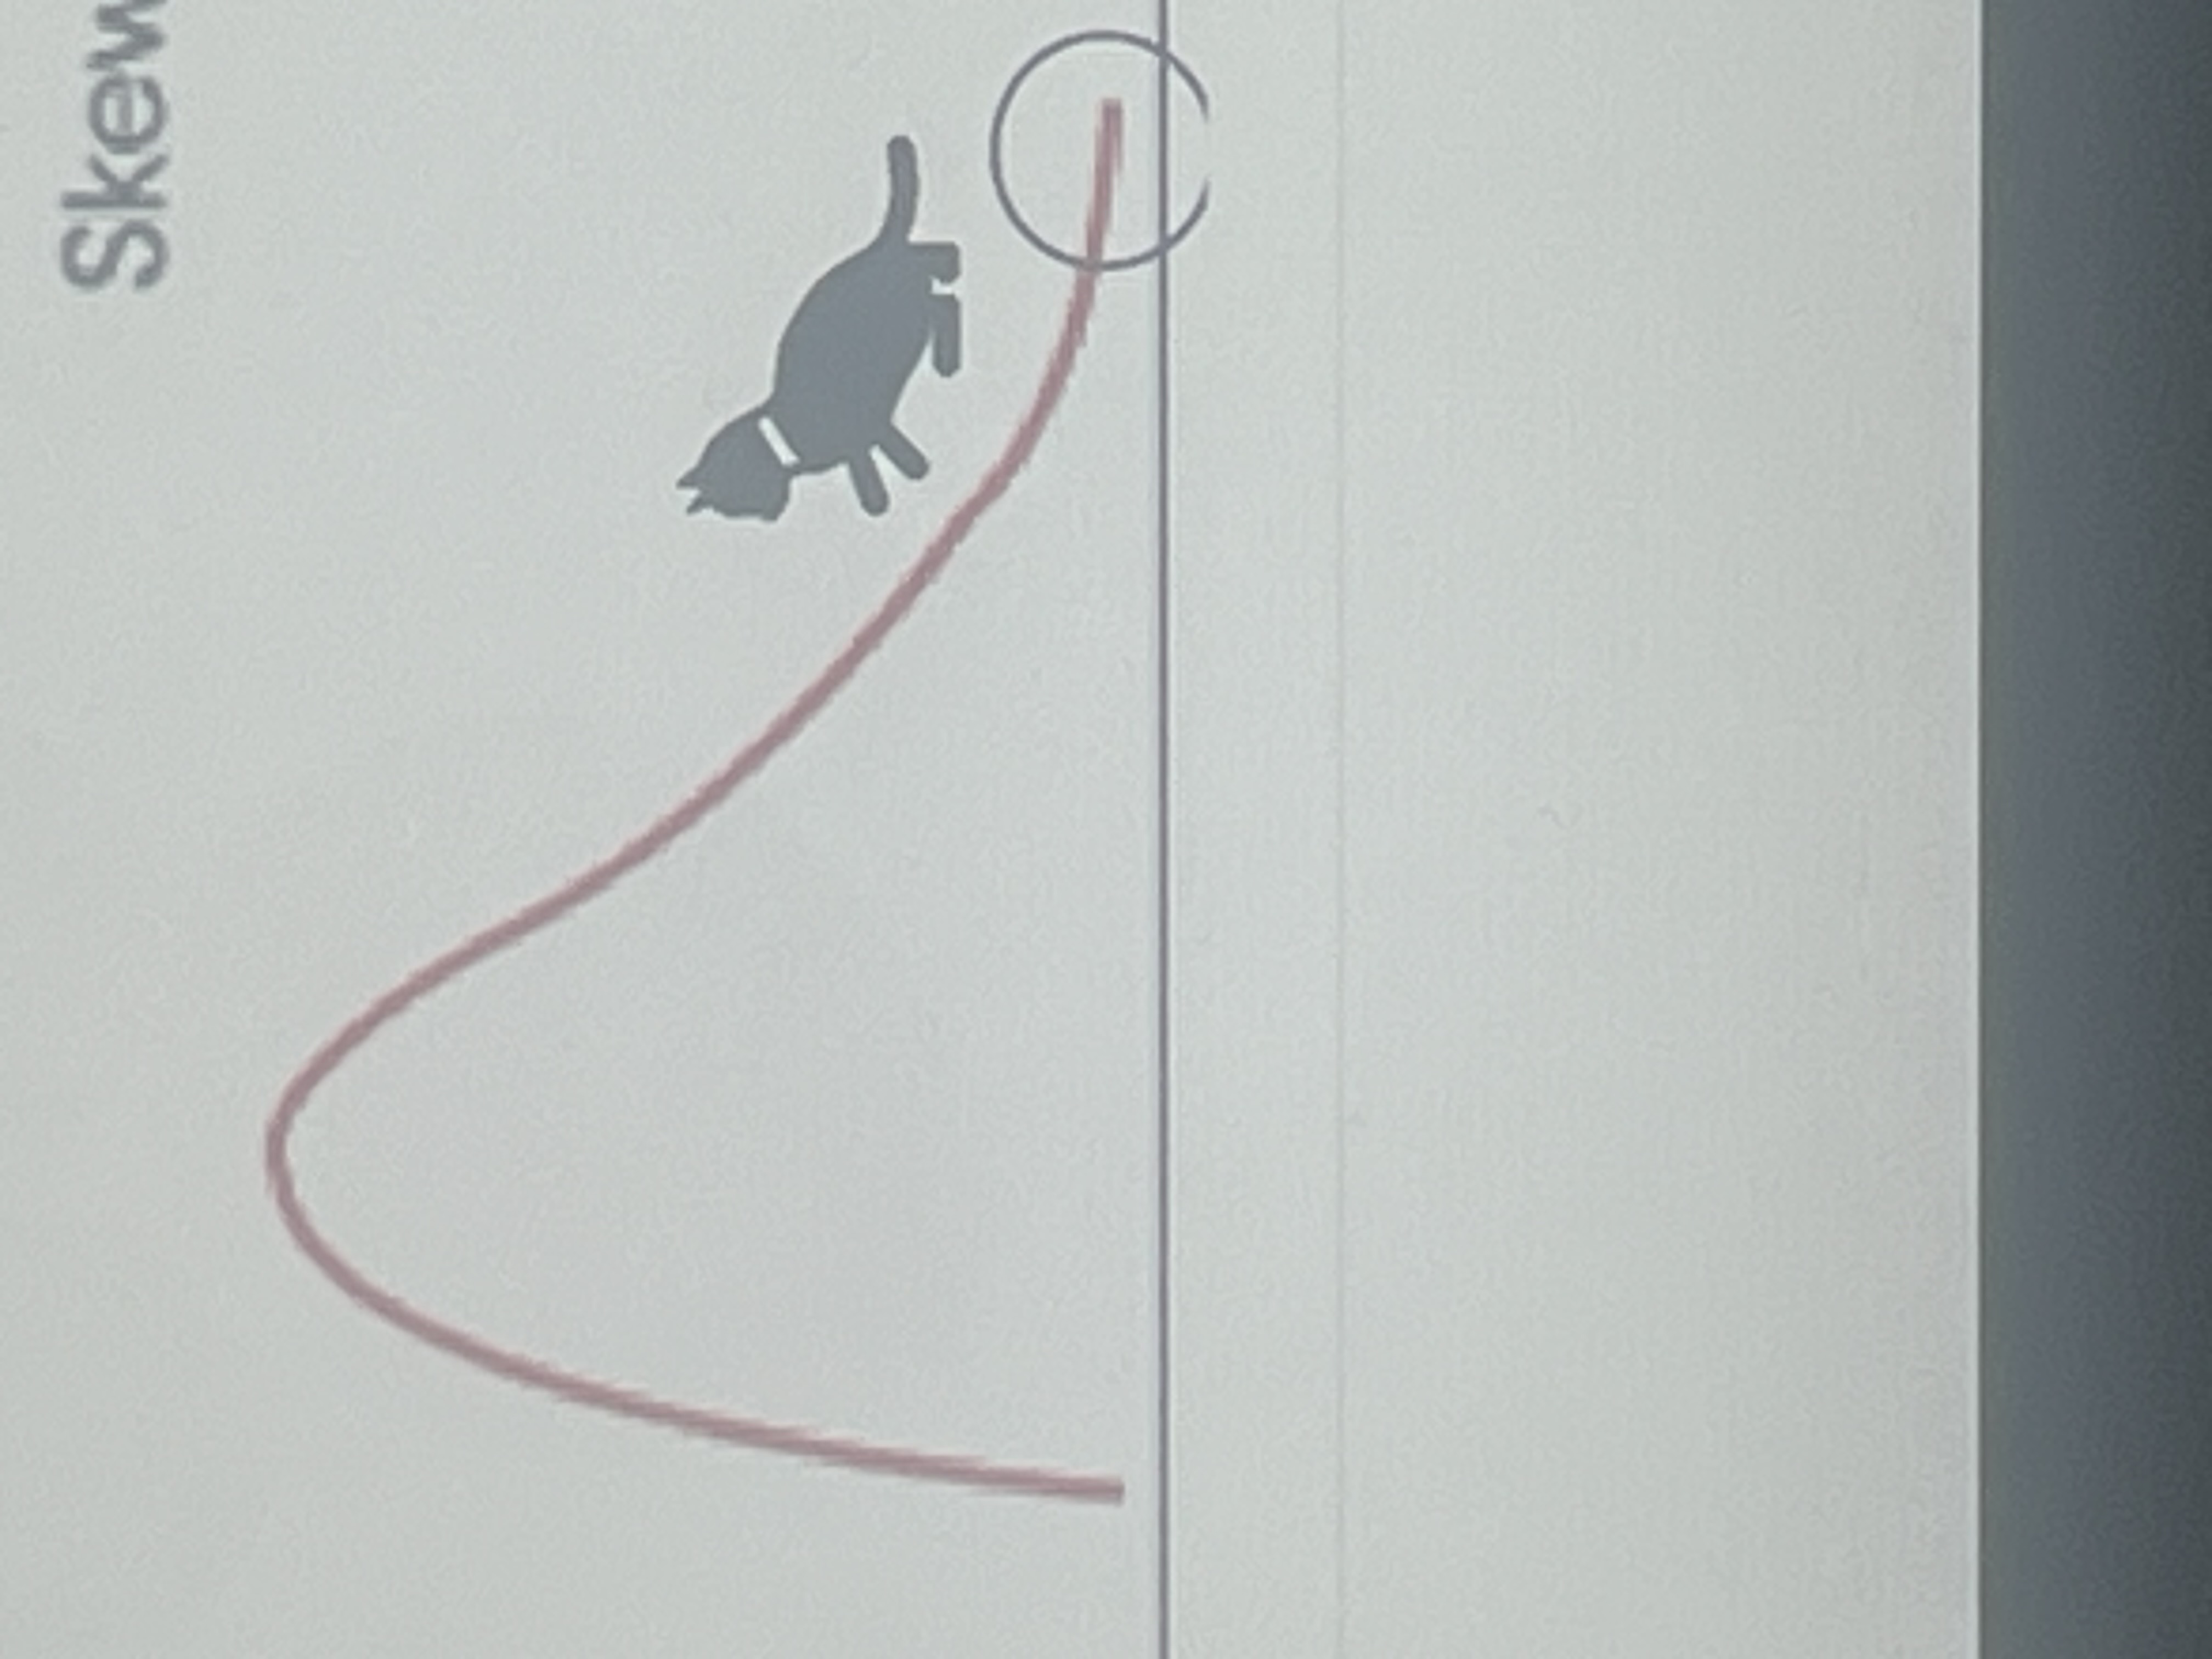
Positive skew
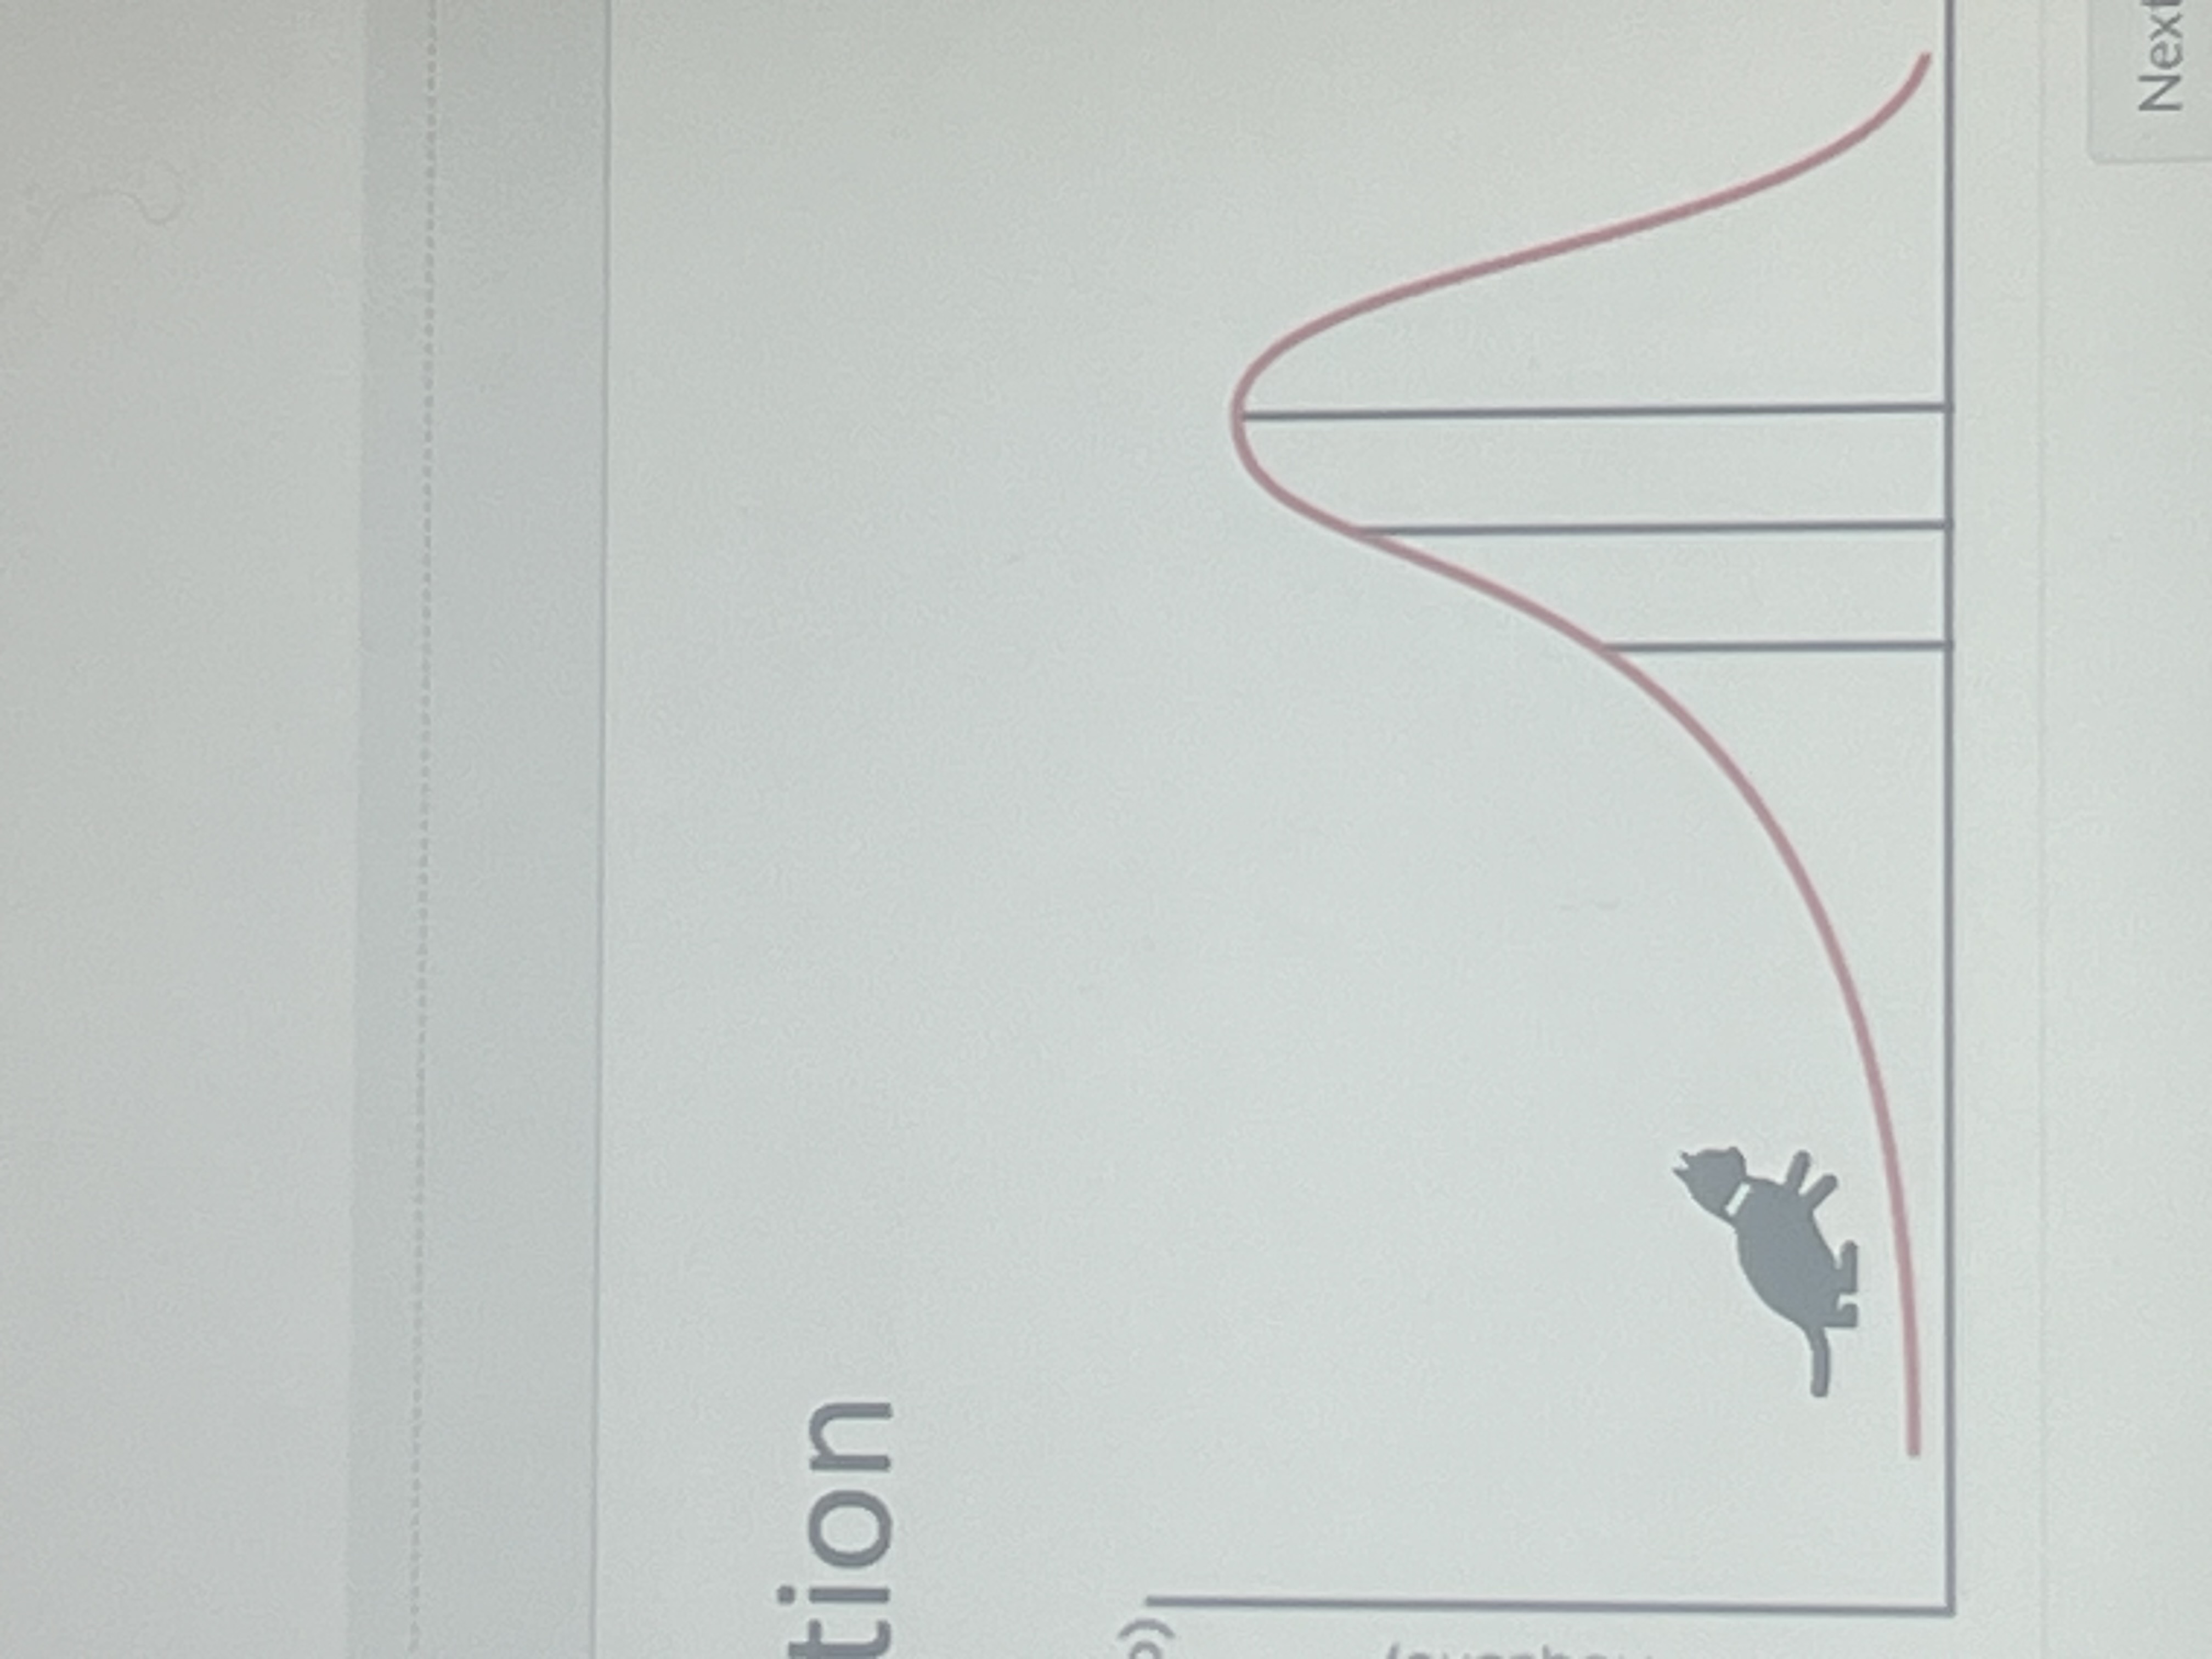
Negative skew
Skew
The symmetry of the distribution
Kurtosis
The heaviness of the tails
Leptokurtic
Heavy tails (pointy) higher probability of extreme values
Platykurtic
Light tails (flatter)
Leptokurtic
Platykurtic
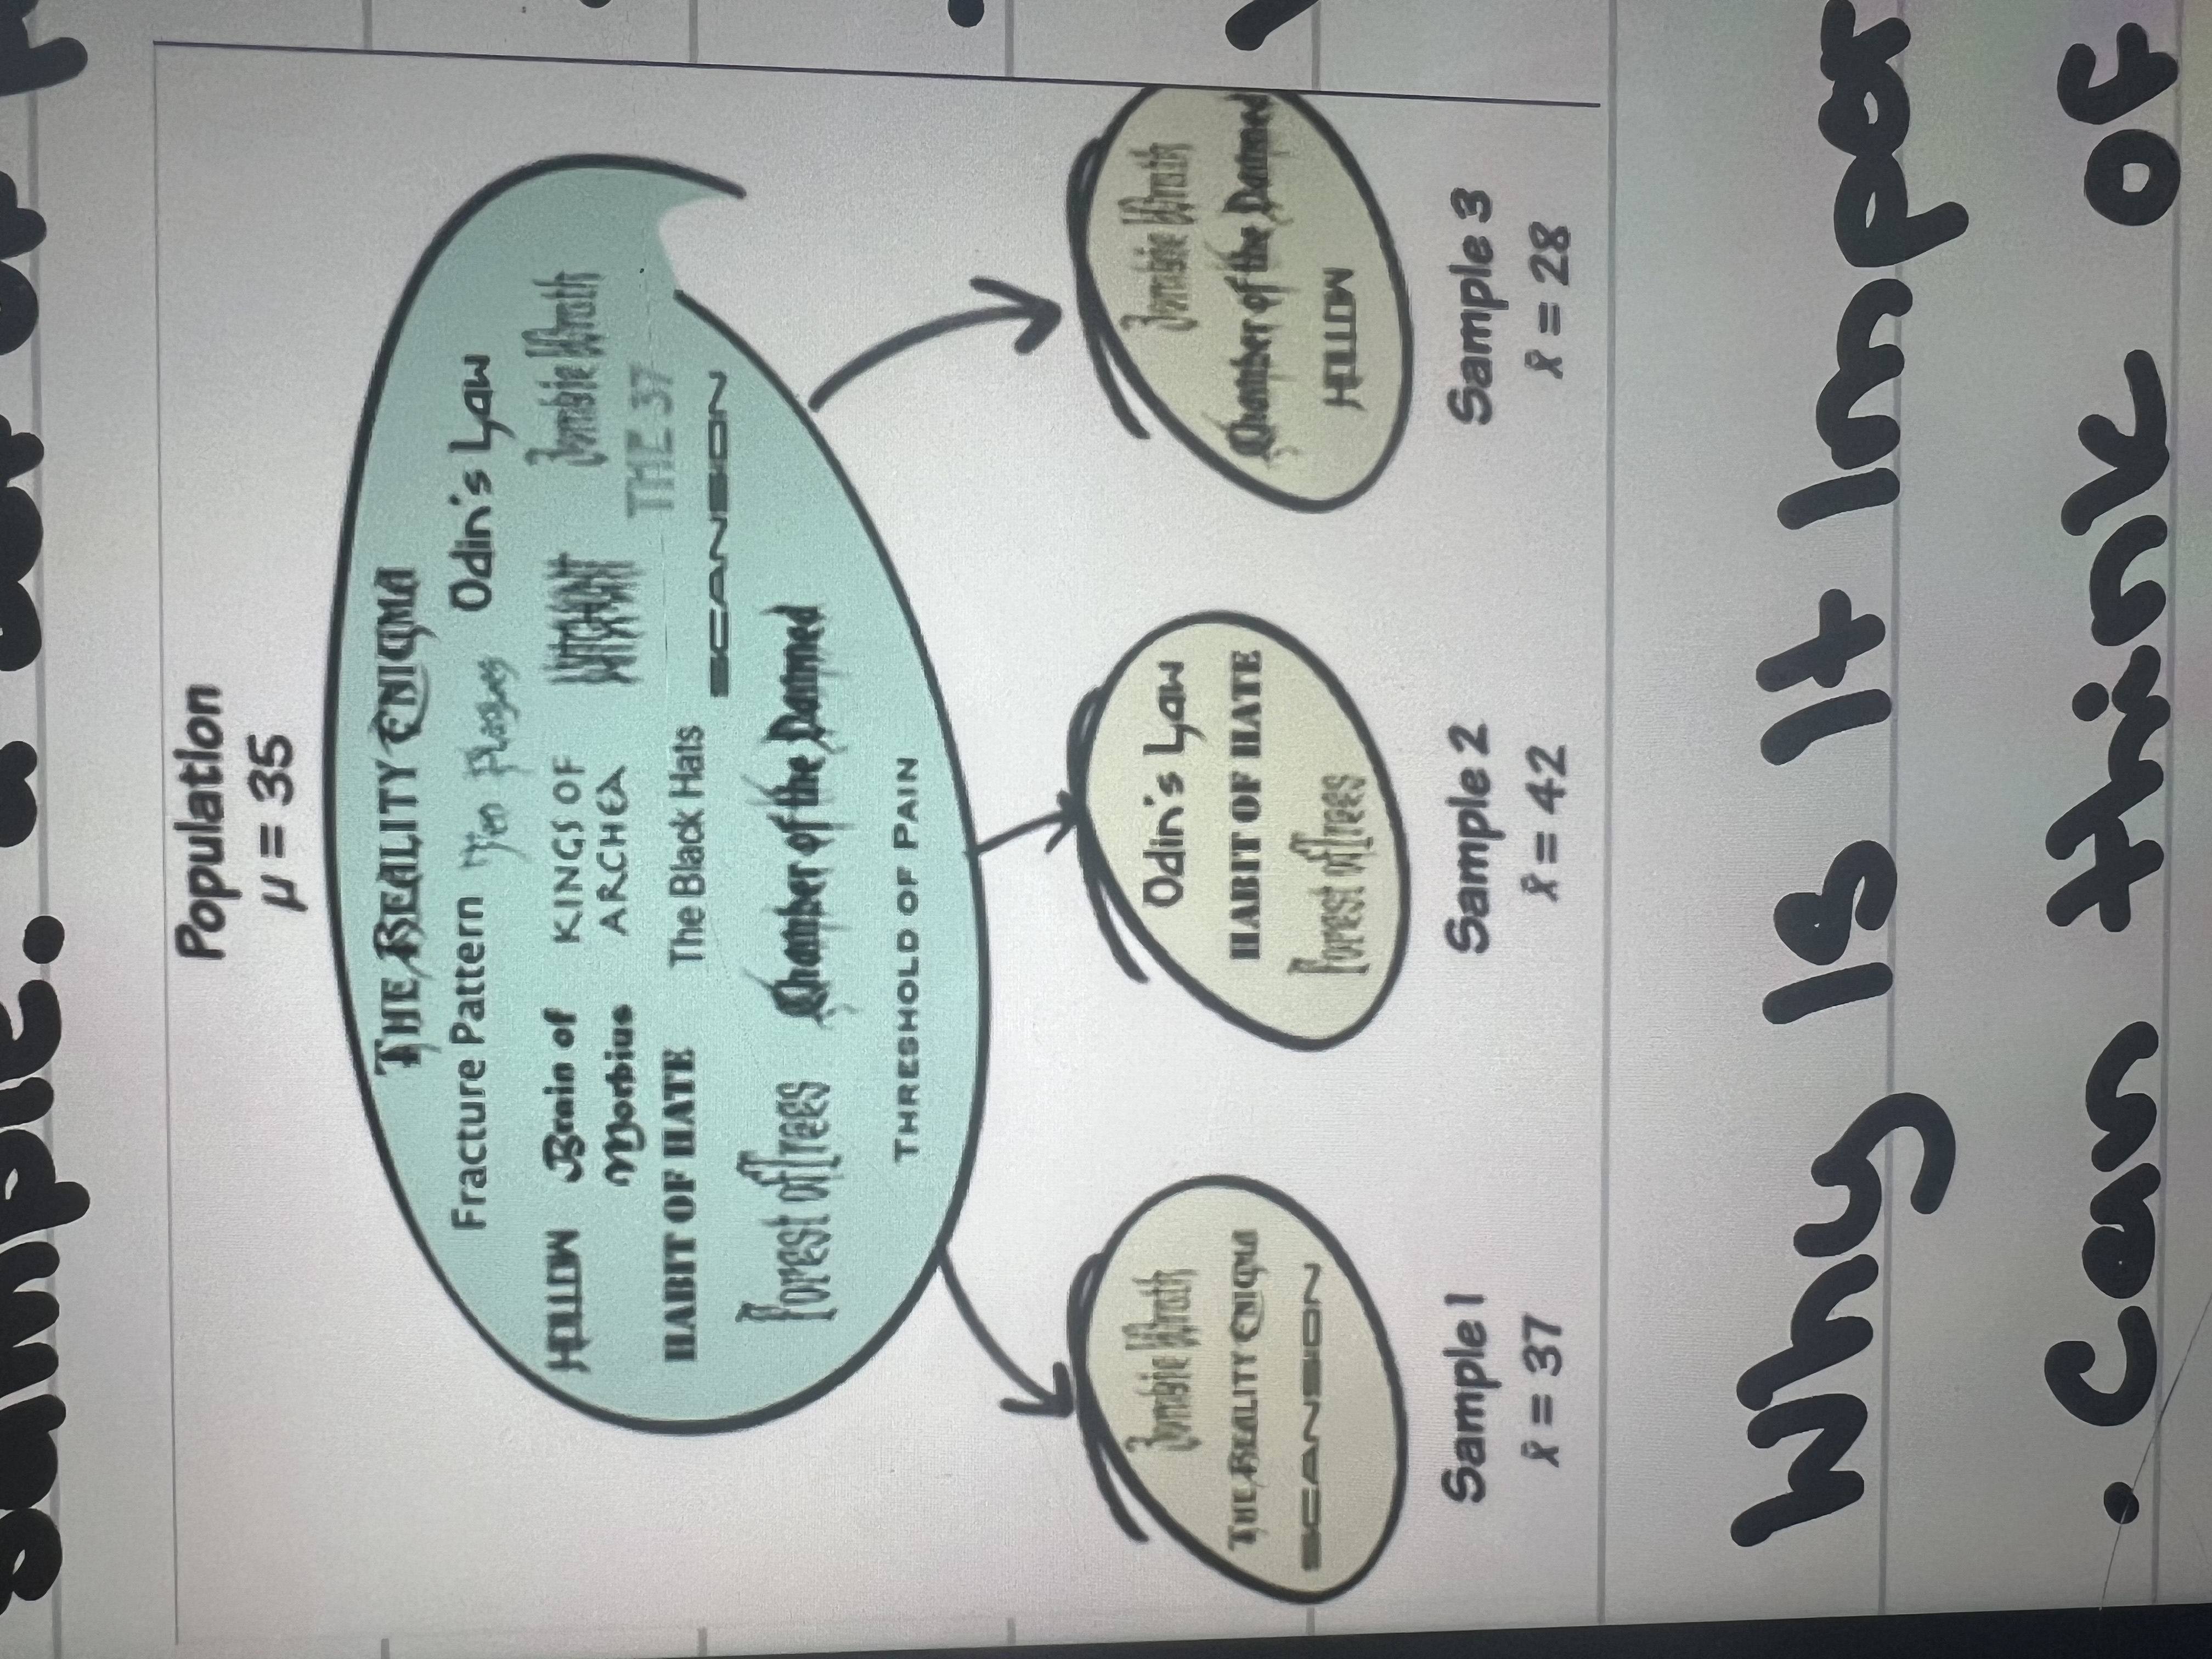
Population
The group of people you wanna study (eg. First year university students in Canada.)
Sample
A set of people from the population you want to study (eg. First year, Ontario Tech student students.)
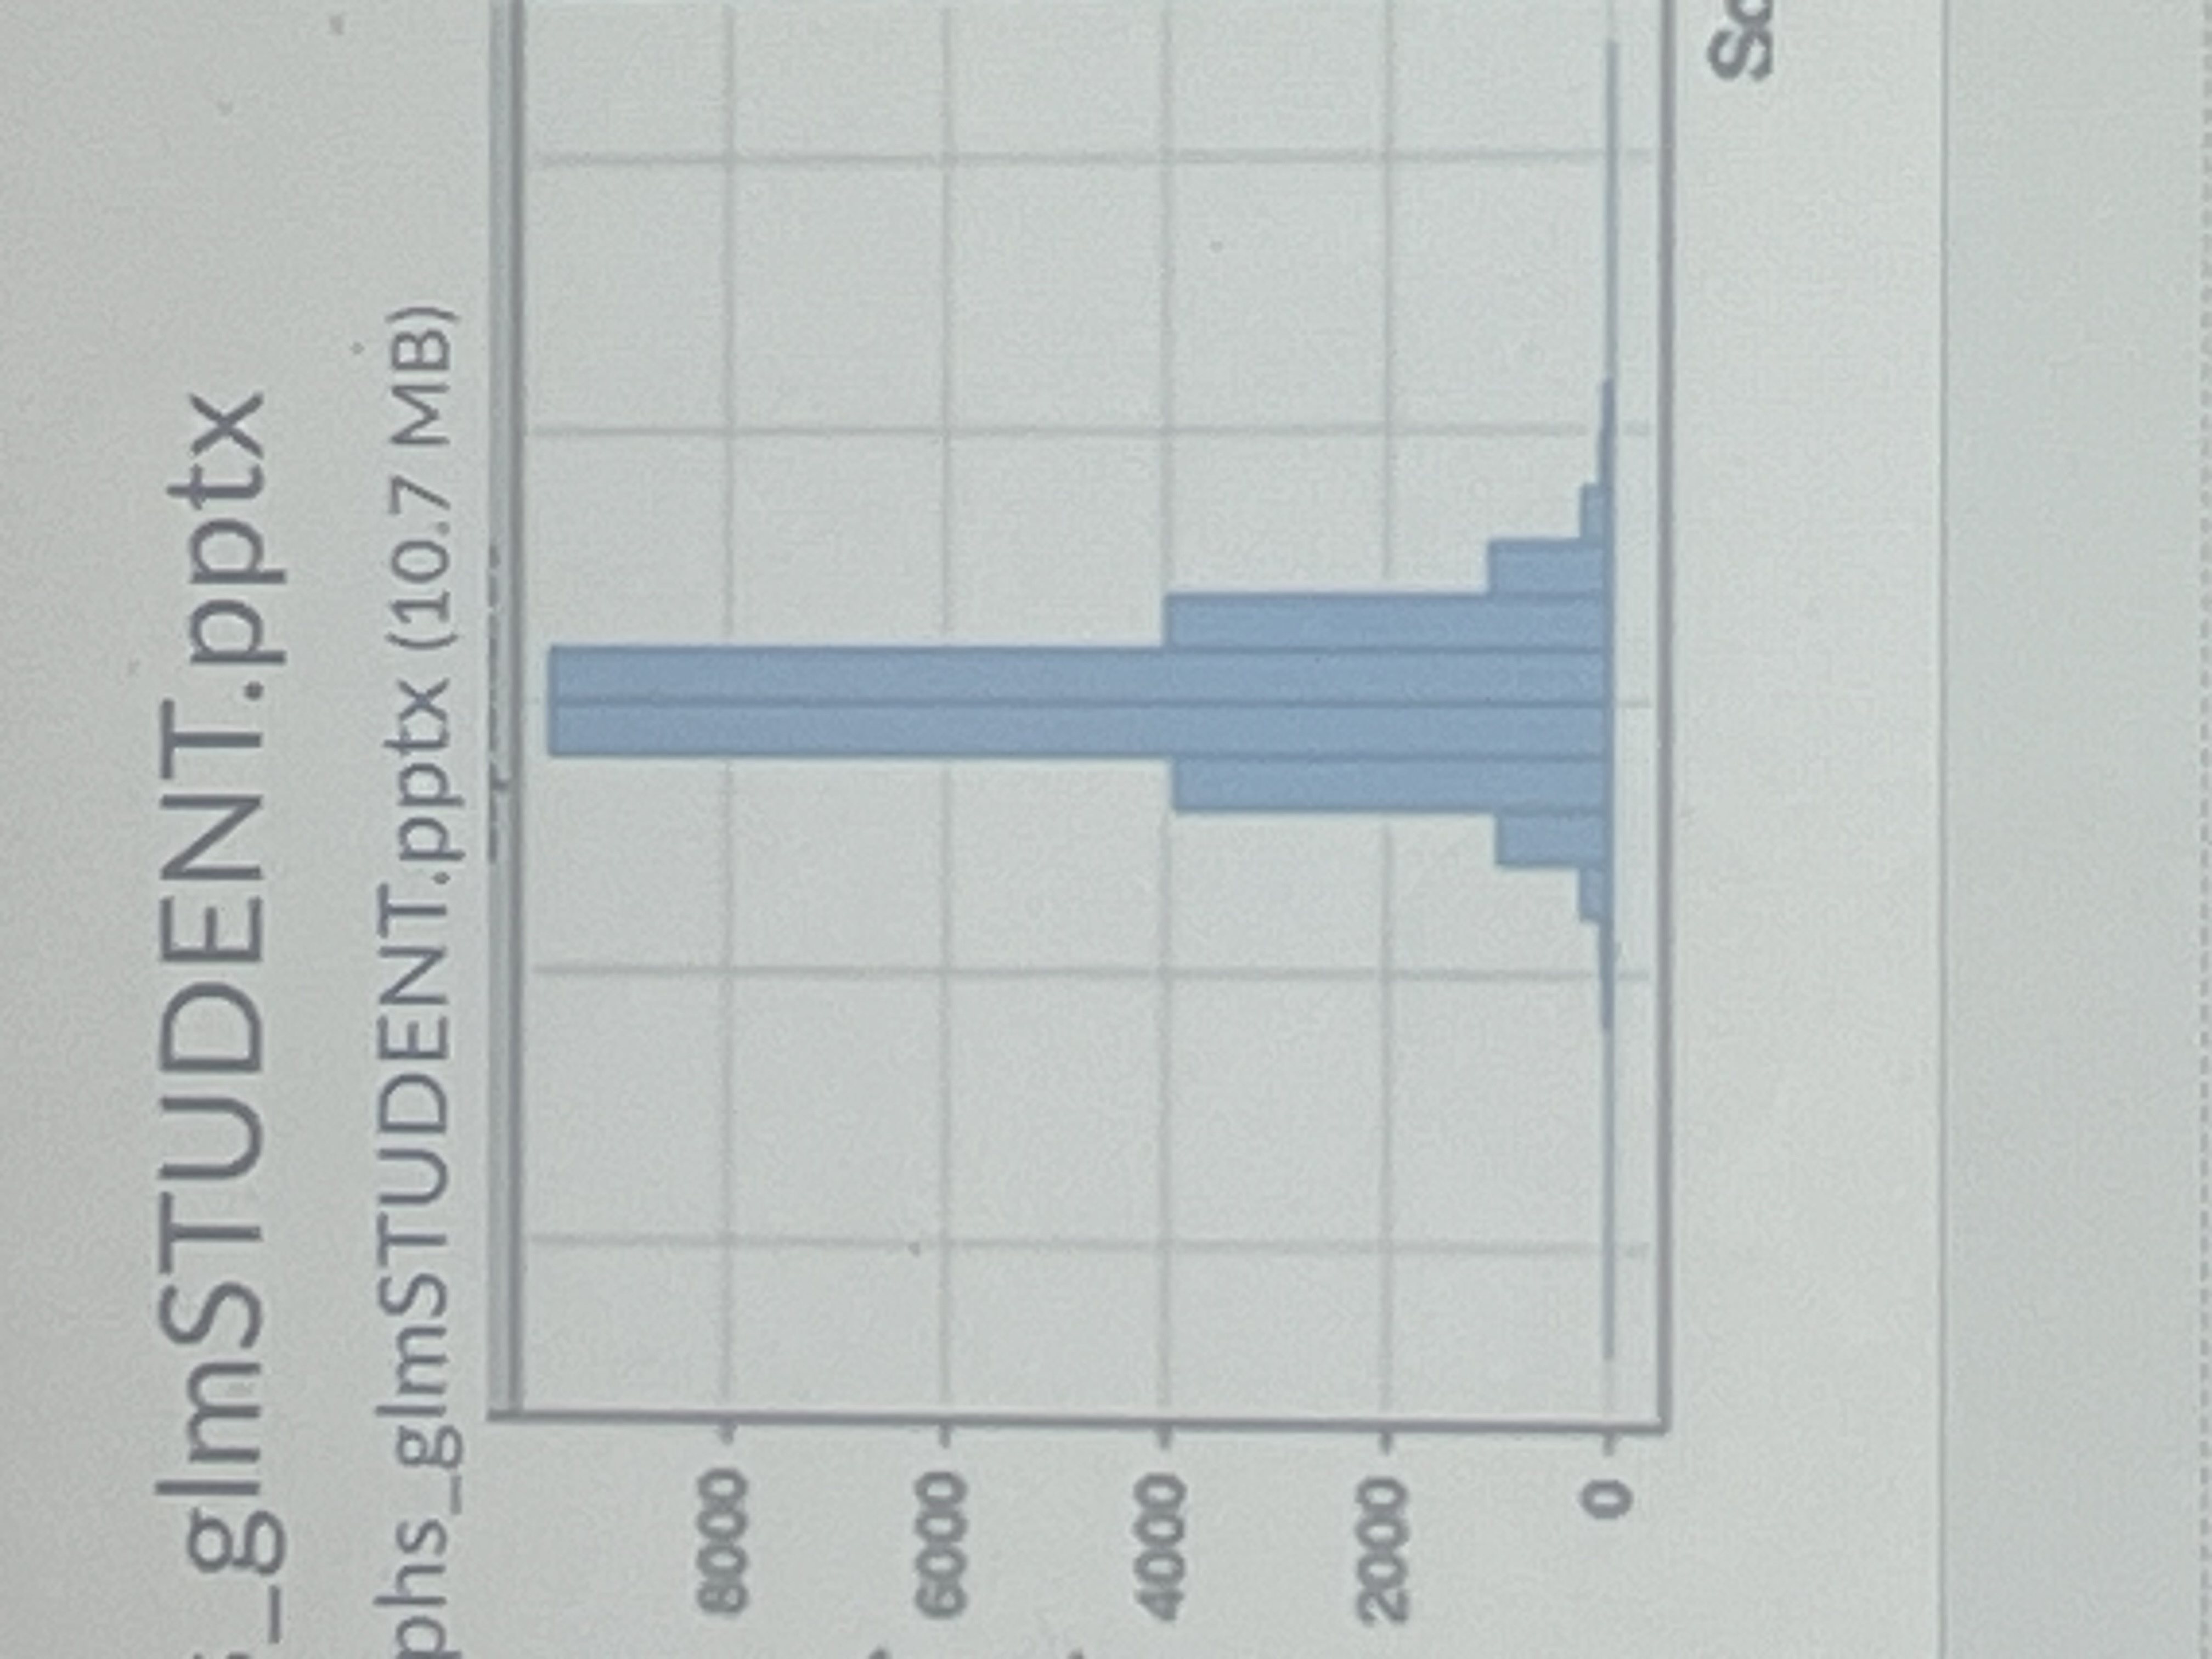
Sampling variation
Statistics varying across different samples

Xi - mean
deviation equation
adding Deviations in a model
Will always equal 0 because some are positive and some are negative
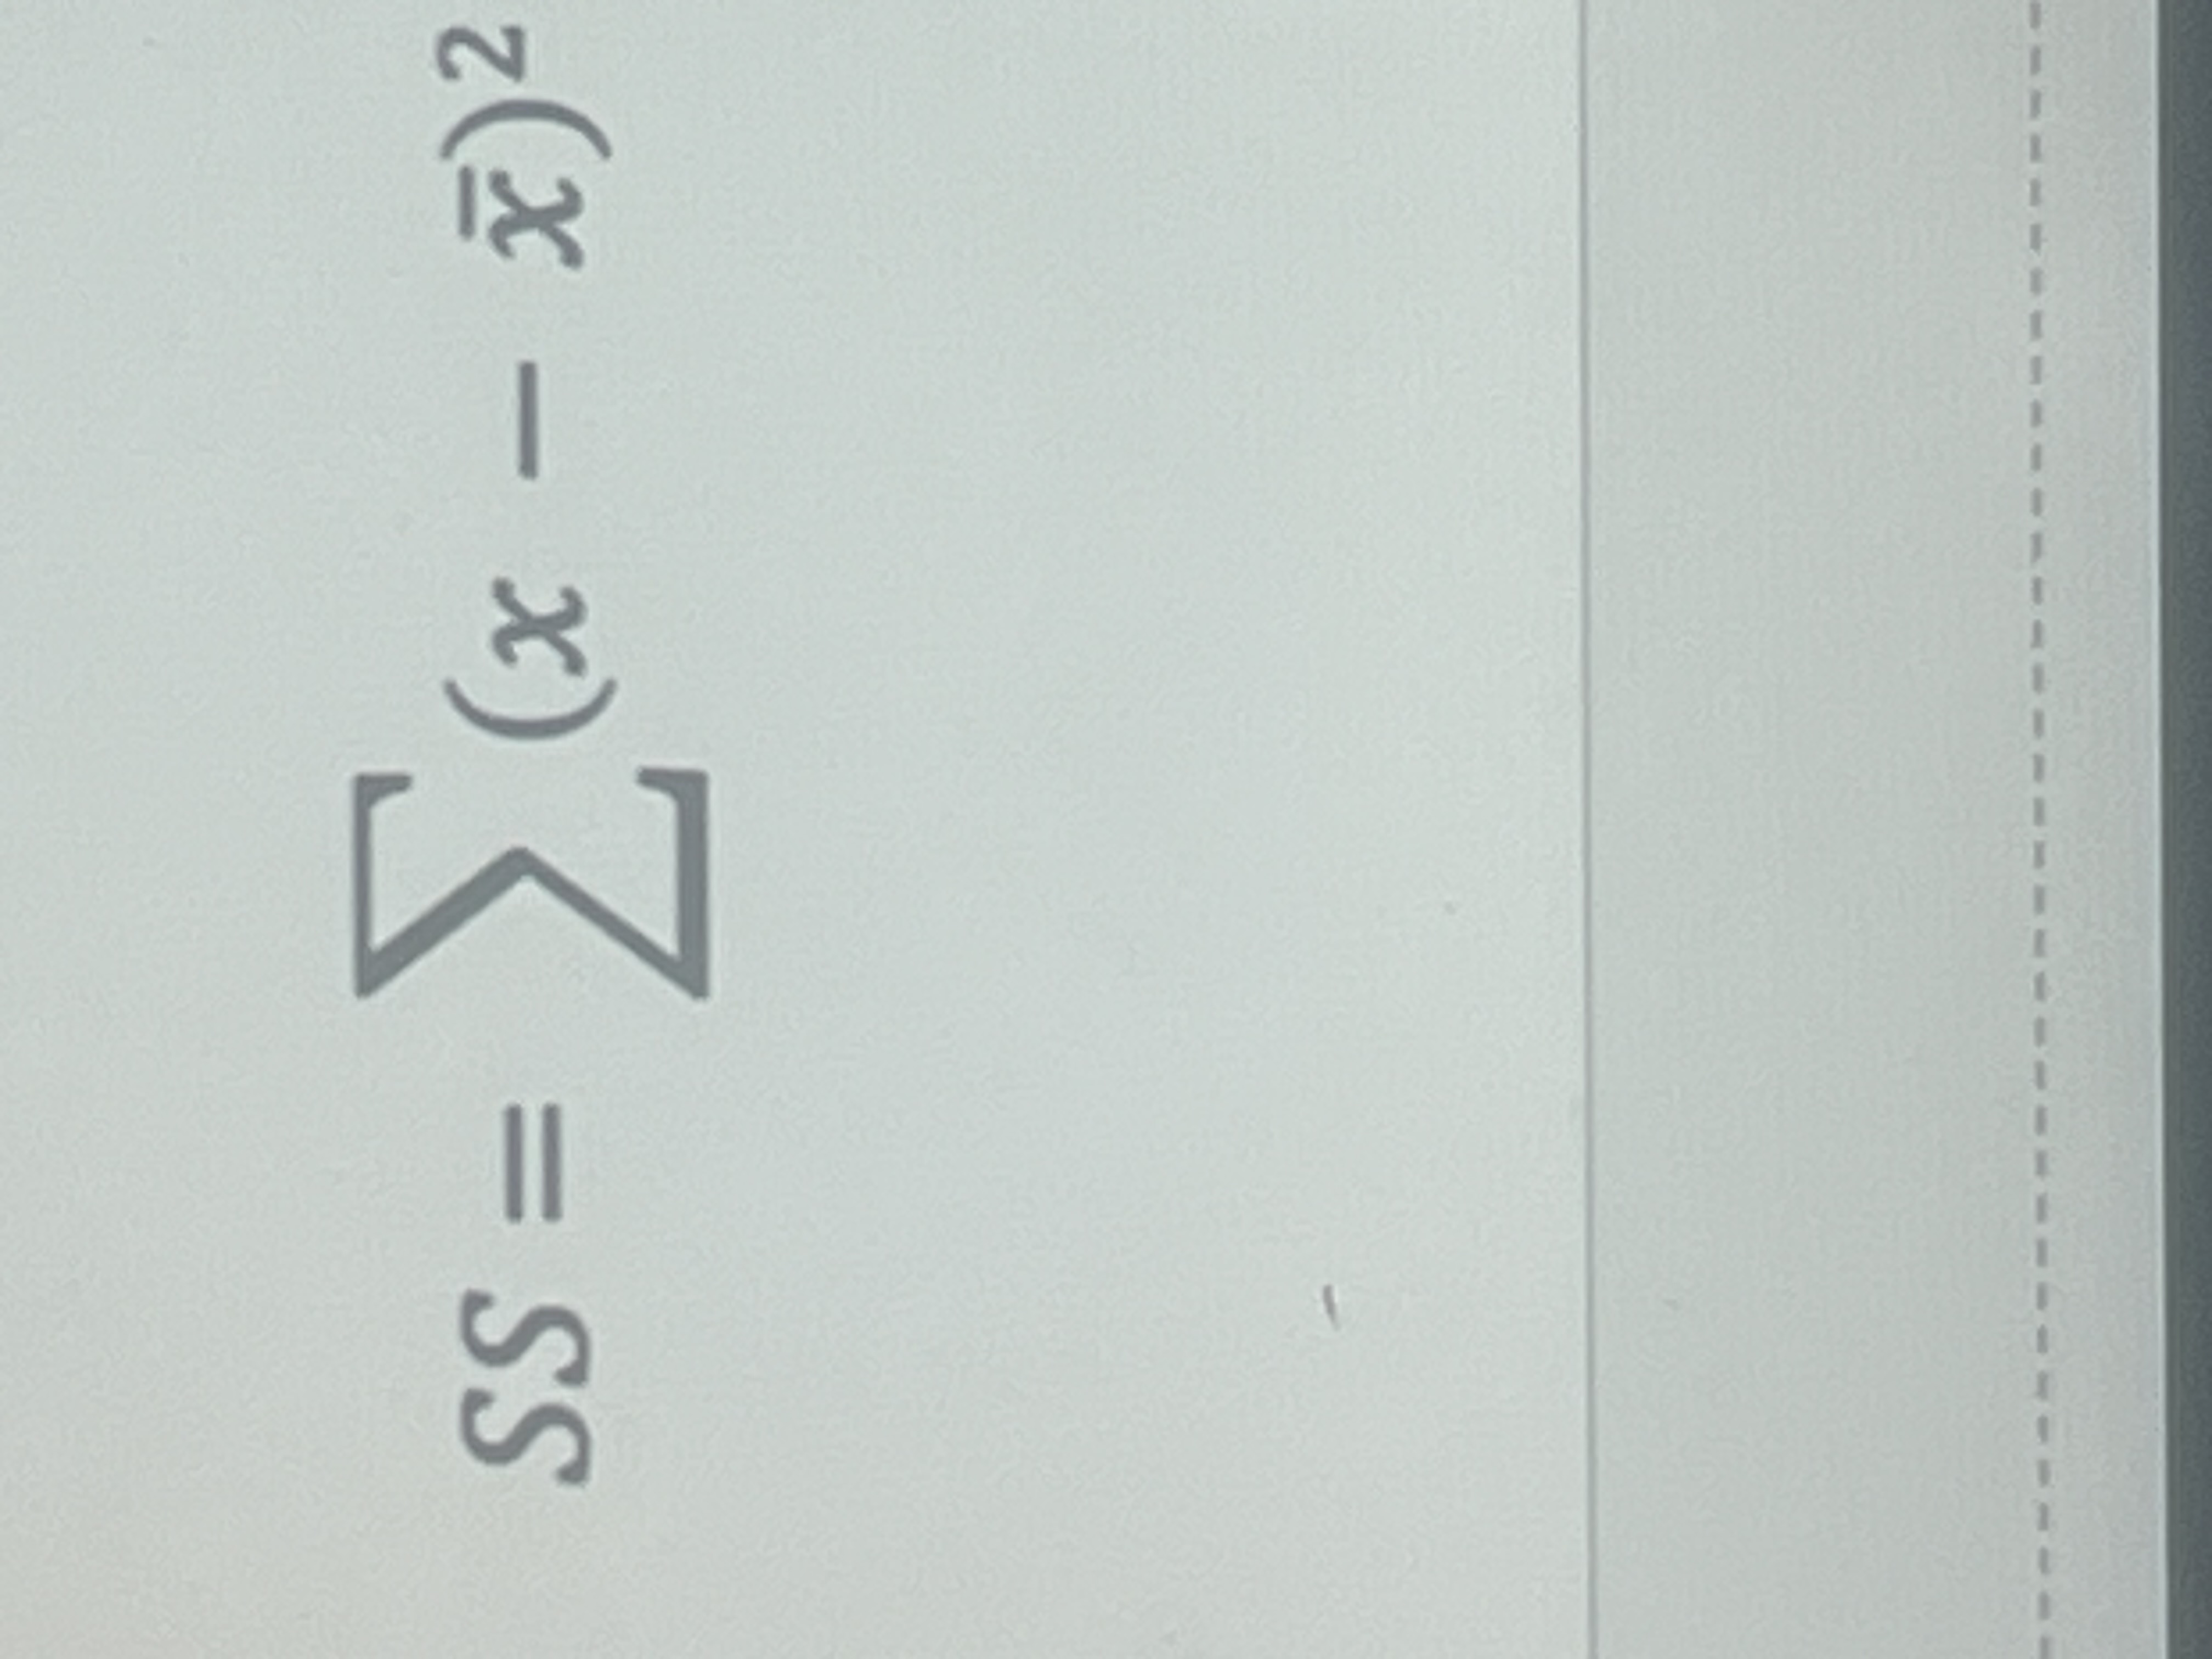
SS equation (sum of squared errors)
Sum of squared deviations
Variance equation
SS (sum of squared deviations) divided by n-1

Sample standard deviation equation (S)
= square root of SS divided by n-1
Is S and SD the same thing
Yes
What does it mean if data is clustered close together
Standard deviation is smaller
What does it mean if data is clustered far apart
Standard deviation is larger
What does Z score do
Interprets score in the context of their distribution (mean and standard deviation)
Distribution of Z score
Mean of 0 and standard deviation of 1
Z score equation
Score-mean divided by standard deviation
What does it mean if Z score is postive
It’s above the mean
What does smaller z score mean
It’s closer to the average
What does z score tell us
The location of a score within a distribution
What percent of scores fall between 1.96
5%, 2.5% on each side (positive and negative)
Standard error
Tells us the similarity of estimates from different samples
If standard error (SE) is small what does that mean
Samples produce similar estimates (tightly pooled together) good
Large SE
produce very different estimates (bad) (need a larger estimate to capture that 95%)
Confidence intervals
Gives an estimated range of values which likely includes the mean
Confidence interval equation
Mean (+/-) (1.96*standard error)
What does correlation do
Examines association between 2 variables (ranges form -1 to 1)
What does covariance do
Quantify a relationship between correlation variables
What does it mean if convince deviate from the mean by the same amount
They’re likely to be related
What does R2 (r squared) mean
Represents correlation. Squaring the value of r gives you the proportion of variance in one variable shared by another
Issues of correlation
Third variable problem and direction of causality
Third variable problem
Causality can’t be assumed
Direction of causality
Correlation coefficients say nothing about which variable causes the other to change
R= .1
Small effect (the effect explains 1% of total variance)
R= .3
Medium effect (the effect accounts for 9% of total variance
R= .5
Large effect ( the effect accounts for 25% of the variance)
What is a regression
A way of predicting the value of a variable from another
Why do we use regression
To predict values of a dependent variable from one or multiple predictors
Any straight line can be defined by
The slope b1 and the y intercept b0
Slope (b1) tells us
The direction of the relationship and the strength (if it’s really steep, there’s a stronger relationship between the predictor and outcome)
The intercept b0 tells us
Where the line starts
b0 =
Y intercept
Yi=
Score of y for an individual score
Xi=
Score of x for individual score
B1=
Slope (effect)
Ei=
Error
Why do we have an error
Bc not every person will fit perfectly on the line
Flat line means
No relationship
x variable for regression is
The predictor
Y variable of regression is
The outcome
Sst (total variability) is
Distance between the data and the mean of Y
SSR (residual error variability) is
Difference between regression model and the actual data (if the number is big then regression line isn’t good)
If SSm is large that means
Linear model has made a big improvement to how well the outcome variable can be predicted
If SSm is small it means
using the linear model is little better than using the mean
Ssm (SSmodel) looks at what
Model variability (difference in variability between the model and the mean) relationship between regression and the mean
mean squared errors (MS) equation
Ss divided by df
MSM means
Mean squared model
MSR means
Mean squared residual
For the null what do we assume
The hypothesis is true (there’s not effect)
R squared
Tell us the preparation of variance of accounted for by a regression model (eg. If r squared is 0.483 that means this model (garlic worn) can account for 48.3% of the variation shared in the zombie approach times