Age Structure Diagrams
1/10
There's no tags or description
Looks like no tags are added yet.
Name | Mastery | Learn | Test | Matching | Spaced | Call with Kai |
|---|
No analytics yet
Send a link to your students to track their progress
11 Terms
Age Structure Diagrams
shape tells us the population growth rate
the more young people in the population —> the faster the population will grow
Age Cohorts and Growth
groups of similarly aged individuals
0-14 = preproductive
15-44 = reproductive age
45+ = post reproductive
Size Difference Between 0-14 and 15-44 Indicates Growth Rate
larger 0-14 cohort = current & future growth
roughly equal 0-14 and 15-44 = slight growth/stable
larger 15-44 = population decline
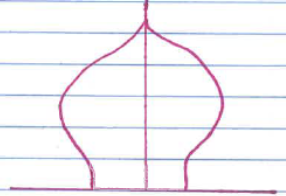
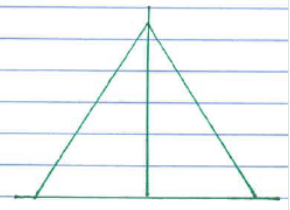
Extreme Pyramid Shape
rapid growth
Less Extreme Pyramid
slow, stable growth
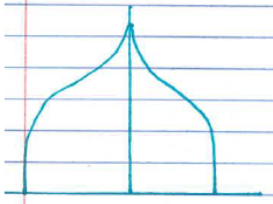
House
stable, little to no growth
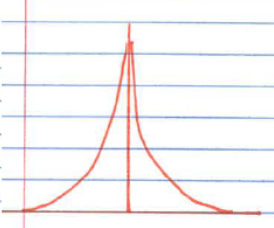
Narrowest at Base
declining population
1. Preindustrial
high birth rate, high death rate throughout life
population grows slow, high infant mortality rate
2. Transitioning
high birth rate, declining death rate
access to better health care, population grows fast
3. Industrial
lower birth rate, high survivorship high death rate in late life
reduction of population growth rate
4. Post Industrial
low birth rate, high survivorship, low death rate
birth and death rates are stable