L5 - Predictive Analytics in Jamovi
1/28
There's no tags or description
Looks like no tags are added yet.
Name | Mastery | Learn | Test | Matching | Spaced |
|---|
No study sessions yet.
29 Terms
Correlation Analysis
focuses on the relationship between variables.
Linear Regression Analysis
is used to predict the effect of the predictors on an outcome variable.
Logistic Regression
predict the likelihood of something occurring on the basis of possible characteristics across a range of predictor variables.
Correlation Analysis
identifies a linear relationship between two variables (both numerical).
Correlation Analysis
measures the extent to which two variables are related.
Correlation Analysis
correlation coefficient (r): the measure of the linear relationship between two variables
Correlation Analysis
have a bidirectional relationship, meaning no direct independent variable. But this does not imply causation.
Correlation Analysis
Steps:
•Compute the effect: correlation coefficient (r)
•Determine the statistical significance (p value) of the effect
coefficient of determination (r2)
squaring the value of r we get the proportion of variance in one variable shared by the other
Correlation
__________ does not imply Causality
The third-variable problem
in any correlation, causality between two variables cannot be assumed because there may be other measured or unmeasured variables affecting the results.
Direction of causality
Correlation coefficients say nothing about which variable causes the other to change
Linear Regression Analysis
Predicts the value of outcome (numerical DV) on the basis of values on several predictors (numerical or categorical IVs)
Linear Regression Analysis
Steps:
•Assess the goodness of fit of the overall model (R² , F)
•Compute effects of each predictor variable (b1, b2 ....)
•Determine the statistical significance (p value) of each effect
Intercept
The _________ is the value of the Y (Dependent Variable) if all predictors (Independent Variable) is set to 0. The default or else statement.
Coefficients / Estimate
The __________ represent the "Amount of increase in Y for every one unit increase in X"
Linear Regression Analysis
Interpretation:
For every 1 point increase in career growth score, there is a 0.46 (estimate/coefficient) increase in job satisfaction score.
For every 1 point increase in well being scores, there is a 0.30 (estimate/coefficient) increase in job satisfaction score
Linear Regression Equation
Y = intercept + (b x predictor 1) + (b x predictor 2)....
Logistic Regression Analysis
Outcome variable (categorical) is binary (2 categories), predictor variables are either categorical or continuous.
Logistic Regression Analysis
Steps:
•Assess the goodness of fit of the overall model (X² , R²n)
•Compute effects of each predictor variable (b1, b2 ....)
•Determine the statistical significance (p value) of each effect
Model Chi Square
To test how well the model fits the data (observed data vs. expected data if you used only the model logistic)
Model Chi Square P-Value (sig.)
Tells you whether your model significantly predicts your outcome variable (p value has to be <.05 for the model to be significant)
The Nagelkerke R-square
Gives and estimate of the % variation that we account for in outcome variable.
P value (sig)
Tells us which predictor variable potentially significantly impact the outcome variable
Odds ratios (Exp(B))
Indicates the changes in probability (or odds) of the occurence in the outcome variable for a change in one unit of the predictor variable.
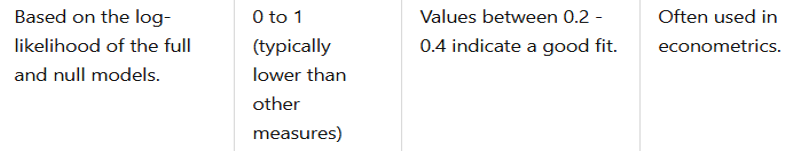
McFadden’s R²
Description | Range | Key Characteristics | Common Use
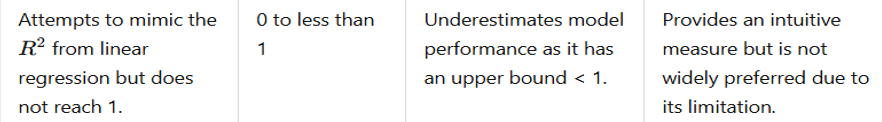
Cox & Snell’s R²
Description | Range | Key Characteristics | Common Use
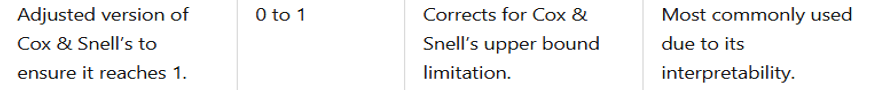
Nagelkerke’s R²
Description | Range | Key Characteristics | Common Use
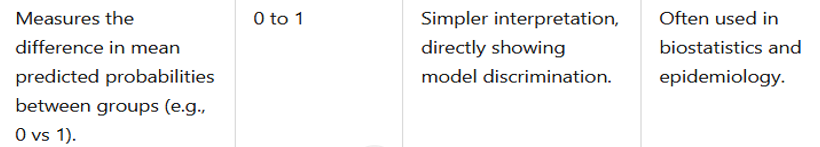
Tjur’s R²
Description | Range | Key Characteristics | Common Use