4.4 Market research
1/27
There's no tags or description
Looks like no tags are added yet.
Name | Mastery | Learn | Test | Matching | Spaced | Call with Kai |
|---|
No analytics yet
Send a link to your students to track their progress
28 Terms
Why do organizations carry out market research?
To see what individuals like or dislike; test new products
Check if current marketing is working
Find new market opportunities
What are the 7 Ps of the marketing mix?
Product-based research: Tests a new product in a small area to see if customers like it before a full launch.
Price-based research: Checks competitors' prices to help set the right price
Promotion-based research: Finds out which media (TV, social media, etc) the target market uses so ads reach the right people
Place-based research: Helps choose the best places or methods to sell the product.
People-based research: focuses on training staff to give good customer service and make buyers return.
Process-based research: Looks at how well the service is delivered compared to competitors.
Physical evidence-based research: Studies the look and feel of the store or brand to improve customer experience.
What are the two areas that all market research can be broken down into?
Primary market research
Secondary market research
Describe the image of market research
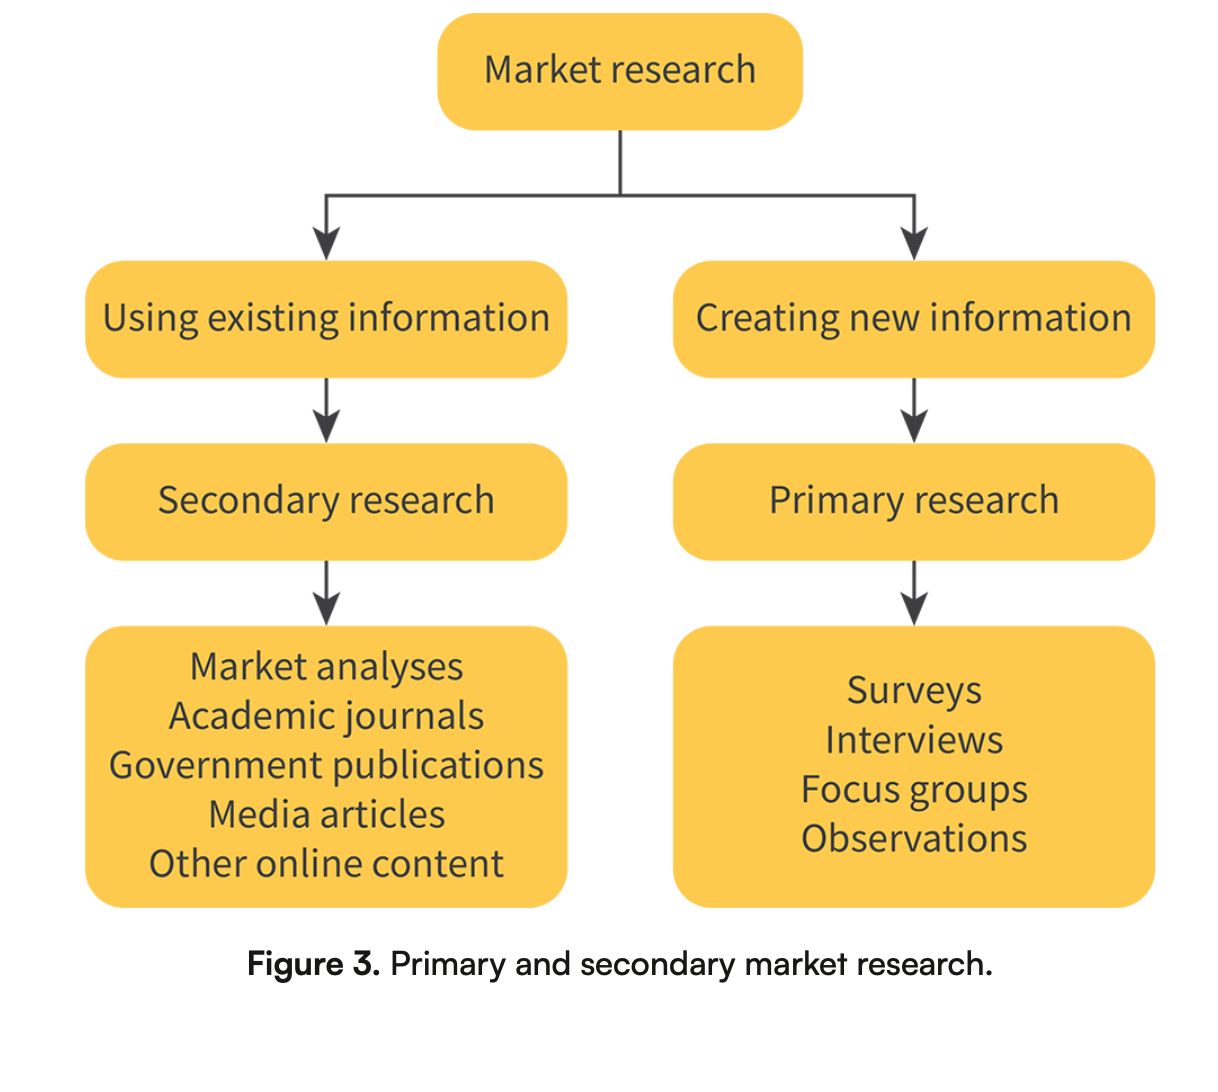
What is the difference between primary market research and secondary market research? Include some examples
Primary market research is when a business collects new data directly from people. It’s first-hand information. Ex: surveys, interviews, and product testing.
Secondary market research is when a business uses existing data that was collected by others. Ex: reportts, news articles and government statistics.
What are some disadvantages of primary market research?
Its very expensive to conduct market research
It takes time and resources to plan and conduct the research, and then process the results.
So, most businesses are not experts in carrying out market research.
Explain the primary market research methods
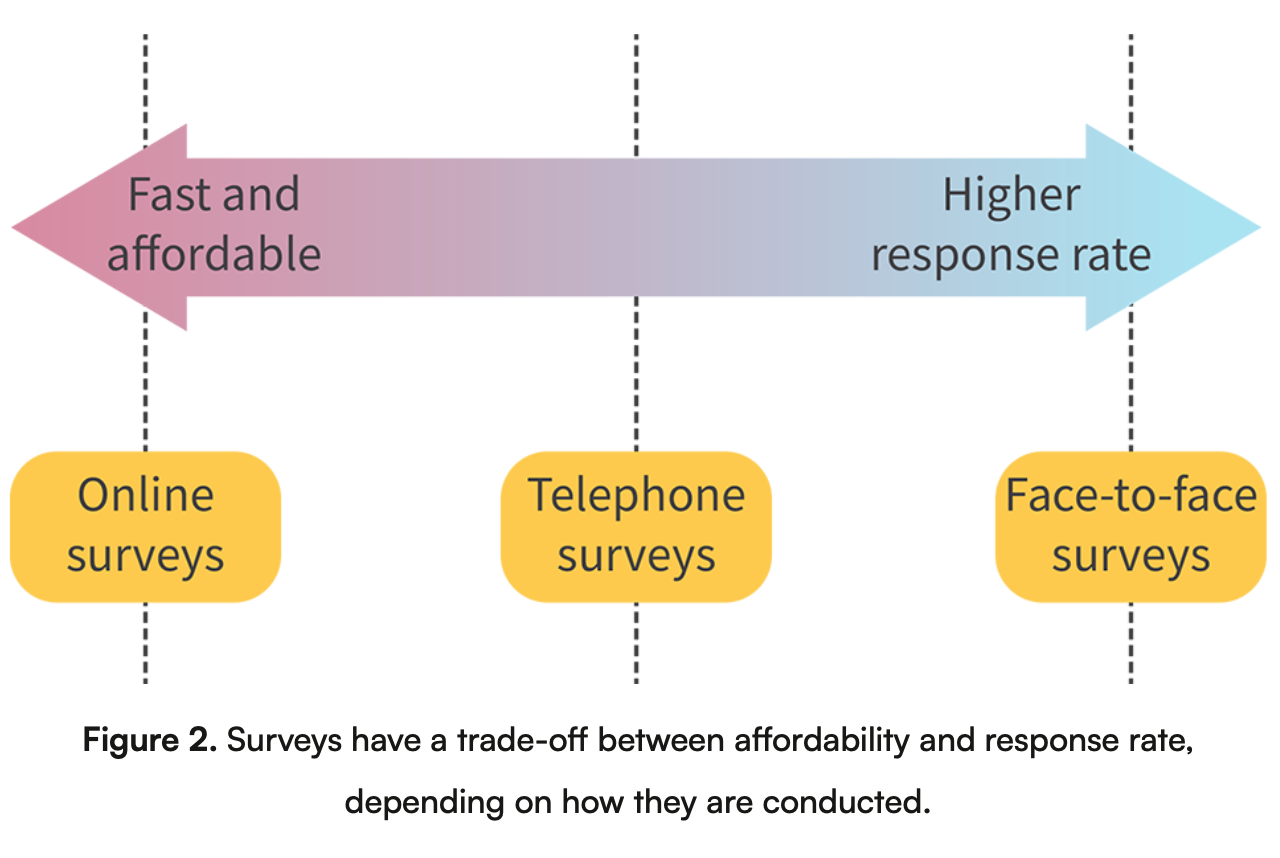
Surveys - Asking individuals questions using online surveys, surveys by phone, or face-to-face surveys to learn their opinions or habits.
Interviews - One-on-one conversations to get deeper answers and personal views.
Focus groups - A small group of people discuss a product or idea to share feedback.
Observations - Watching how people act in real situations without asking them anything.
Describe the survey image
Explain the methods of secondary market research.
Market analyses: Paid reports with information on trends, competitors, and markets (ex: Euromonitor)
Academic journals: Research articles from universities about business theories (ex., Jstor).
Government publications: Free, reliable data on the economy, population, etc.
Media articles: News from trusted sources about companies and markets such as Forbes.
Online content- Information from websites, social media, and e-commerce for trends and competitors.
What should we keep in mind when interpreting business data?
Currency
Relevance
Authority
Accuracy
Purpose
What are the uses and limitations of primary and secondary research?
Primary research
Uses:
Gives direct information about customer preferences
Offers unique data for an advantage
Limitations:
Expensive and slow
Staff may need training
Secondary research
Uses:
Cheaper than primary research
Easy to access
Limitations:
Information needed might not exist
Data may not fit the business’s needs
What is the difference between qualitative and quantitative research? include examples
Qualitative research explores opinions and experiences through non-numerical data.
Ex: interviews and focus groups
Quantitative research gathers numerical data to measure trends.
Ex: Surveys and sales data
What is the main difference between quantitative and qualitative research?
Quantitative research gathers data for more people with less detail, while qualitative research focuses on fewer people but with more details.
Why do researchers use both types of research?
Researchers use both depending on time, money, and what they need to find out, choosing between more detail (qualitative) or more data (quantitative).
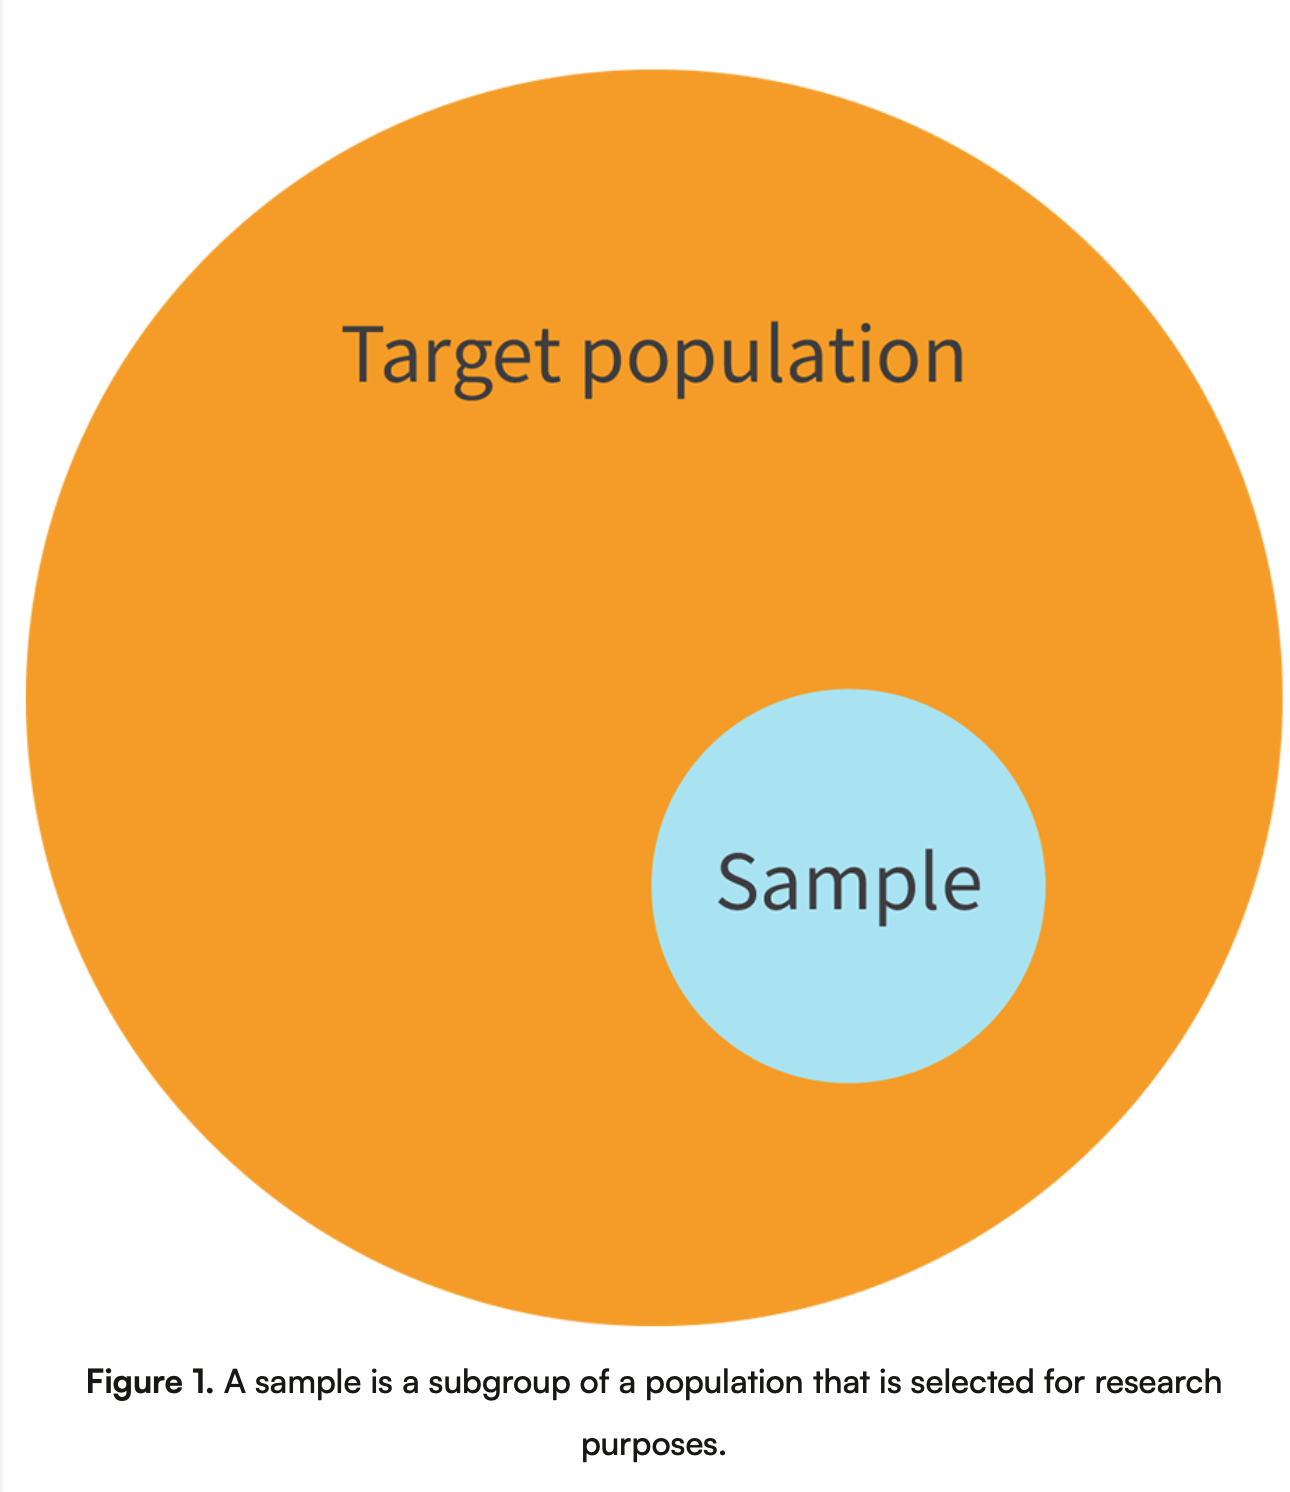
Describe the image of the target population and sample
What are the various sampling methods that researchers can use?
Random sampling
Quota sampling
Convenience sampling
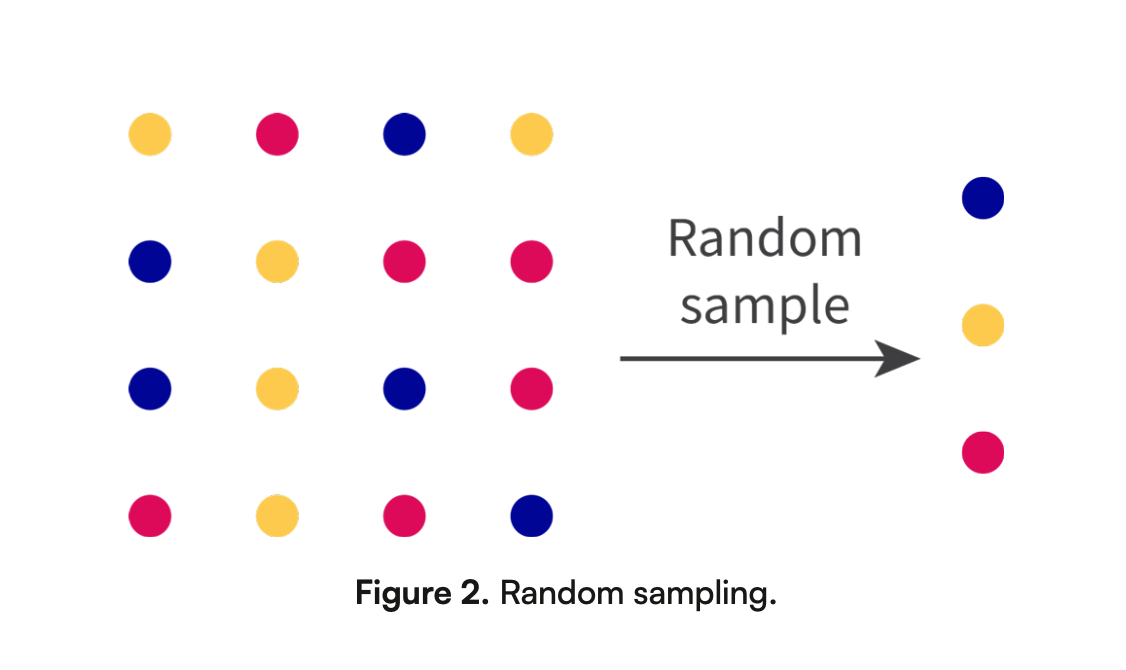
What is random sampling? describe the image and give an example.
Random sampling is when people are selected randomly, so everyone has an equal chance to participate.
Ex: randomly picking customers from a store’s database to survey about their shopping habits.
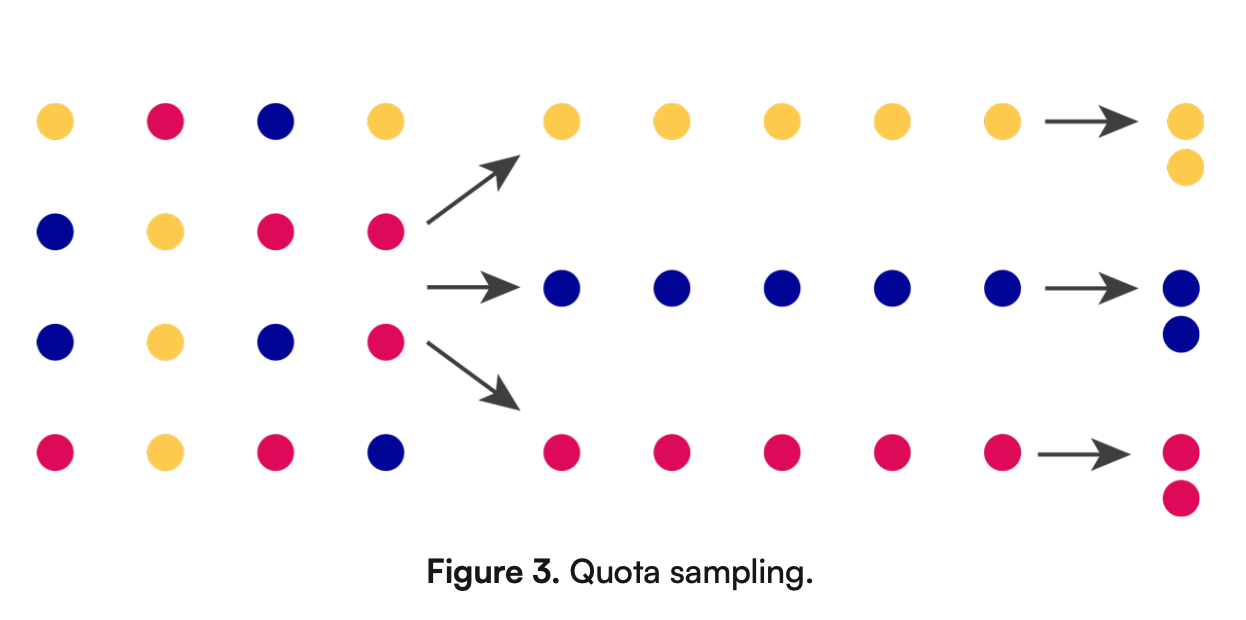
What is quota sampling? describe the image and give an example
Quota sampling is when researchers select a certain number of people from different groups to match the overall population.
Ex: Surveying 50 men and 50 women from different age groups to understand their preferences for a product
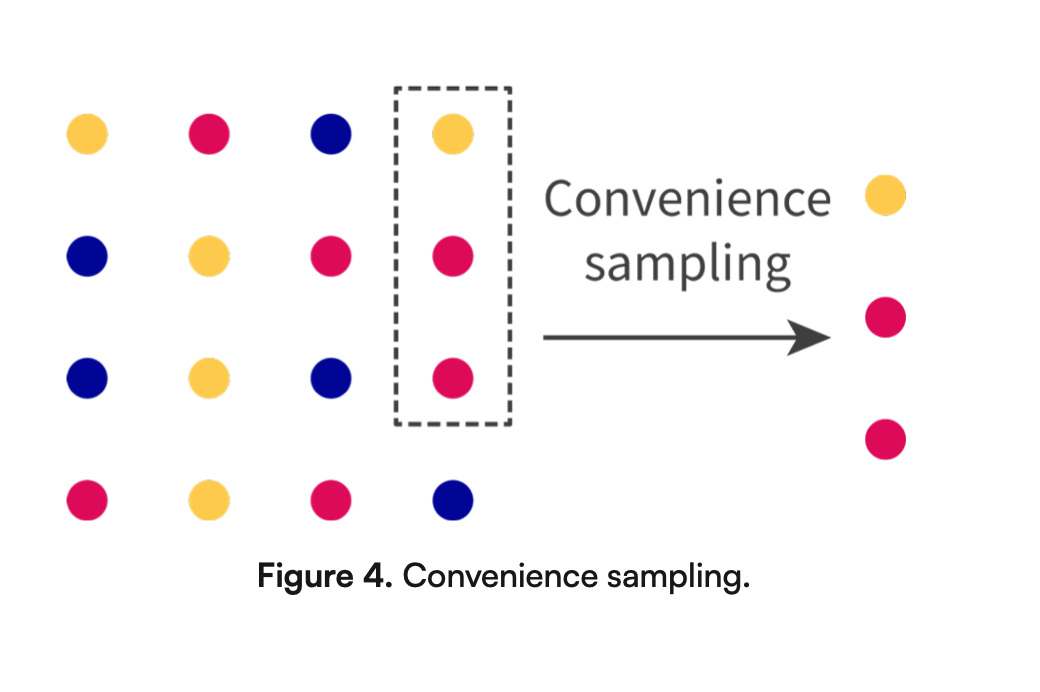
What is convenience sampling? Describe the image and give an example
Convenience sampling is a method where people are chosen because they are easy to reach, such as using friends or people nearby.
Ex: Asking customers who are shopping at a mall to fill out a feedback form about a new product.
Bias in sampling
Bias in sampling can lead to unreliable results, and researchers must balance cost and accuracy when choosing a method.
What are the descriptive statistics needed to know?
Mean
Mode
Median
Standard deviation
Pie charts
Bar charts
Infographic
Quartiles
What are the mean, mode and median?
Mean: Average, add all numbers together and divide by how many of numbers there are
Mode: The number that appears most often
Median: The middle number when numbers are ordered. If there’s an even number, find the average of the 2 middle numbers.
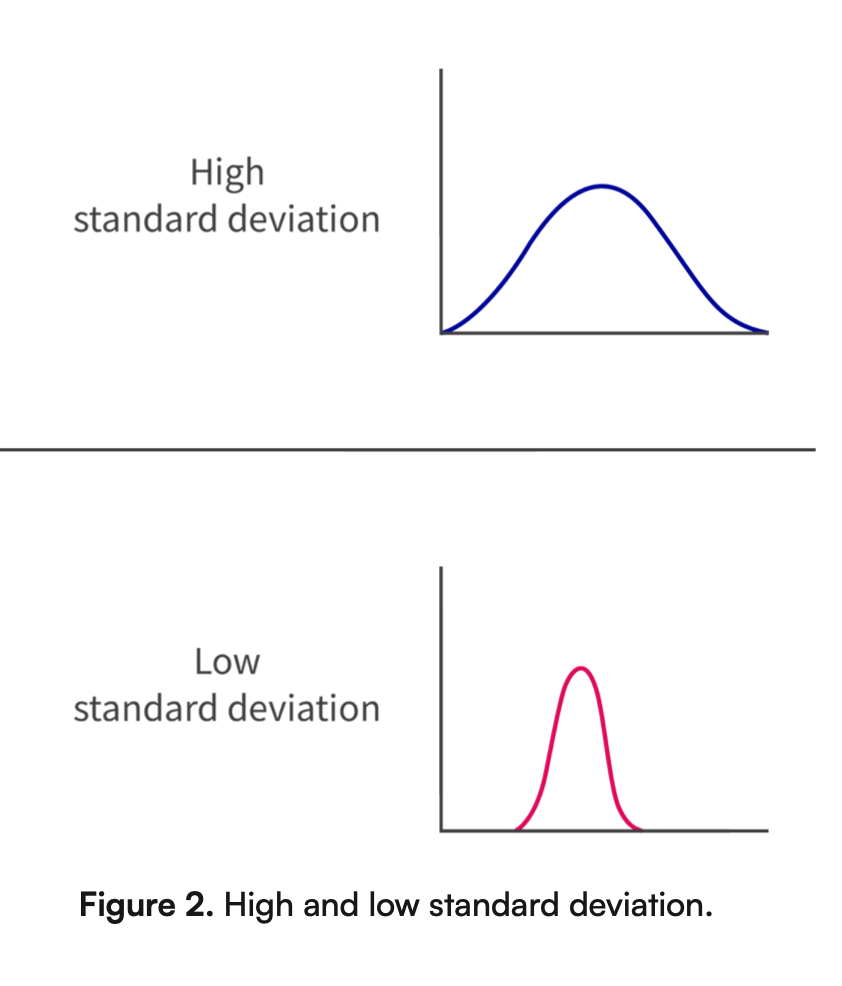
What is standard deviation and when is it commonly used in business?
Standard deviation (σ) shows how spread out he numbers in a data set are, or how much they differ from the average.
One of its key applications in business is to analyse the price changes of a share of a publicly held company and to understand the statistical likelihood of an event taking place.
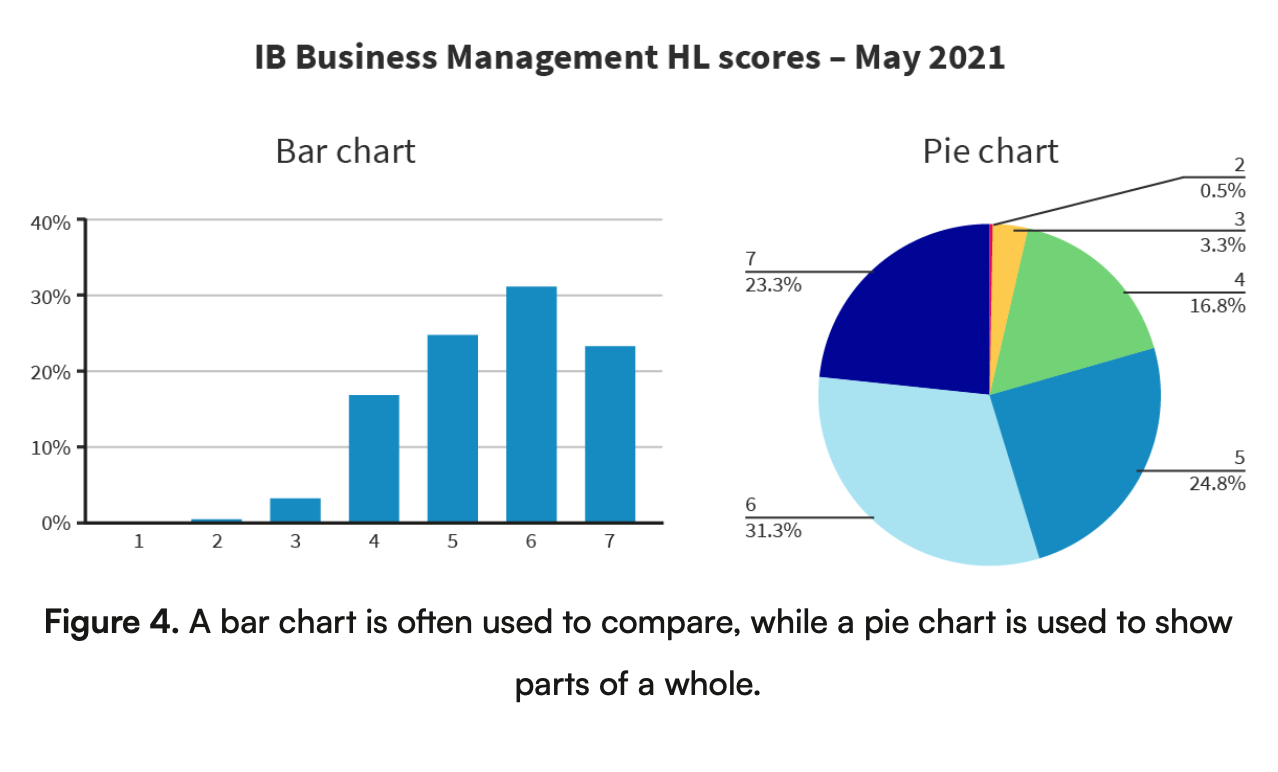
What are bar and pie charts?
A bar chart uses bars to compare values of different items or events, such as comparing product prices over time.
A pie chart uses a circle divided into segments to show percentages of a whole, such as showing sales breakdown by product, which helps businesses to analyze and compare data.
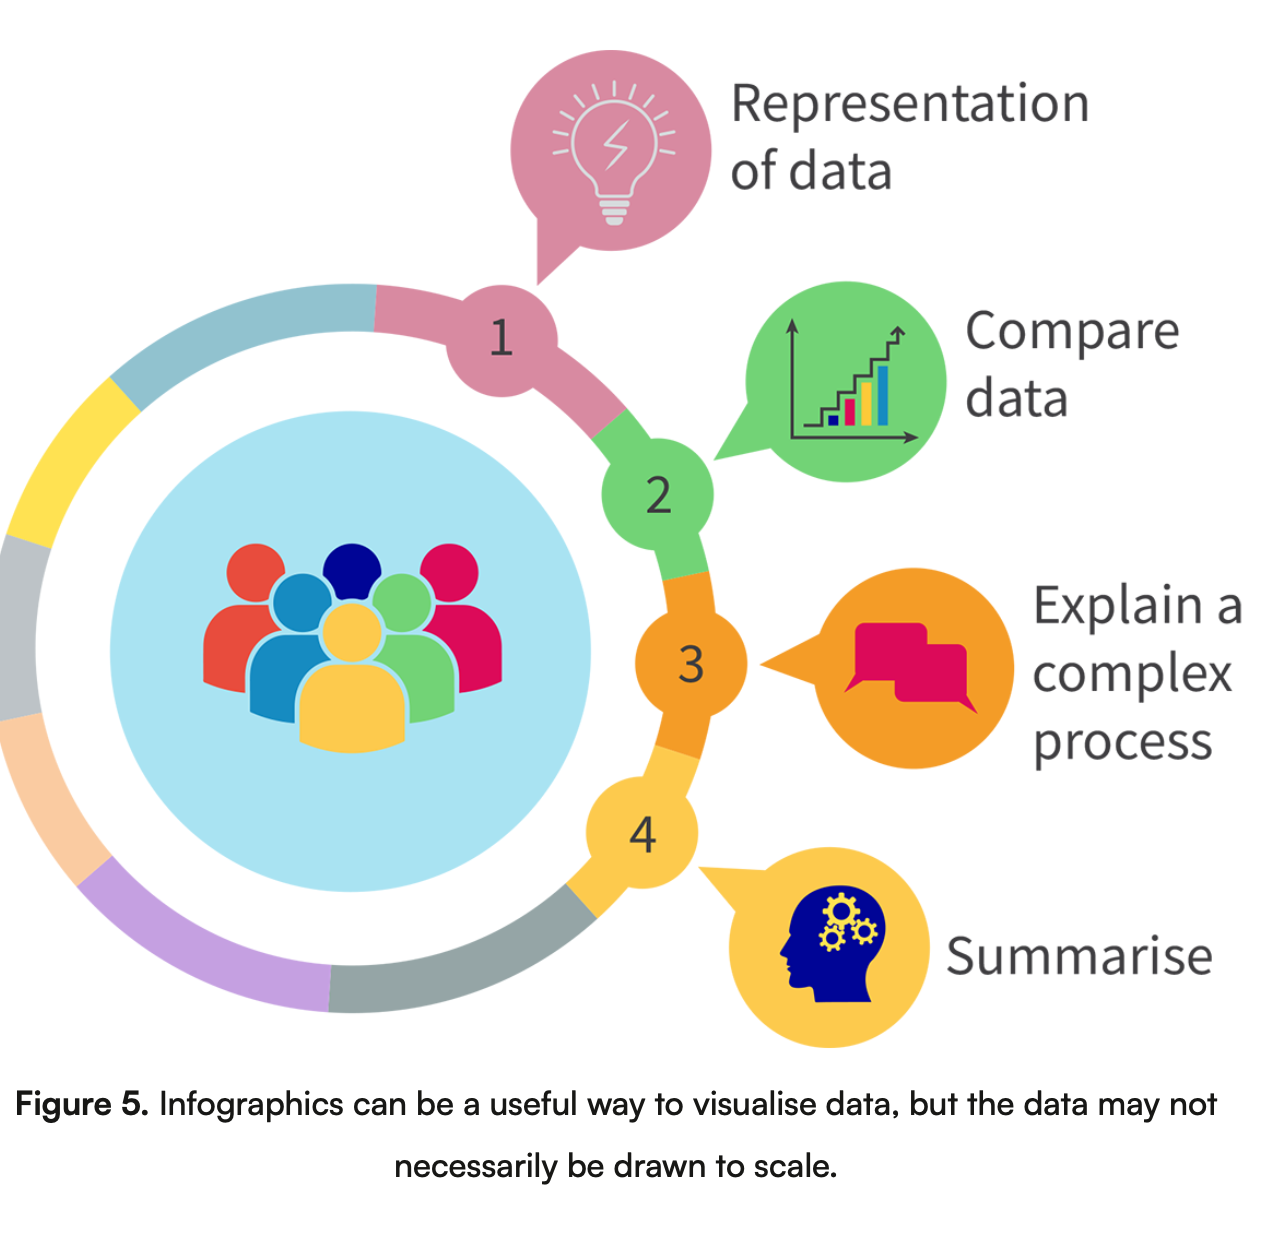
What are infographics? Describe the image.
An infographic is a graphic representation of information, showing research findings or breaking down data in a visual way.
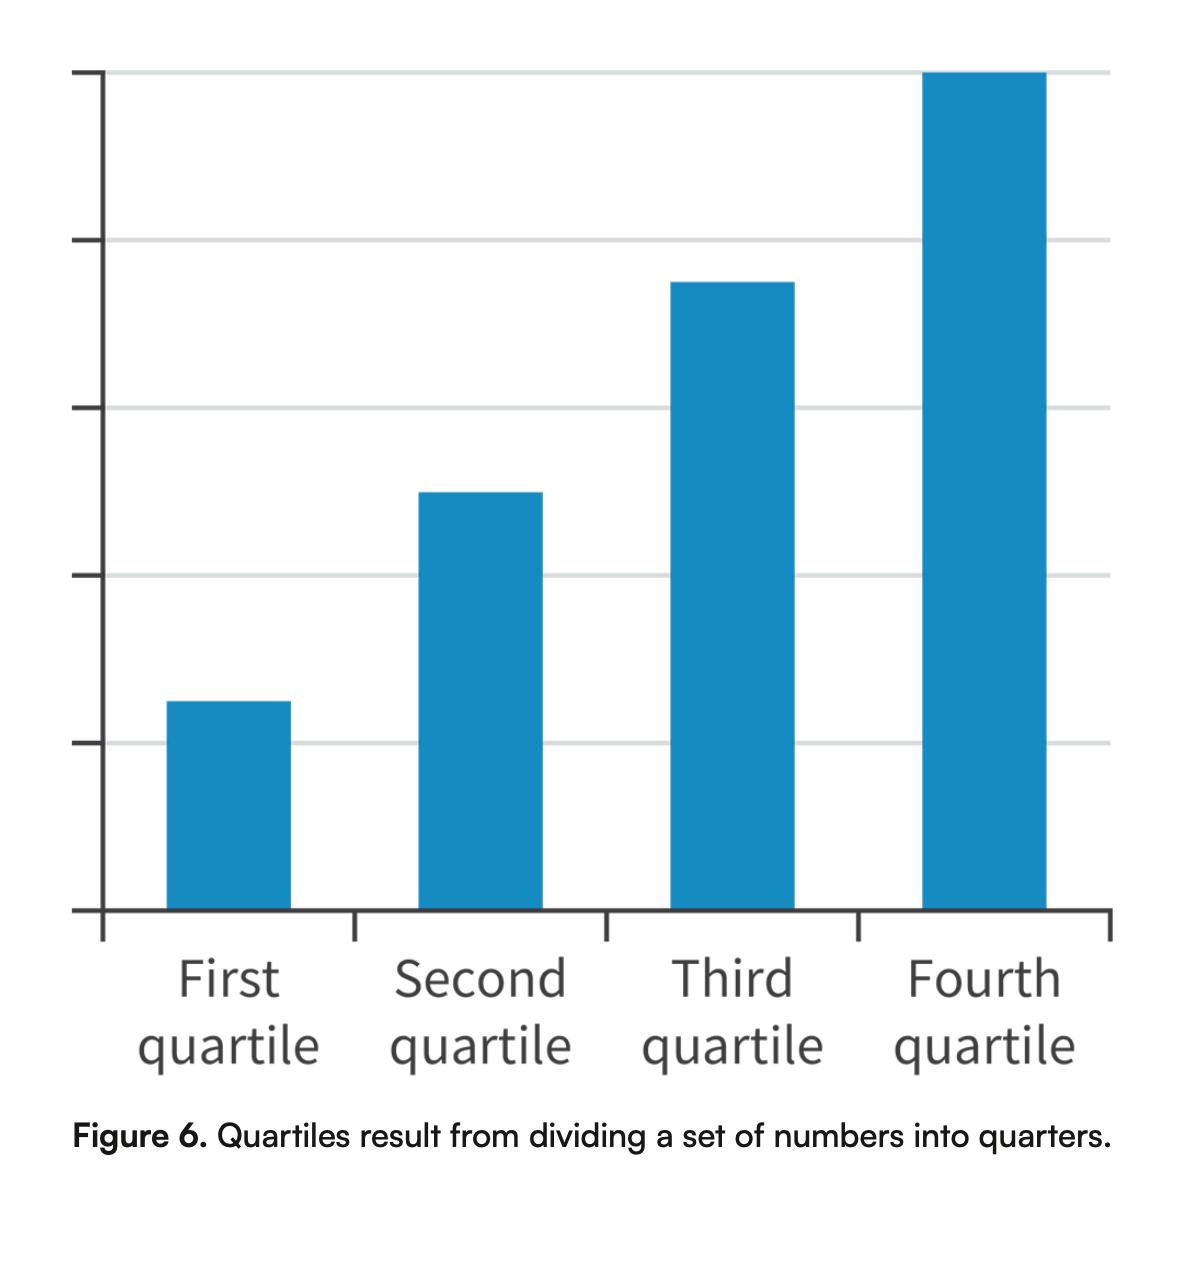
What are quartiles?
Quartiles result from dividing a set of numbers into quarters.
What are some problems with data presentation and interpretation?
Misleading titles: Titles may be unclear or purposely misleading, so always read them carefully.
Year range: Data can be selected to only show certain years, which ignores other important periods.
Correlation vs. causation: Just because 2 things happen together doesn’t mean one caused the other.
In a normal distribution, how much of the data falls within one standard deviation?
68%