(Combined) AICP Section 1 - Research and Assessment Methods
1/49
Earn XP
Name | Mastery | Learn | Test | Matching | Spaced | Call with Kai |
|---|
No analytics yet
Send a link to your students to track their progress
50 Terms
Participatory Action Research (PAR) Techniques
Engaging community members as active participants in the research process to address community issues through iterative cycles of reflection, data collection, and action. Empowers residents to contribute to problem-solving and decision-making, ensuring that research outcomes are relevant and beneficial to the community.
Related: Collaborative research, co-researchers, community-drive, inclusive approach
Survey design and implementation for community feedback
Effective survey design ensures that questions are clear, unbiased, and relevant to the community’s needs.
Implementation includes setting appropriate distribution methods, such as online surveys or in-person questionnaires, to maximize participation and obtain valuable insights for informed decision-making
Related: Survey methodology, public opinion
Focus Groups and Community Workshops
Interactive sessions that gather diverse community members to discuss and provide input on planning issues.
Forums facilitate open dialogue, allowing planners to understand different perspectives, identify community needs, and build consensus. Essential for fostering community involvement and ensuring planning decisions are reflective of the community voice.
Related: Collaborative planning, charrette, Delphi Methods
Charrette
A collaborative planning process that brings together various stakeholders, including community members, designers, and planners, to develop a shared vision for a project or area. Charrettes encourage active participation and rapid idea generation through workshops and discussions.
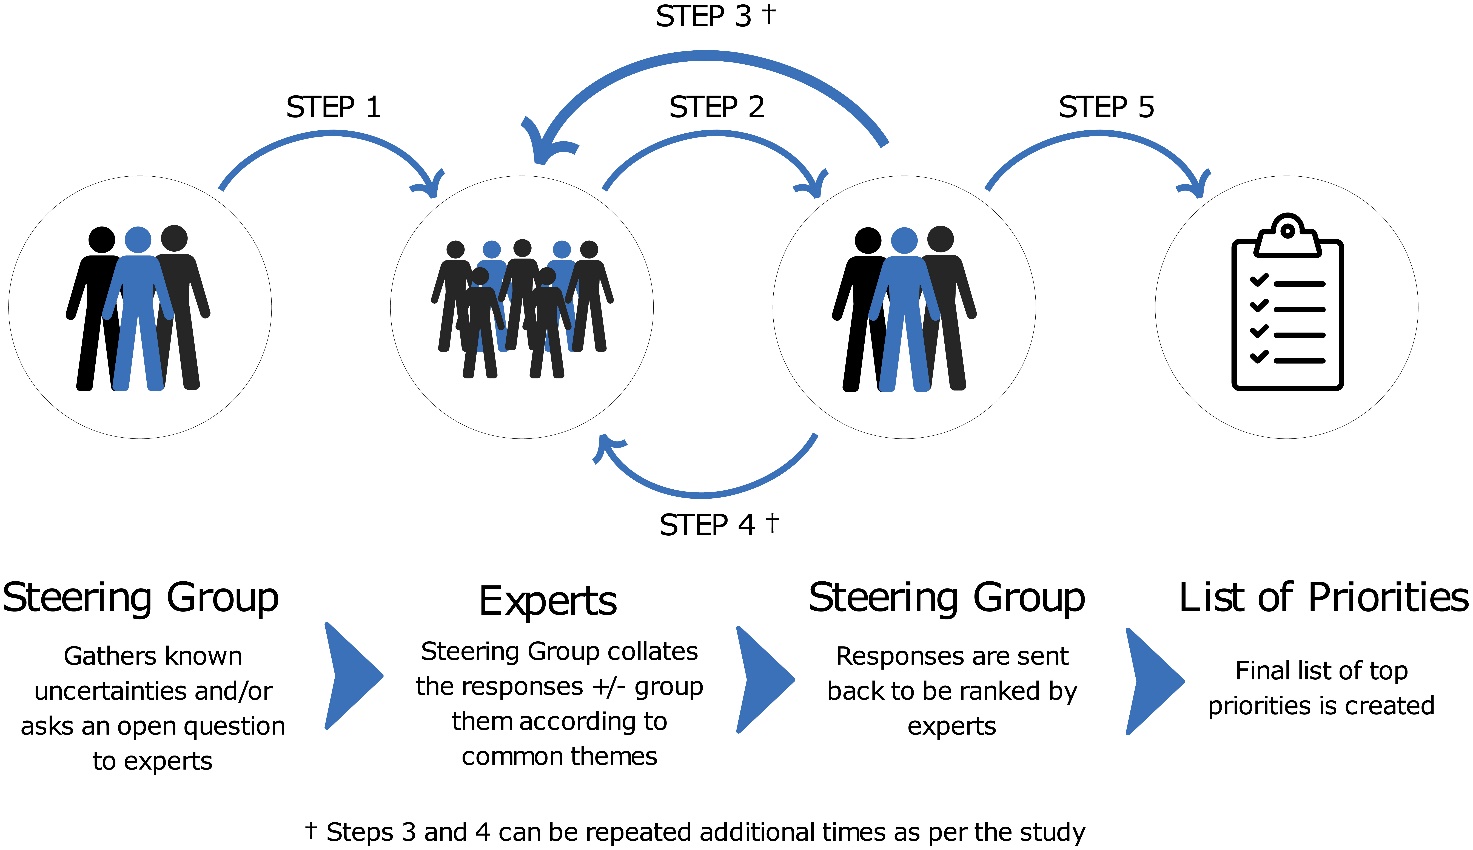
Delphi Method
A structured communication technique used to gather expert opinions through a series of questionnaires, aiming to reach a consensus on specific issues or futures. It involves multiple rounds of questioning and feedback to refine responses.
Relevance
The extent to which the data and findings directly address research questions and objectives. Relevant data ensures that the analysis is applicable to the current planning issues and can inform effective decision-making
Validity
The degree to which a study accurately reflects or assesses the specific concept it is intended to measure. High validity indicates that the research findings are credible and accurately represent the real-world scenarios they aim to analyze
Related: Internal validity, external validity
Internal Validity
The extent to which a study can demonstrate a clear cause-and-effect relationship between variables, free from confounding factors. High internal validity indicates that the changes observed in the dependent variable can be attributed directly to the manipulation of the independent variable.
External Validity
The extent to which research findings can be generalized or applied to settings, populations, or time periods beyond the study sample. High external validity indicates that results are relevant beyond the specific context of the study.
Reliability
Consistency of a measure or method over time. Reliable data yields the same results under consistent conditions, ensuring that findings are dependable and can be replicated in similar studies
Related: Stability, repeatability, precision, trustworthiness, reproducibility, uniformity, accuracy, robustness
Data Quality
Assessed based on factors such as accuracy, completeness, reliability, and relevance. High-quality data is essential for producing valid and reliable research outcomes that can effectively guide planning decisions.
Related: Timeliness, precision, validity, integrity, usability
Implicit Bias
Unconscious attitudes or stereotypes that affect understanding, actions, and decisions. Recognizing and mitigating implicit bias that may exist in data sources is crucial to ensure objective, fair, and equitable research outcomes.
Related: Objectivity, fairness, equity, discrimination, awareness, inclusivity
Passive (Data Collection)
Gathering data without direct interaction or intrusion using data sources such as traffic cameras, social media, sensors, and public records to understand conditions and trends
Related: Existing data, automated collection, public records, archival research
Active (Data Collection)
Direct engagement with participants to gather data. Includes surveys, interview, focus groups, and participatory observation, where planners actively solicit information to address specific planning issues.
Related: Field research
Community Involvement
Engaging local residents and stakeholders in the planning process to ensure that their needs, preferences, and concerns are considered. Techniques include public meetings, workshops, participatory planning sessions, and community advisory boards.
Related: Stakeholder engagement, collaborative planning, resident feedback, civic engagement, Alinsky Organizations, Ladder of Citizen Participation (Arnstein)
Alinsky Organization
A type of community organization inspired by Saul Alinsky's principles, focusing on grassroots activism and empowering local citizens to advocate for social change and engage in the political process.
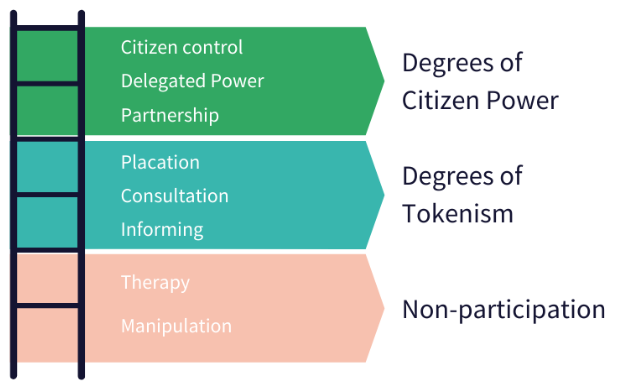
Ladder of Citizen Participation (Arnstein)
A framework developed by Sherry Arnstein to evaluate and depict the levels of citizen involvement in decision-making processes, ranging from non-participation to true citizen power.
Privacy and Confidentiality Concerns
Ethical and legal obligation to protect individuals’ personal information during data collection and analysis.
Methods such as anonymizing data, obtaining informed consent, and adhering to data protection regulations to ensure trust and compliance.
Related: Data protection, confidentiality agreements, ethical standards, legal compliance, personal information, data security, privacy policies, sensitive data, freedom of information, open meetings acts, sunshine laws
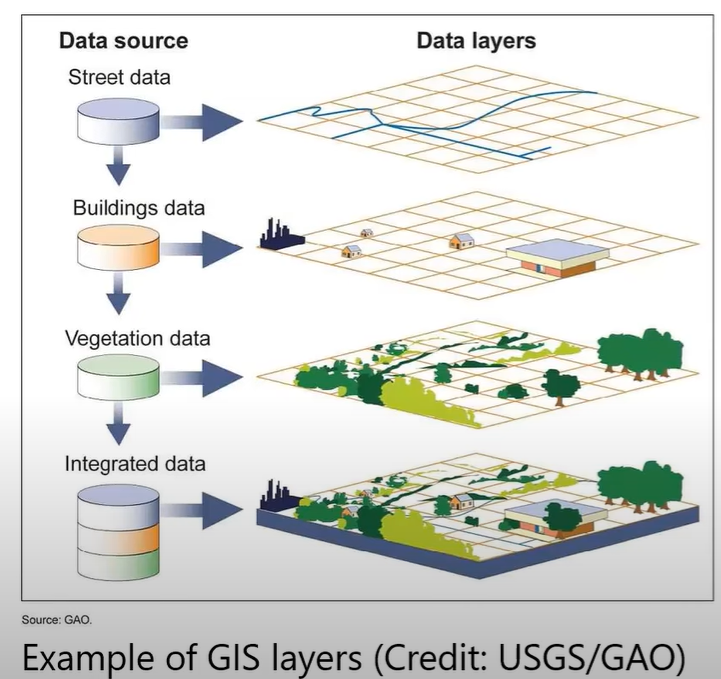
GIS (Geographic Information Systems)
Used to capture, store, manipulate, analyze, manage, and present spatial or geographic data. GIS helps planners visualize and interpret data to understand spatial relationships, patterns, and trends, facilitation informed decision-making.
Related: Location analysis, GIS software, GIS hardware (computer equipment), GIS software, GIS data and metadata, layers and overlays (shapes and data), spatial analysis (e.g. buffering, modelling, etc.), suitability analysis, GIS in plan and scenario development, ESRI (company)
GIS Layers (Example)
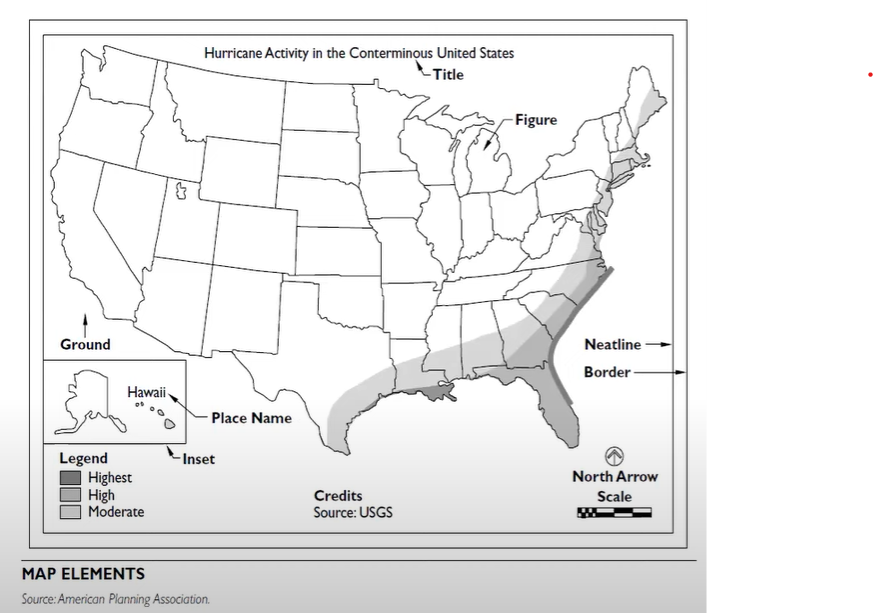
Mapping
Creating visual representations of spatial data to illustrate various aspects of the community, such as land use, transportation networks, demographics, and environmental features, aiding in the planning and analysis of the community.
Related: Location analysis, GIS software, GIS hardware (computer equipment), GIS software, GIS data and metadata, layers and overlays (shapes and data), spatial analysis (e.g. buffering, modelling, etc.), suitability analysis, GIS in plan and scenario development, ESRI (company)
Elements of a map (Example)
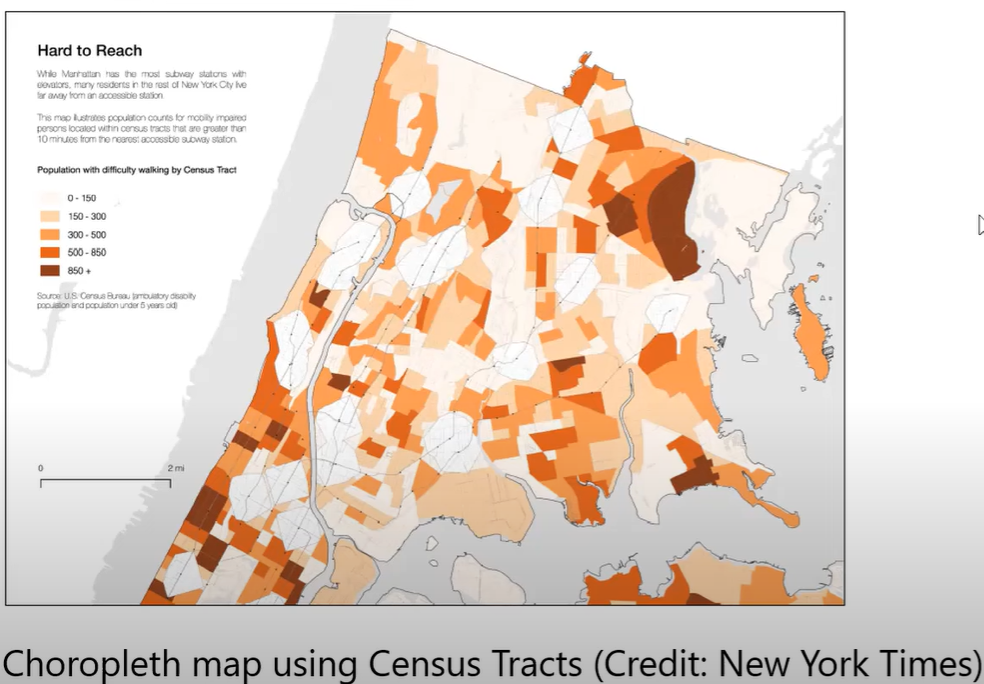
Choropleth Map
A type of thematic map that uses color or shading to represent statistical data across predefined geographical areas, making it easier to visualize variations in data such as population density or election results.
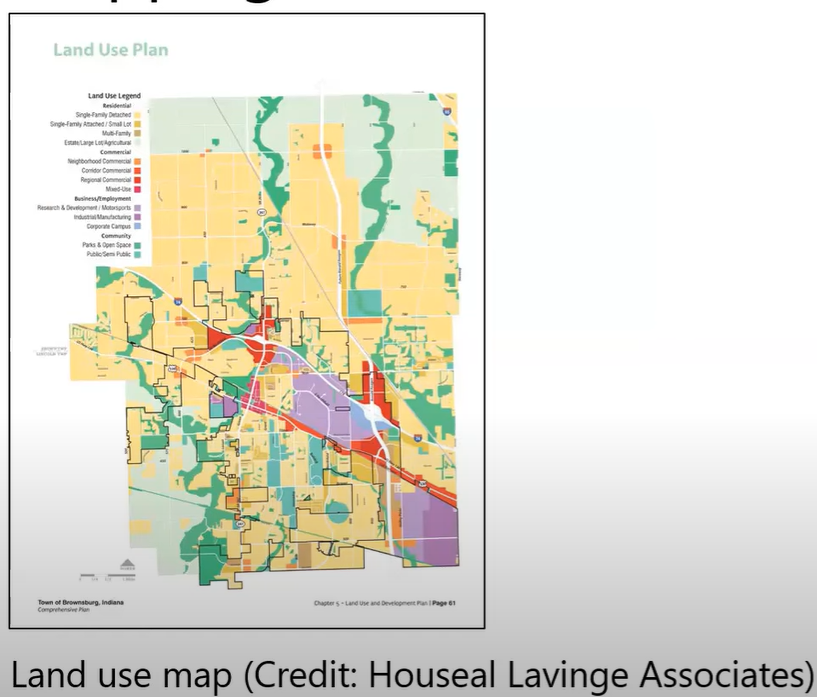
Land Use Map
A visual representation that displays different land use categories within a specific area, showing how land is allocated for residential, commercial, industrial, agricultural, and recreational purposes.
Public Land Survey System (PLSS) - Township/Range Schematic
From principal meridian and baseline
Township - 36 square miles
Section - 1 square mile
Range - Numbered 1-36 within section
(Example is T2S-R3W-S14-NE ¼ NW ¼)

Interpretation
Analyzing and explaining the meaning of spatial data and patterns. Planners use interpretation to derive insights from maps and GIS data, informing decisions related to land use, zoning, transportation, and environmental planning.
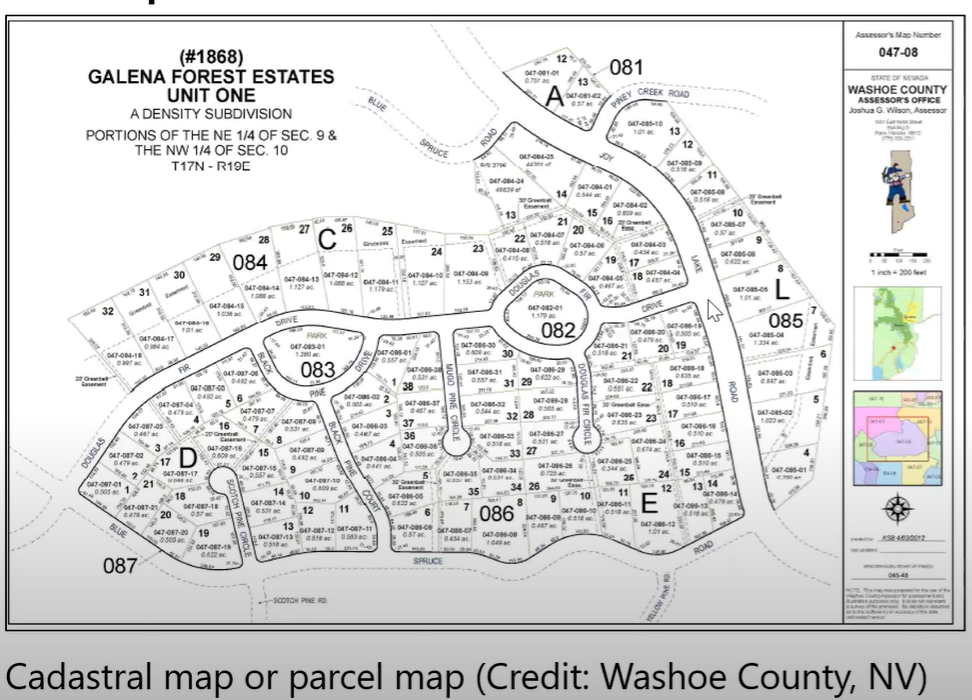
Related: Data analysis, spatial patterns, data interpretation, spatial insights, urban planning decisions, geographic analysis, land use interpretation, zoning analysis, transportation planning, environmental interpretation, aerial photographs, orthophotos, remote sensing, satellite image classification, topographic maps, property maps, parcel maps, cadastral maps
Cadastral Map (Example)
3D Visualization
Three-dimensional representations of urban spaces to better understand and communicate spatial relationships and design concepts. Technology aids in visualizing buildings, terrain, infrastructure, and proposed developments in a realistic manner
Related: 3D modeling, walk-through models, virtual reality, digital twins
Modeling
Procedural, figurative, and computational representations of urban environments to simulate and analyze spatial dynamics. Models can predict the impact of various planning scenarios on transportation, land use, environmental sustainability, and urban growth.
Related: Urban dynamics, SimCity (let’s goooooo), digital twins
Qualitative Data for Research
Non-numerical information to understand community conditions and experiences, especially through methods such as interviews, focus groups, and observations
Good for deep insights into stakeholder perspectives and understanding contextual factors
Related: Case studies, narrative data, field notes, participatory research, nominal data, ordinal scale
Quantitative Data for Research
Collection and analysis of numerical data, usually gathered through surveys, censuses, and records to identify patterns, trends, and correlations at the community level.
Related: Continuous data, discrete data, interval scale, mean, average, median, mode, range, ratio scale, index, standard deviation, variance, Z-score, inferential statistics, decennial census, american community survey
Mean
Average - Find sum of all numbers, then divide by the amount of numbers
Median
Middle - Middle value when numbers are ordered
Mode
Most - Value which is written the most in a set
Range
Largest to Smallest - The largest number subtracted by the smallest number
Standard Deviation
A measure of the amount of variation or dispersion in a set of values, indicating how much the values deviate from the mean.
1 S.D. = 68% of data
2 S.D. = 95% of data
3 S.D. = 99.7% of data
Z-Score
A statistic that indicates how many standard deviations a data point is from the mean of a data set.
Experiential Learning
Acquiring knowledge through hands-on experiences such as fieldwork, case studies, and simulations. This approach allows planners to apply theoretical concepts in real-world contexts, enhancing their research and assessment skills. It fosters critical thinking, problem-solving, and a deeper understanding of complex urban issues, ultimately leading to more effective planning practices
Related: Participant observation, ethnography, sense of place, environmental perception, critical thinking
Oral Histories
Personal stories and firsthand accounts to document the historical and cultural elements of the community. Captures diverse perspectives and memories, enriching the understanding of community development and change.
Related: Storytelling
Research Methods
Encompass various techniques for gathering, analyzing, and interpreting data related to urban environments. Includes qualitative, quantitative (experimental), and mixed-method approaches to provide comprehensive insights and inform planning, policy, and development decisions.
Related: Experimental, quasi-experimental, non-experimental, mixed-methods, case studies, pilot studies, comparative analysis
Precedents and Examples
Examine previous projects, case studies, and models that serve as references for current planning activities to provide valuable insights, lessons learned, and practical approaches to inform and guide new planning projects.
Best Practices
Methods and techniques that have been widely accepted as superior alternatives because they produce optimal or better results. Often derived from systematic analysis and experience, serving as guidelines for effective planning and implementation.
Analysis and Reporting
Systematically examining data and information to draw conclusions and make recommendations. Includes collecting, processing, and presenting data in a format that supports decision-making and policy development.
Related: Data collection, questionnaires, interviews, observational studies, sample population, trend analysis, needs assessment, public opinion, survey methods, data gathering, cohort survival projection, holding or carrying capacity, location quotient, migration, natural increase, population estimates, population forecasts, population projections, population pyramid, trend analysis, linear regression analysis, shift-share analysis, step down estimation methods
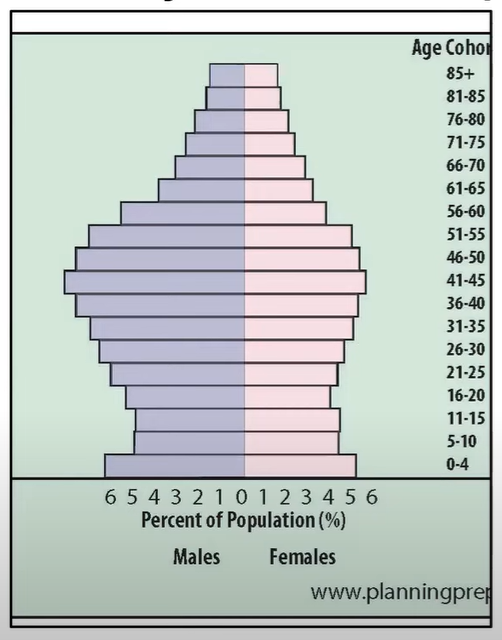
Population Pyramid
A graphical representation that shows the distribution of various age groups in a population, typically displayed as two back-to-back histograms, one for males and one for females.
Dependency Rate
Ratio of population under 18 and above 65 to population ages 18-65.
(Minors and Seniors to Working-age population)
Surveying
Collecting data and information from a sample of the population to understand trends, needs, and preferences. This can include methods such as questionnaires, interviews, and observational studies. Relevance and interpretation of surveyed information is dependent on the sampling method and procedures.
Related: Field research
Sources of Data
Origins of data necessary for analysis and decision-making. Includes census records, governmental reports, surveys, academic studies, spatial data, community feedback, etc.
Metadata
Data that provides information about other data. Used for facilitating organization, discovery of data, and understanding datasets. Includes details such as data source, date, creator, purpose, format, and spatial characteristics.
Recognizing Implicit Bias
Unconscious Bias (Implicit Bias) - Social stereotypes about certain groups of people that individuals form outside their own conscious awareness.
Everyone holds unconscious beliefs about various social and identity groups, and the biases stem from a tendency to organize social worlds through categorization.
“A strong feeling in favor of or against one group of people, or one side in an argument, often not based on fair judgement” (Oxford)
Related: Equity, fairness, accuracy