APES Exam MCQ (100 Questions)
1/99
Earn XP
Name | Mastery | Learn | Test | Matching | Spaced | Call with Kai |
|---|
No analytics yet
Send a link to your students to track their progress
100 Terms
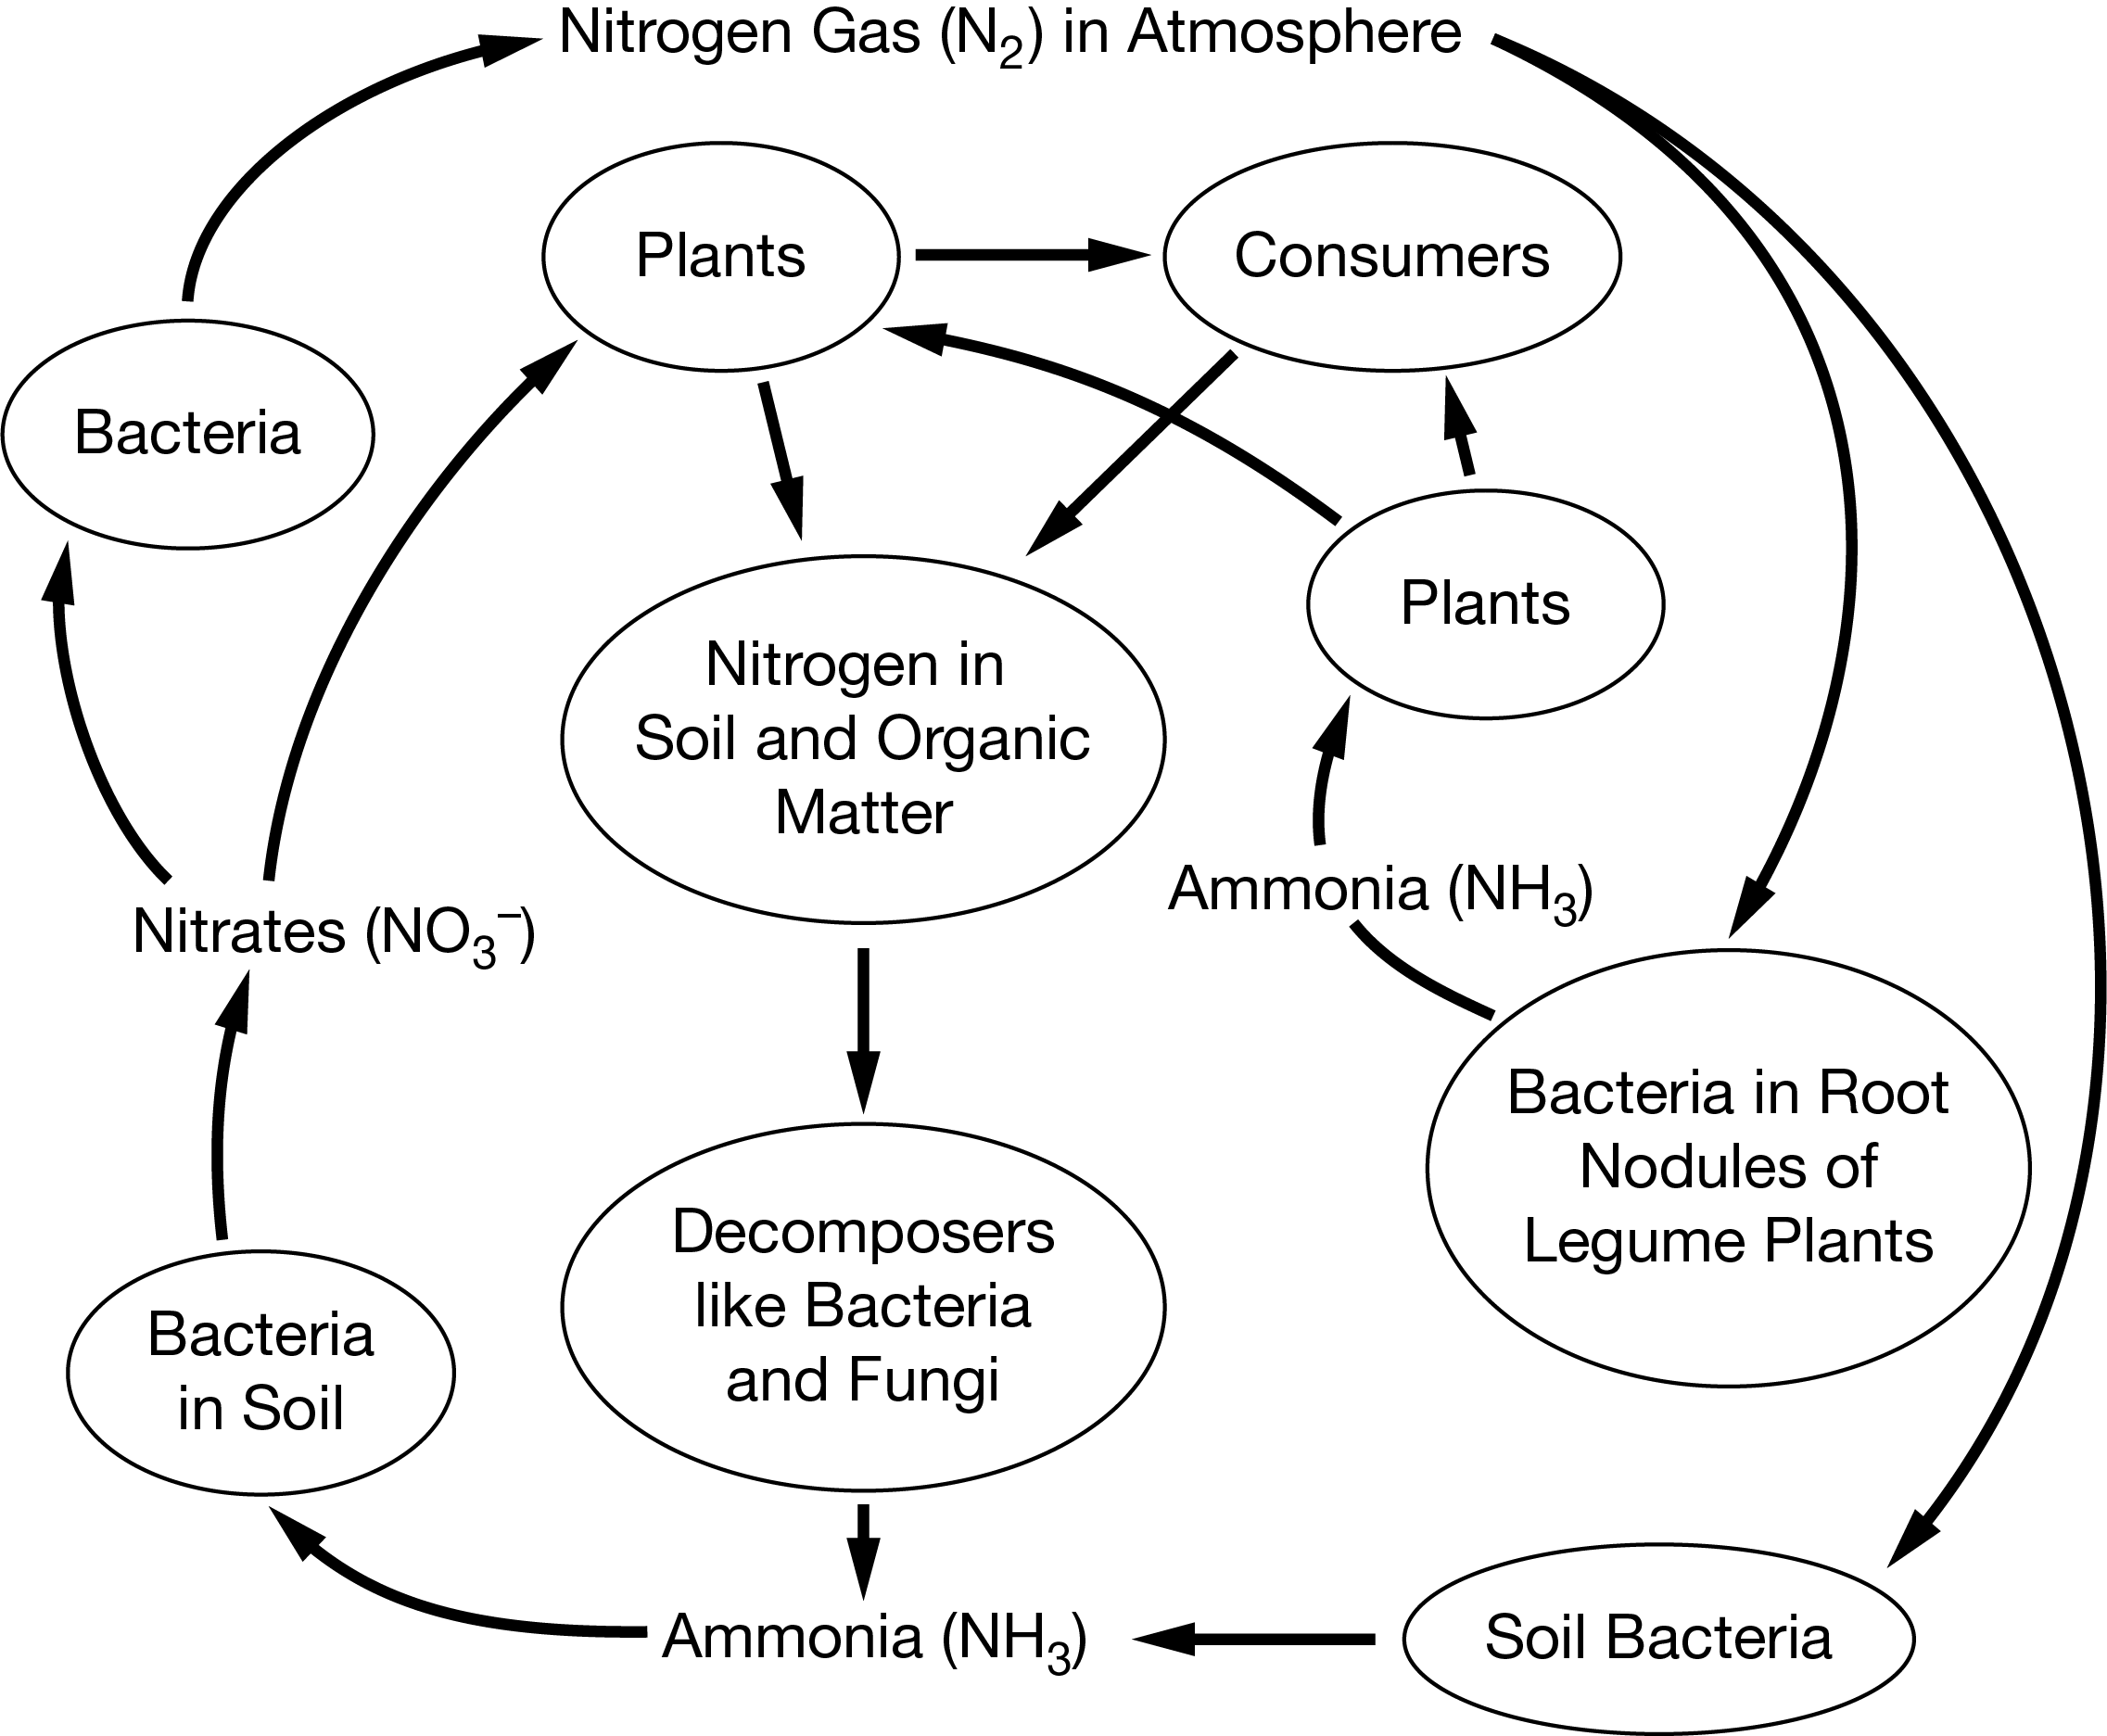
The diagram below shows a simplified nitrogen cycle.
Which of the following processes is illustrated by the downward arrows from the atmosphere that show the conversion of nitrogen gas into usable forms available to producers?
A. Nitrogen assimilation
B. Nitrogen fixation
C. Photosynthesis
D. Weathering
B. Nitrogen fixation
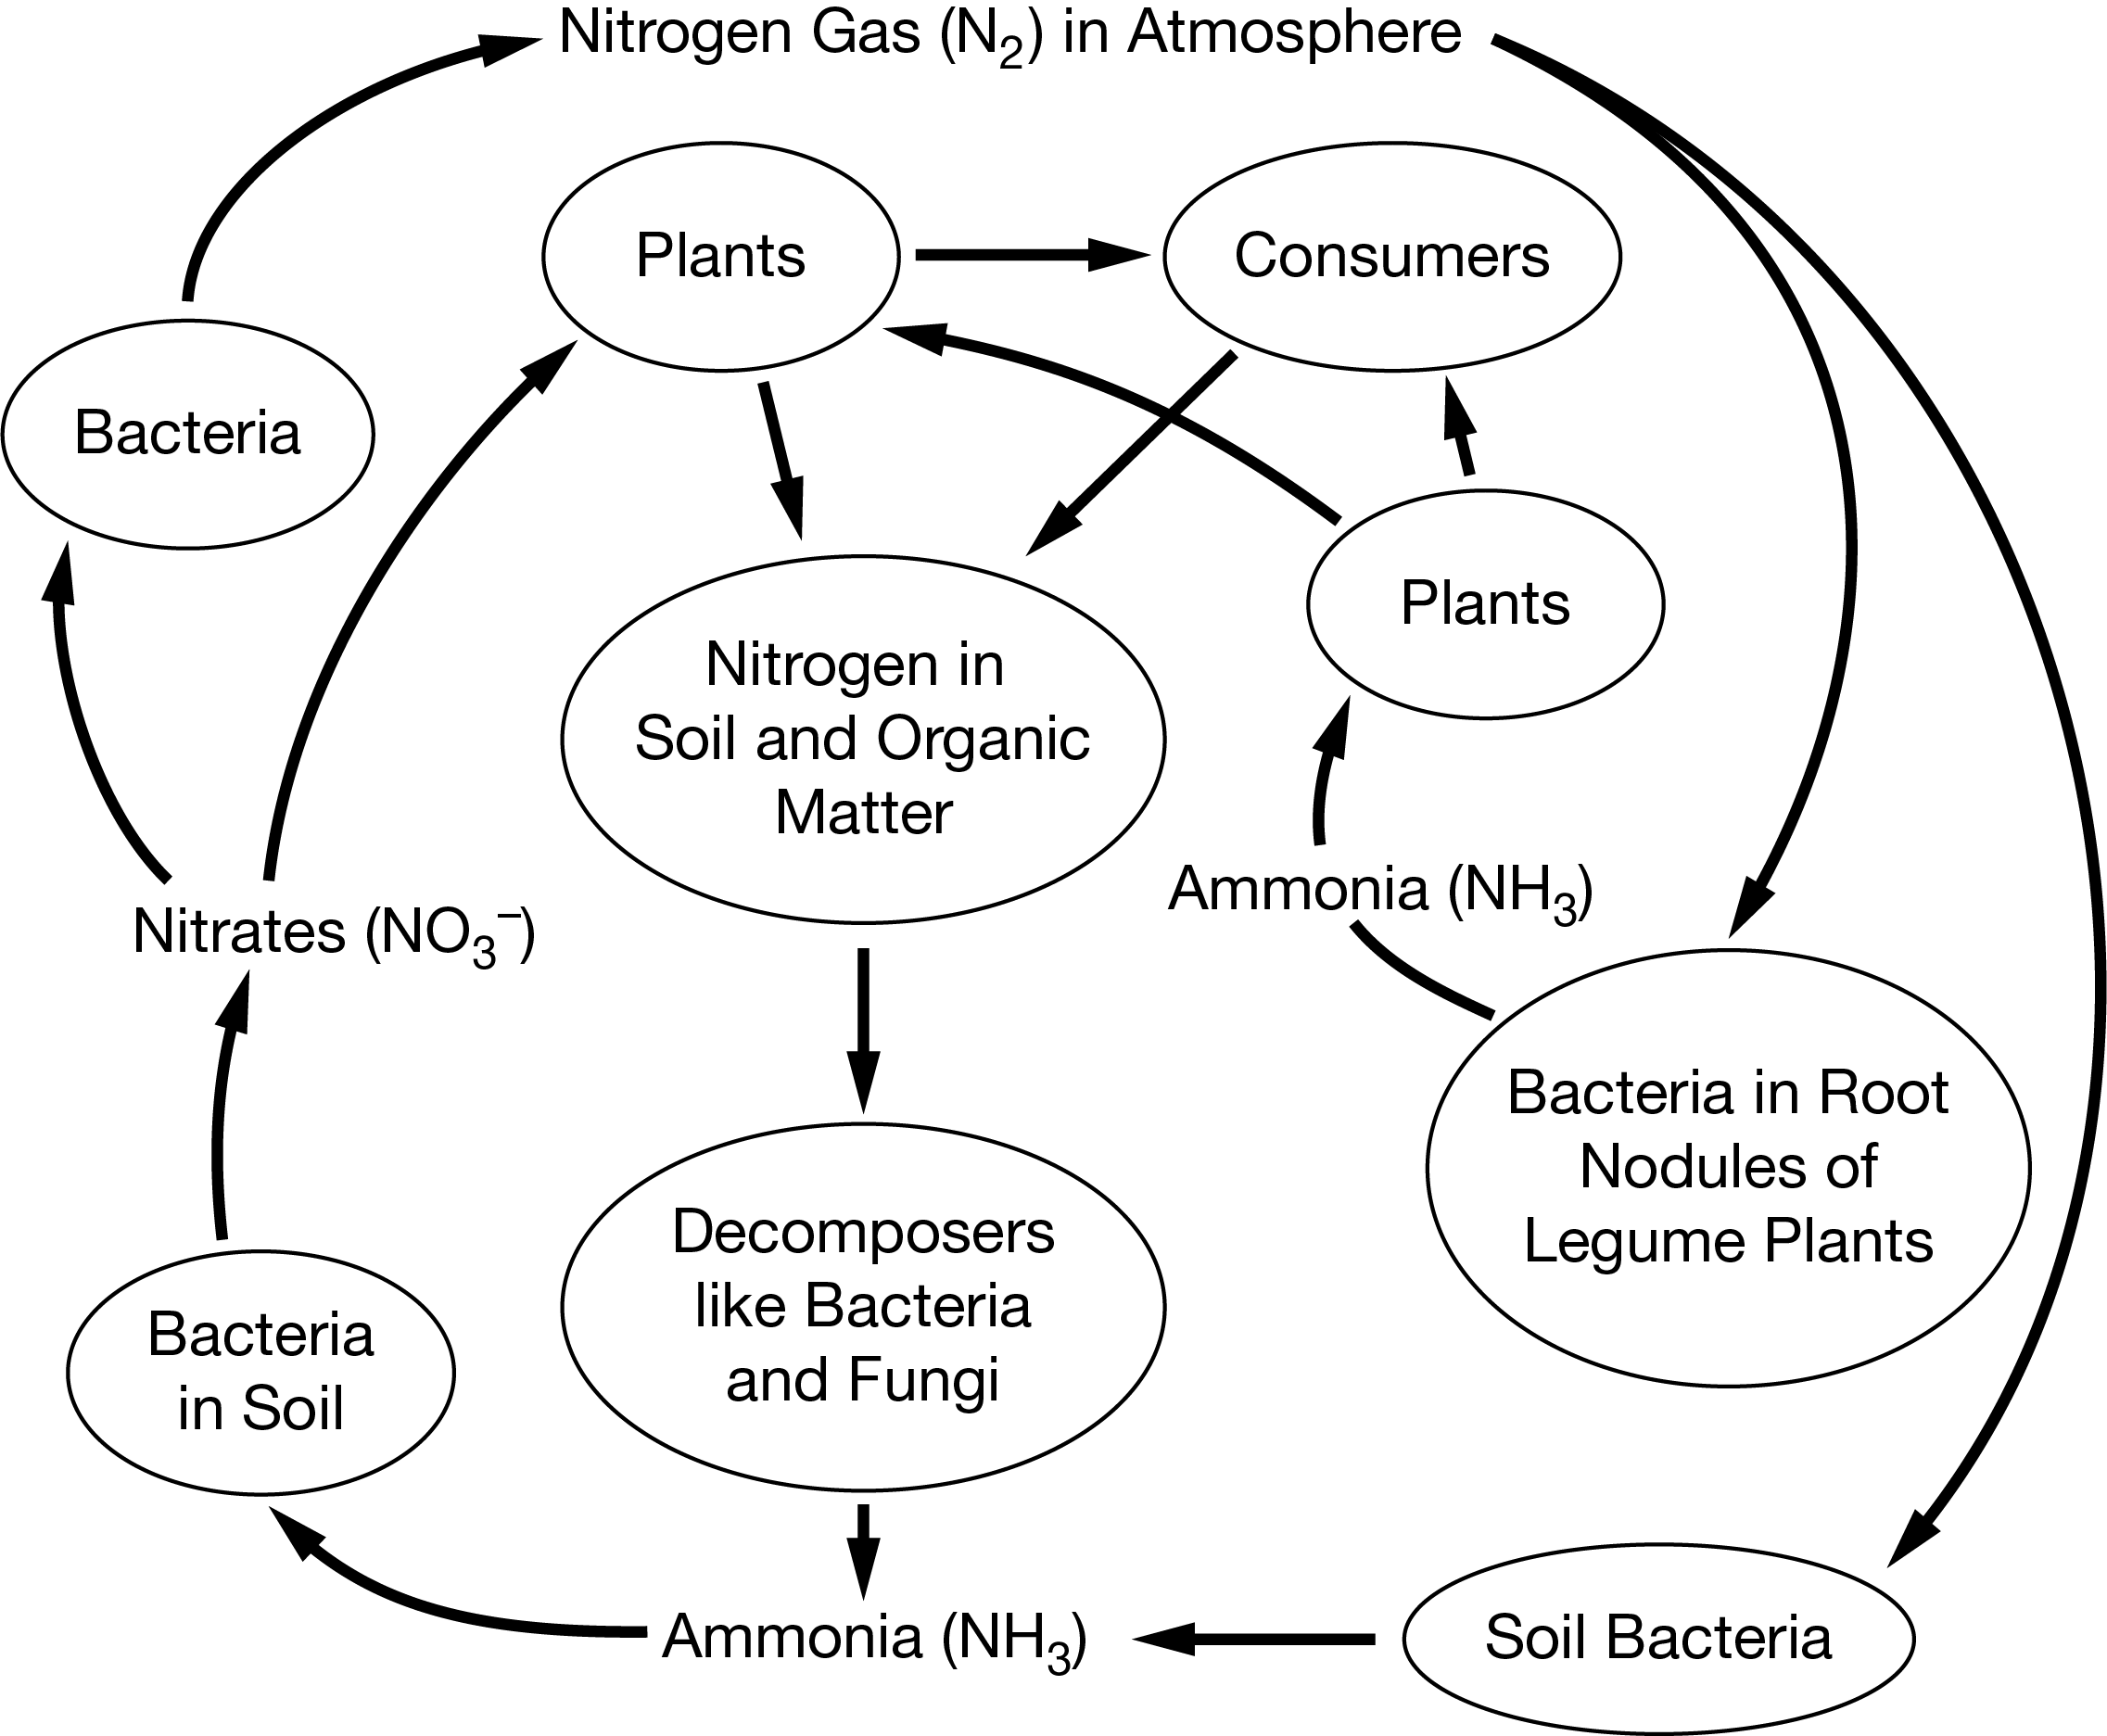
Which of the following types of organisms are required to complete the nitrogen cycle, including the process of denitrification?
A. Bacteria
B. Producers
C. Consumers
D. Fungi
A. Bacteria
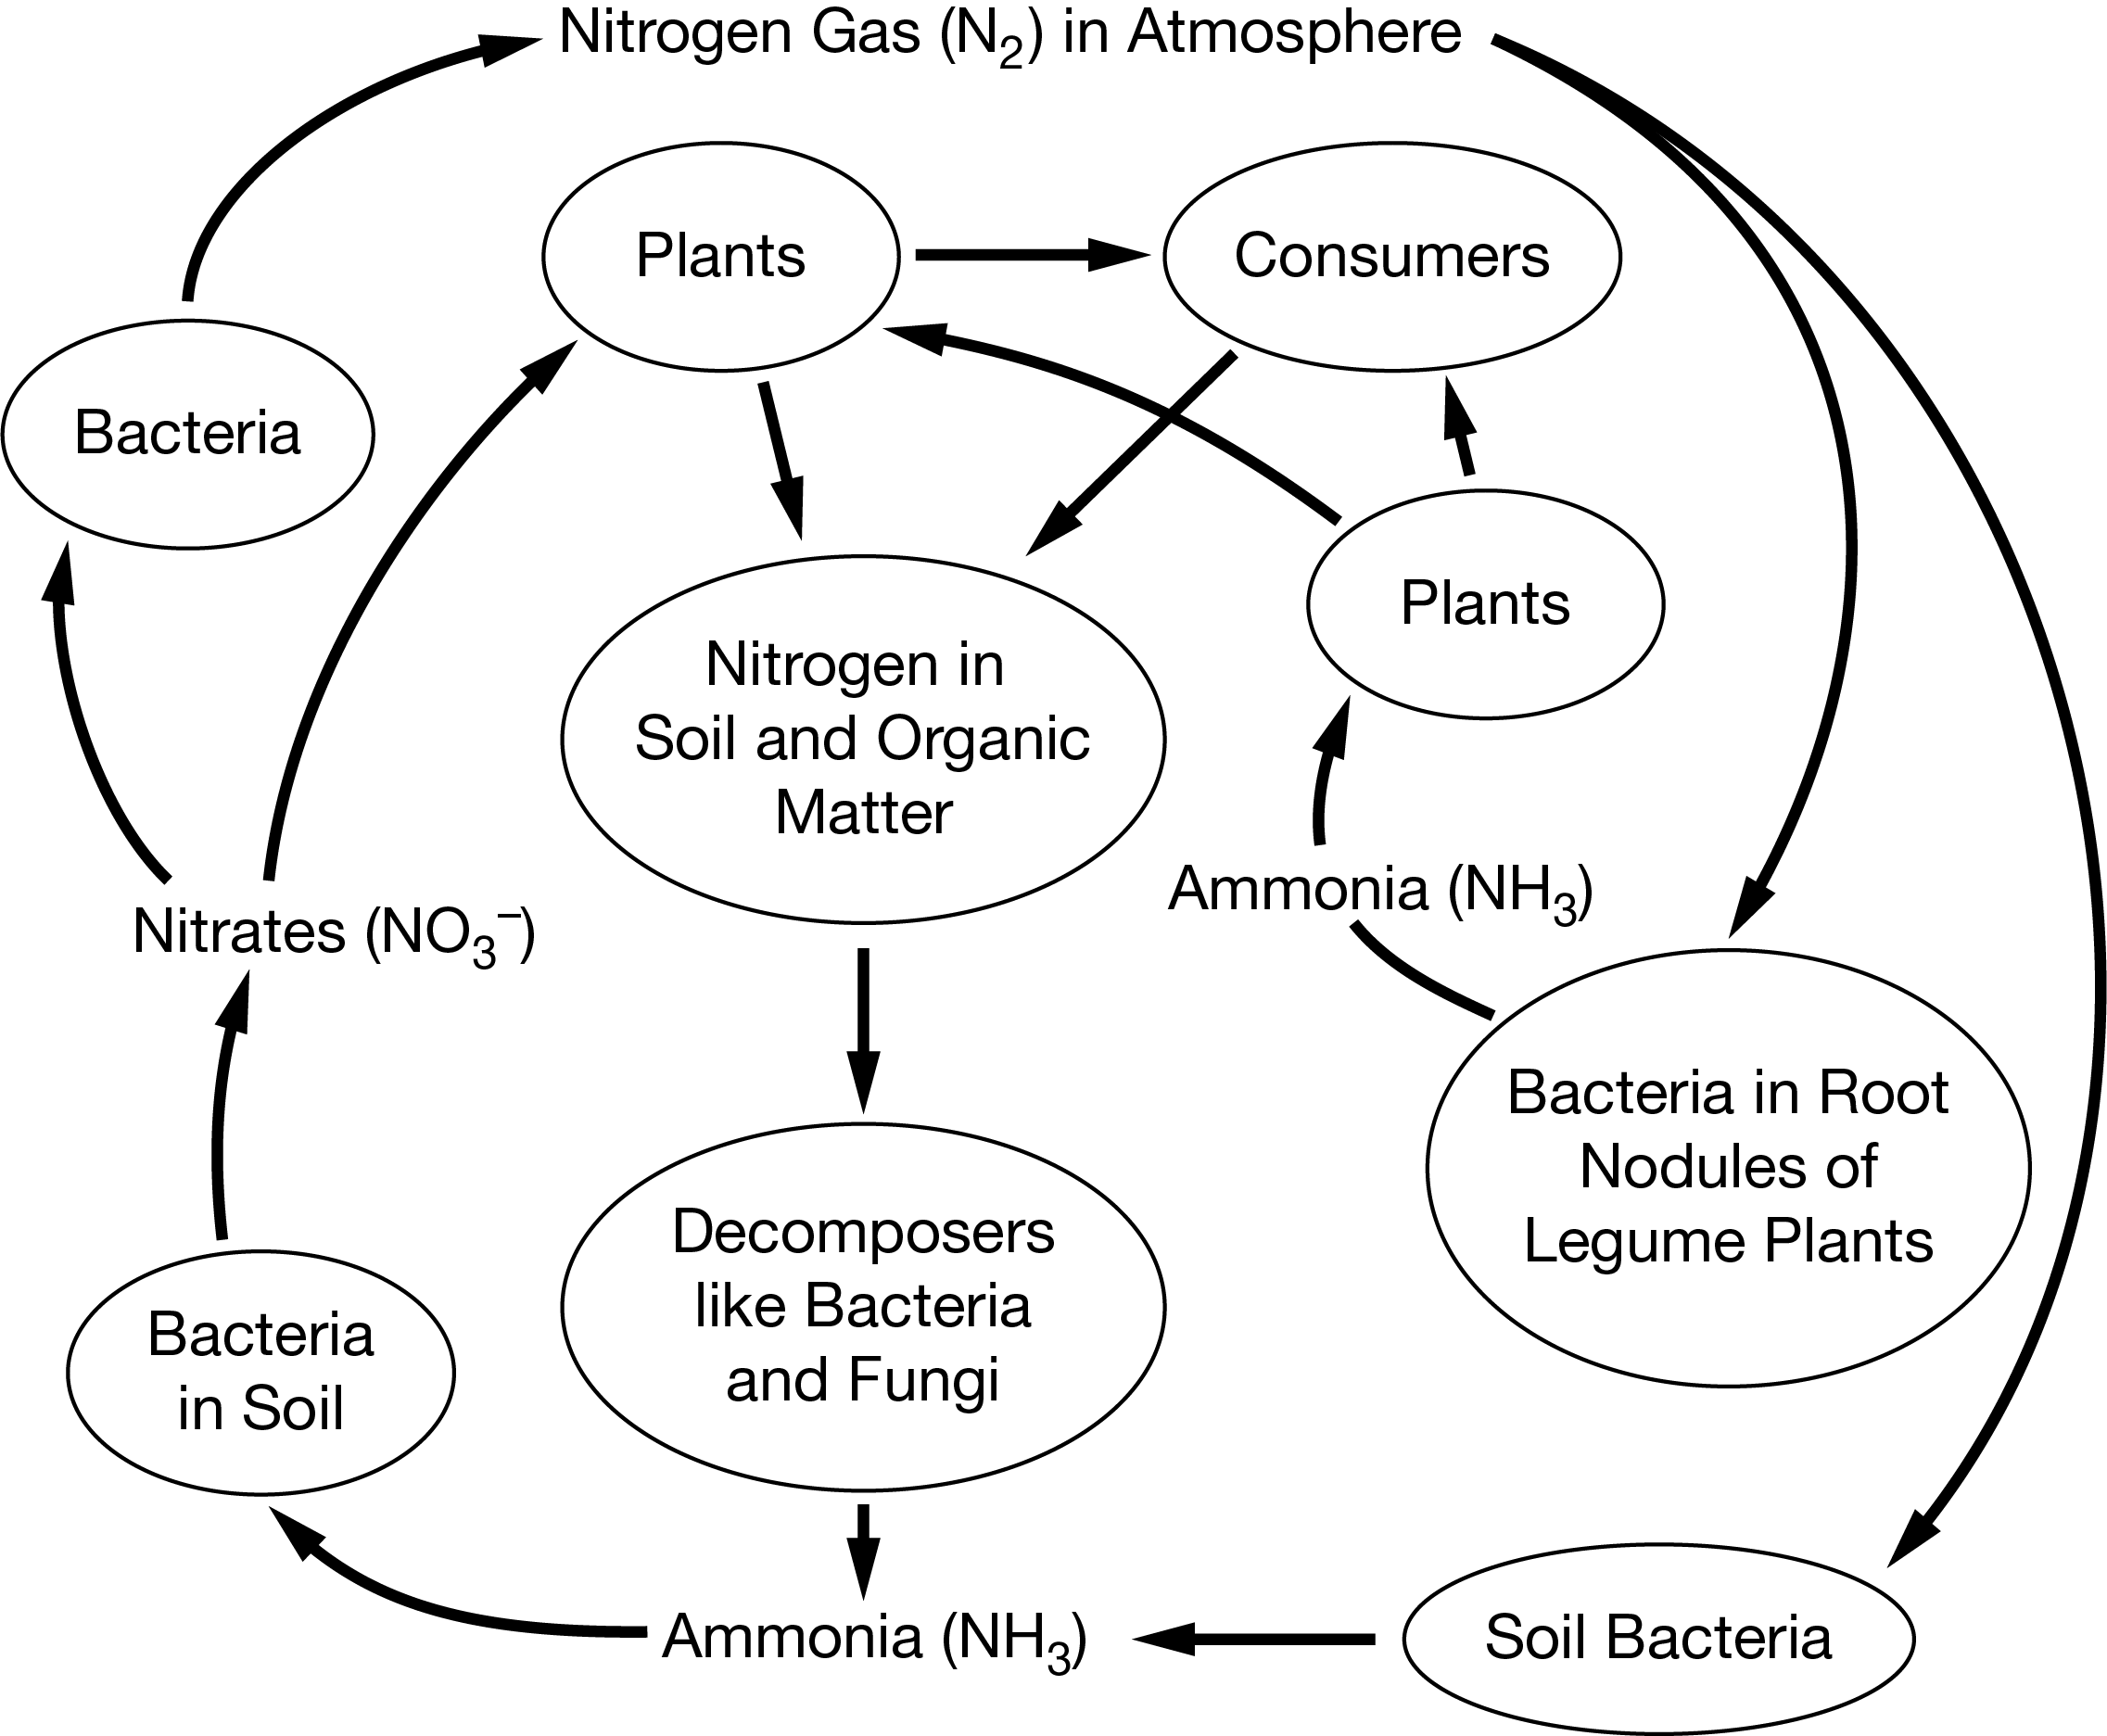
The majority of the nitrogen on Earth can be found in which of the following reservoirs?
A. Terrestrial plants
B. Soil bacteria
C. The atmosphere
D. Sedimentary rock
C. The atmosphere
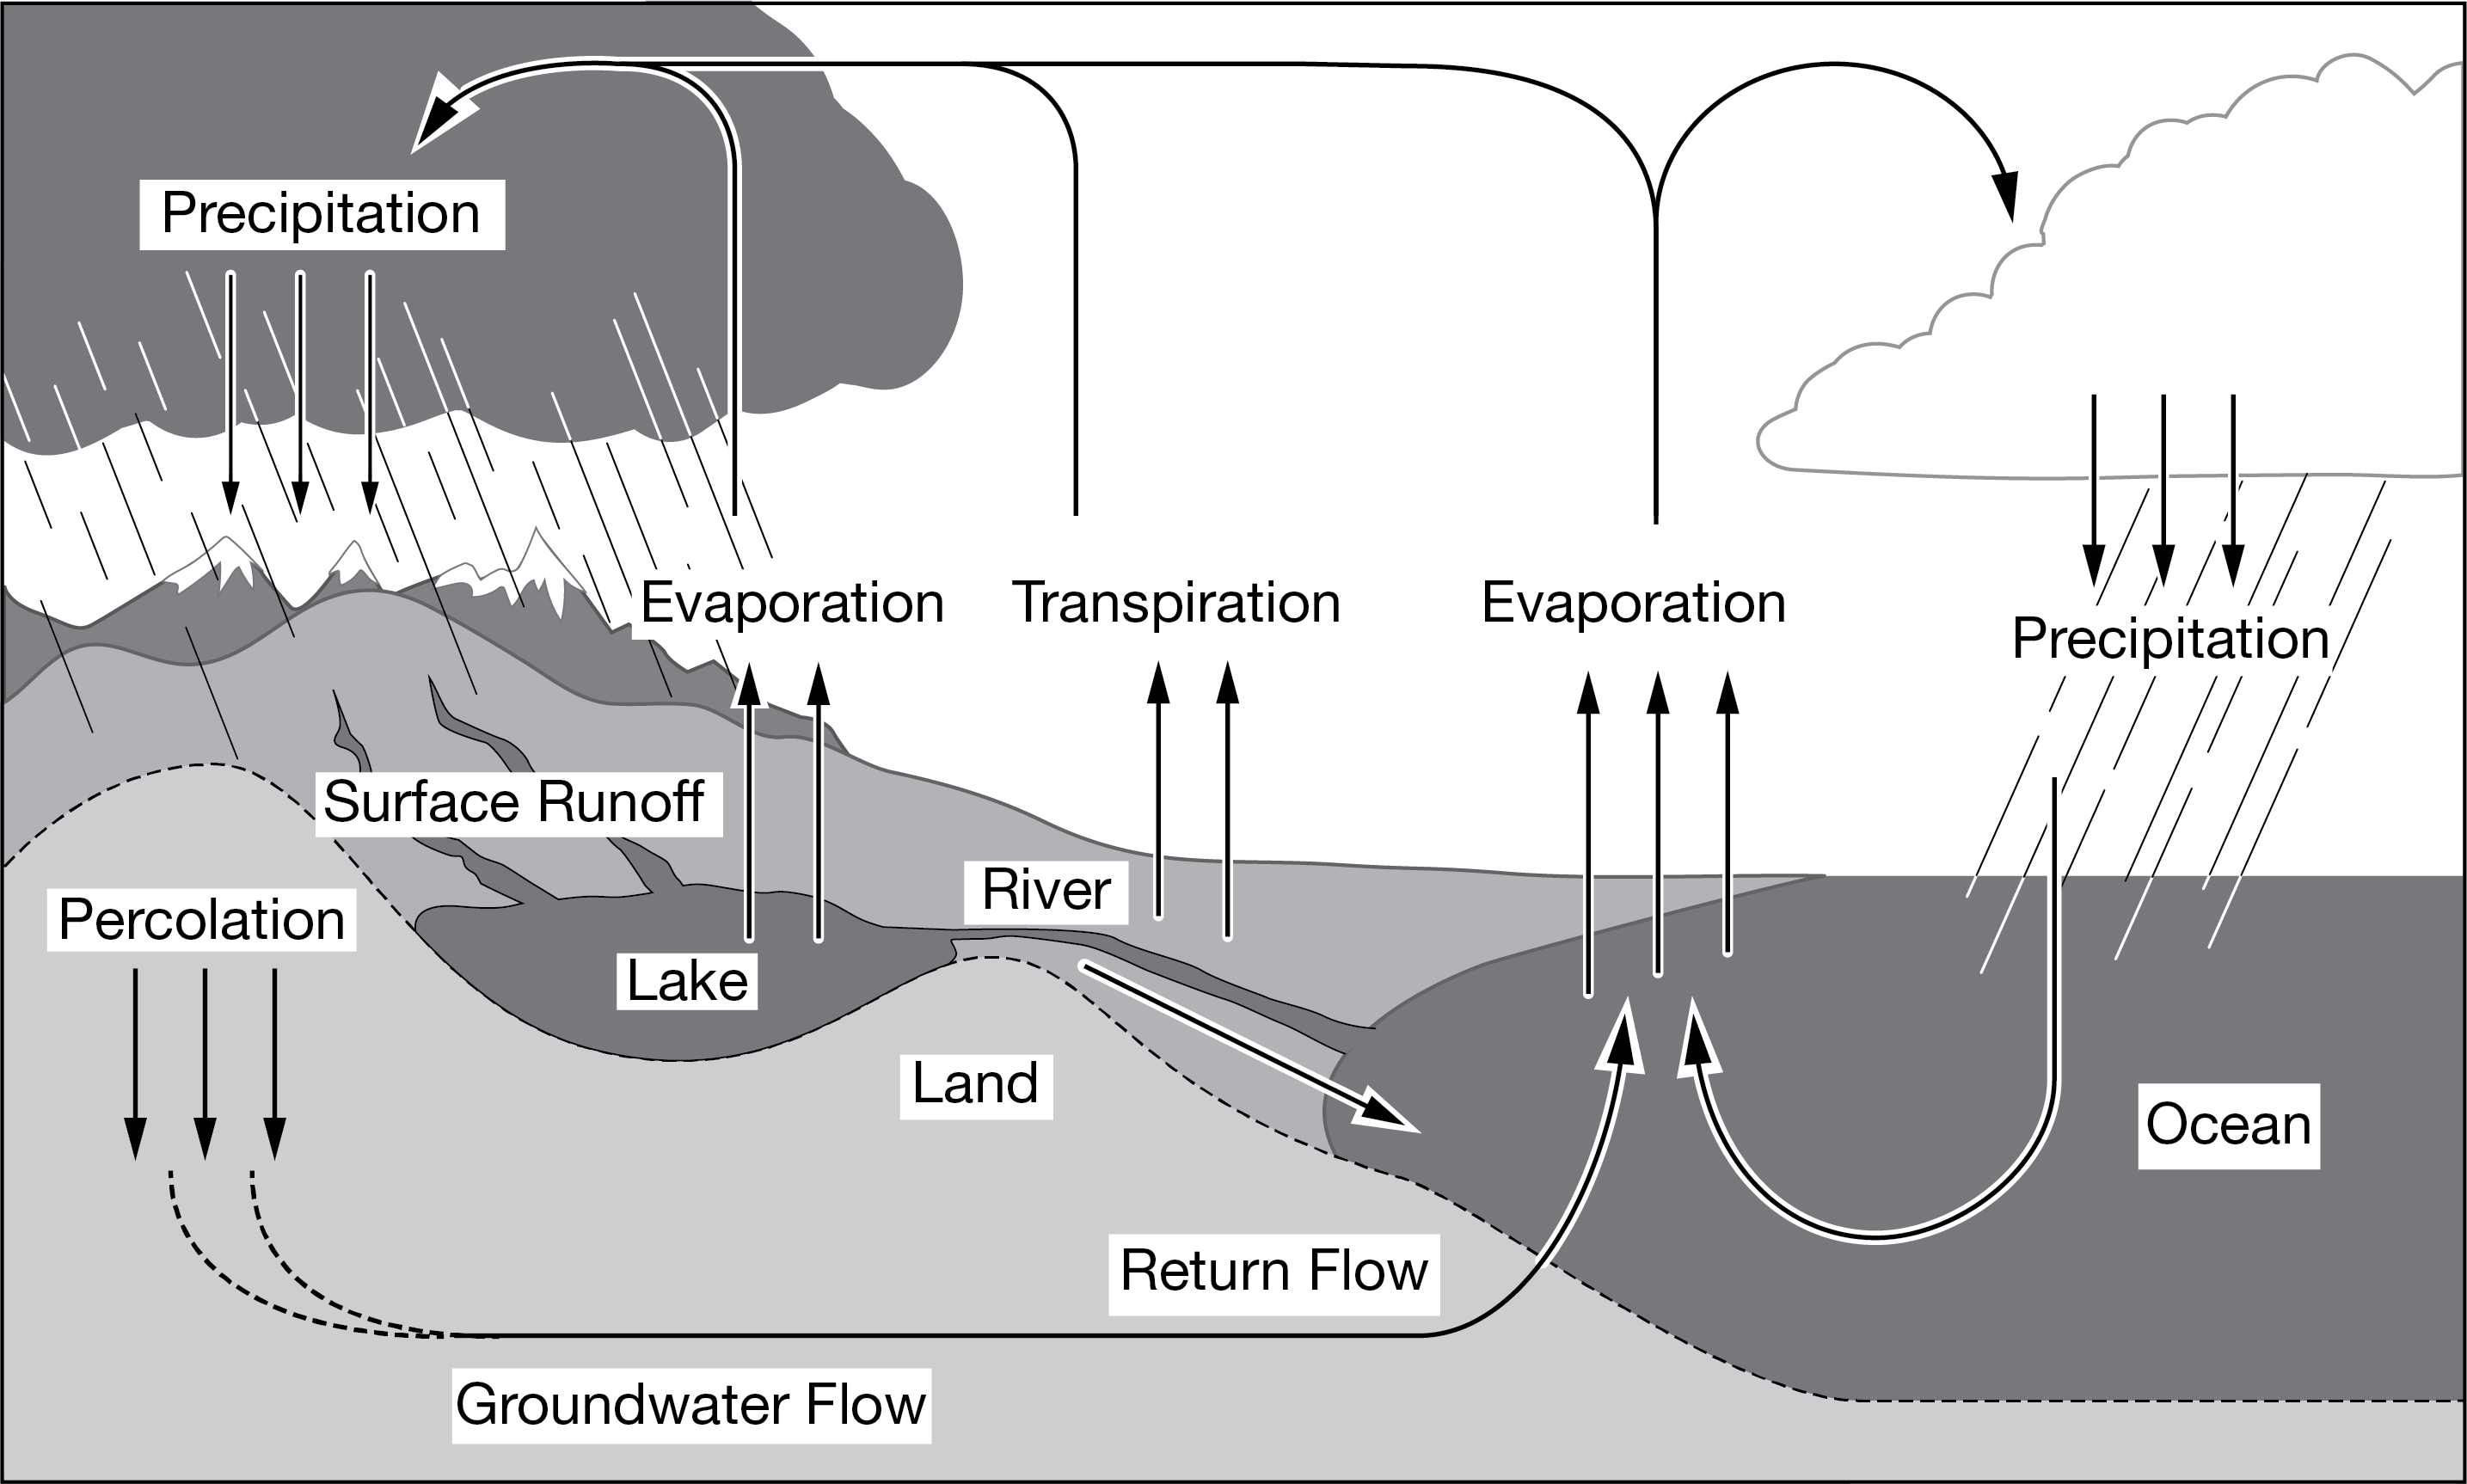
The diagram below shows the hydrologic cycle.
Which of the following best identifies a key component of the hydrologic cycle that powers the movement of water and is missing from the diagram?
Responses
A. Terrestrial animals
B. The Sun
C. Bacteria
D. Volcanoes
B. The Sun
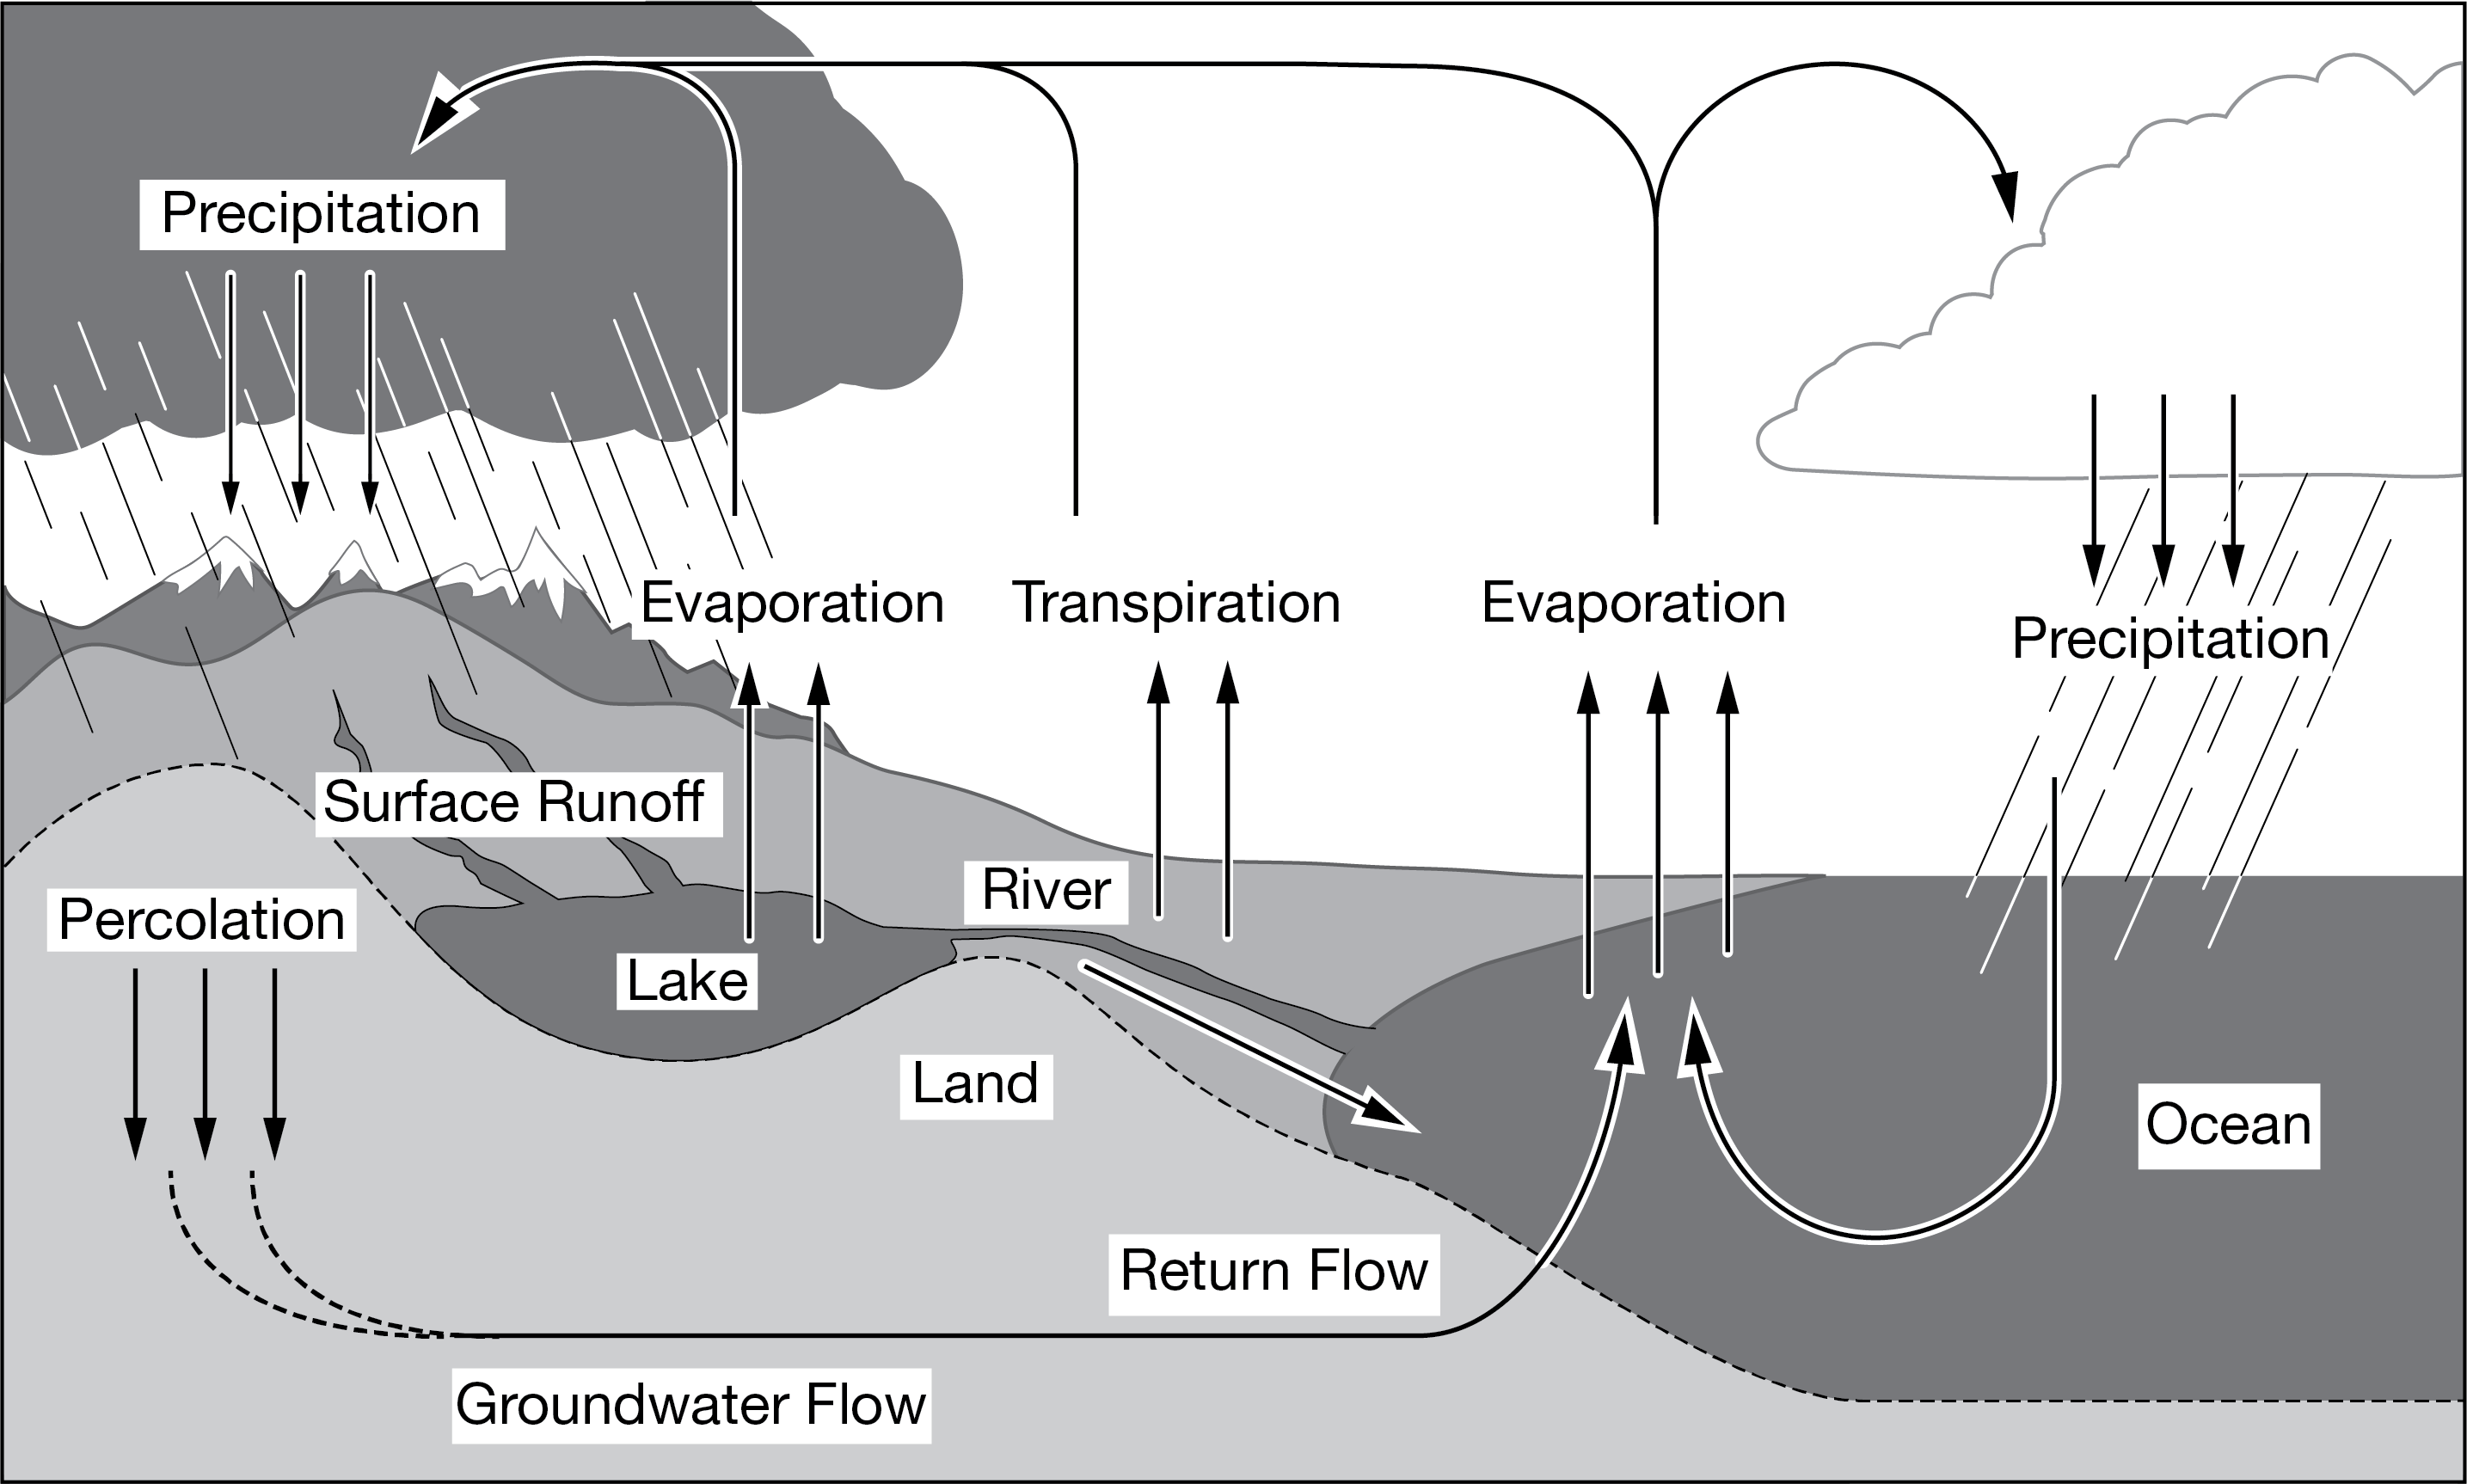
Which of the following major reservoirs of freshwater are missing from the diagram?
A. Fossil fuels
B. Rocks
C. Ice caps
D. Algae
C. Ice caps
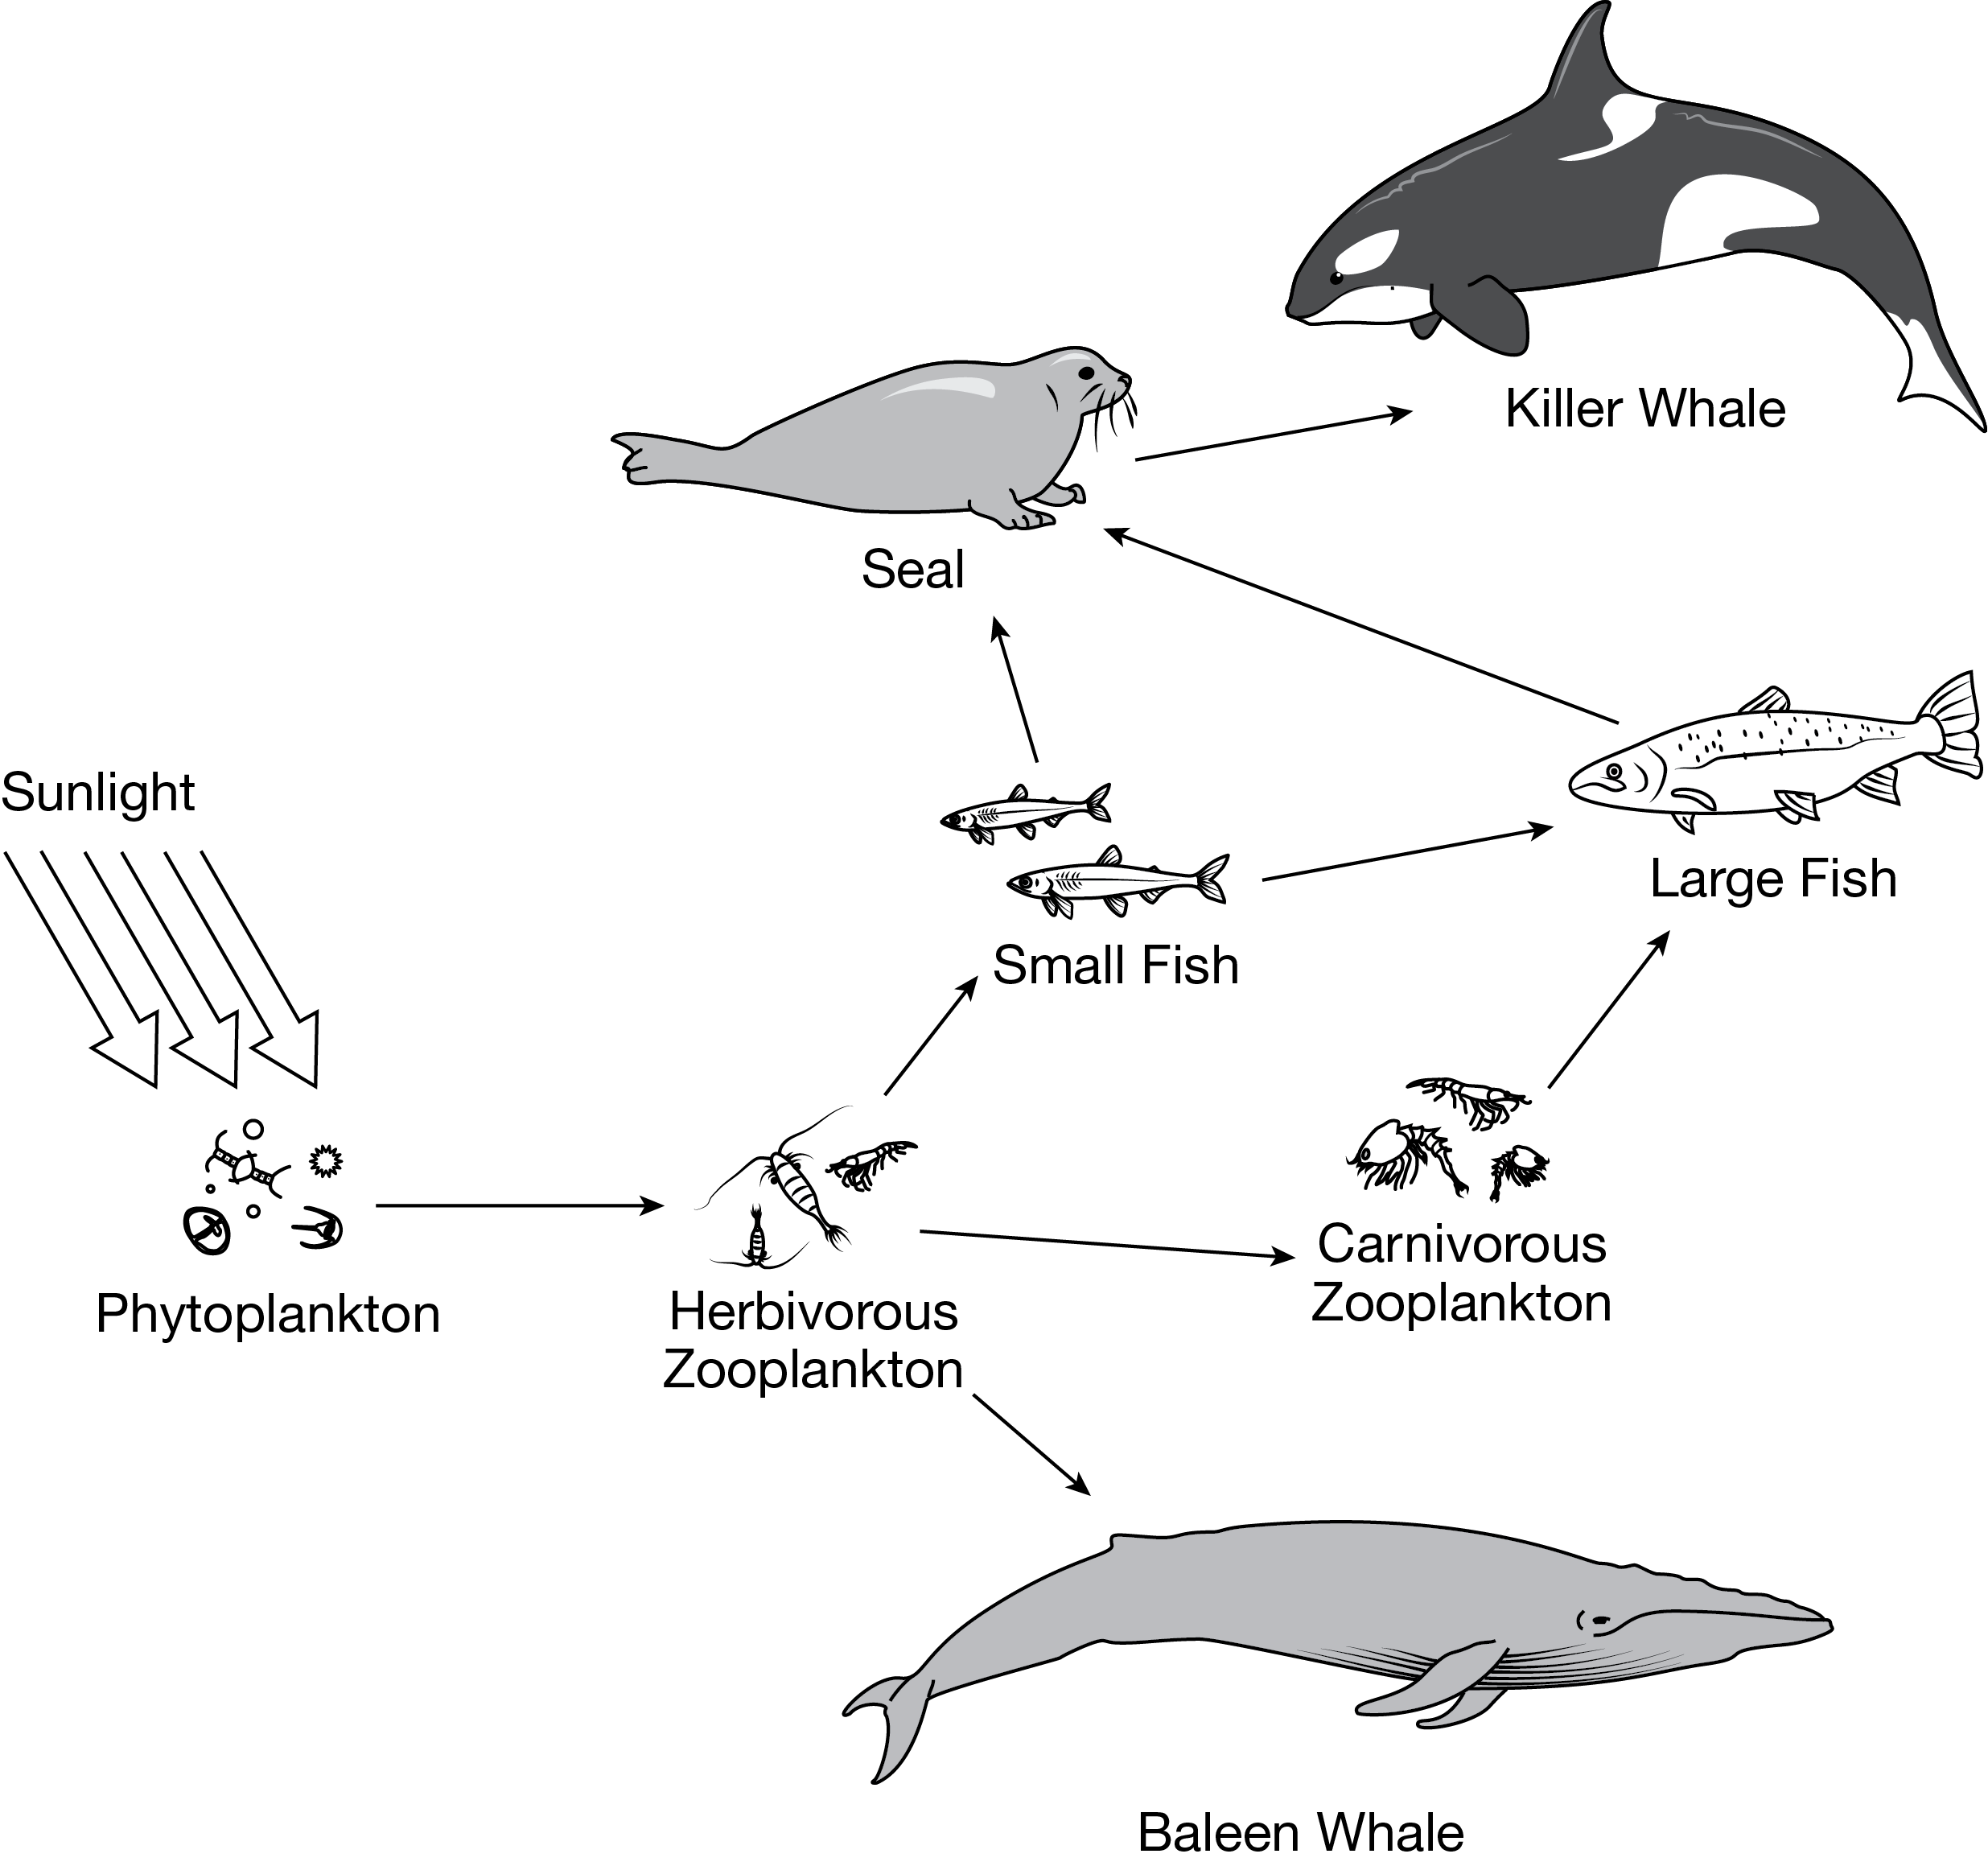
The diagram below shows a particular marine food web.
Which of the following best describes what is represented by the arrows in the food web?
A. The photosynthetic rates of producers
B. The flow of energy
C. The movement of predators
D. The decomposition of matter
B. The flow of energy
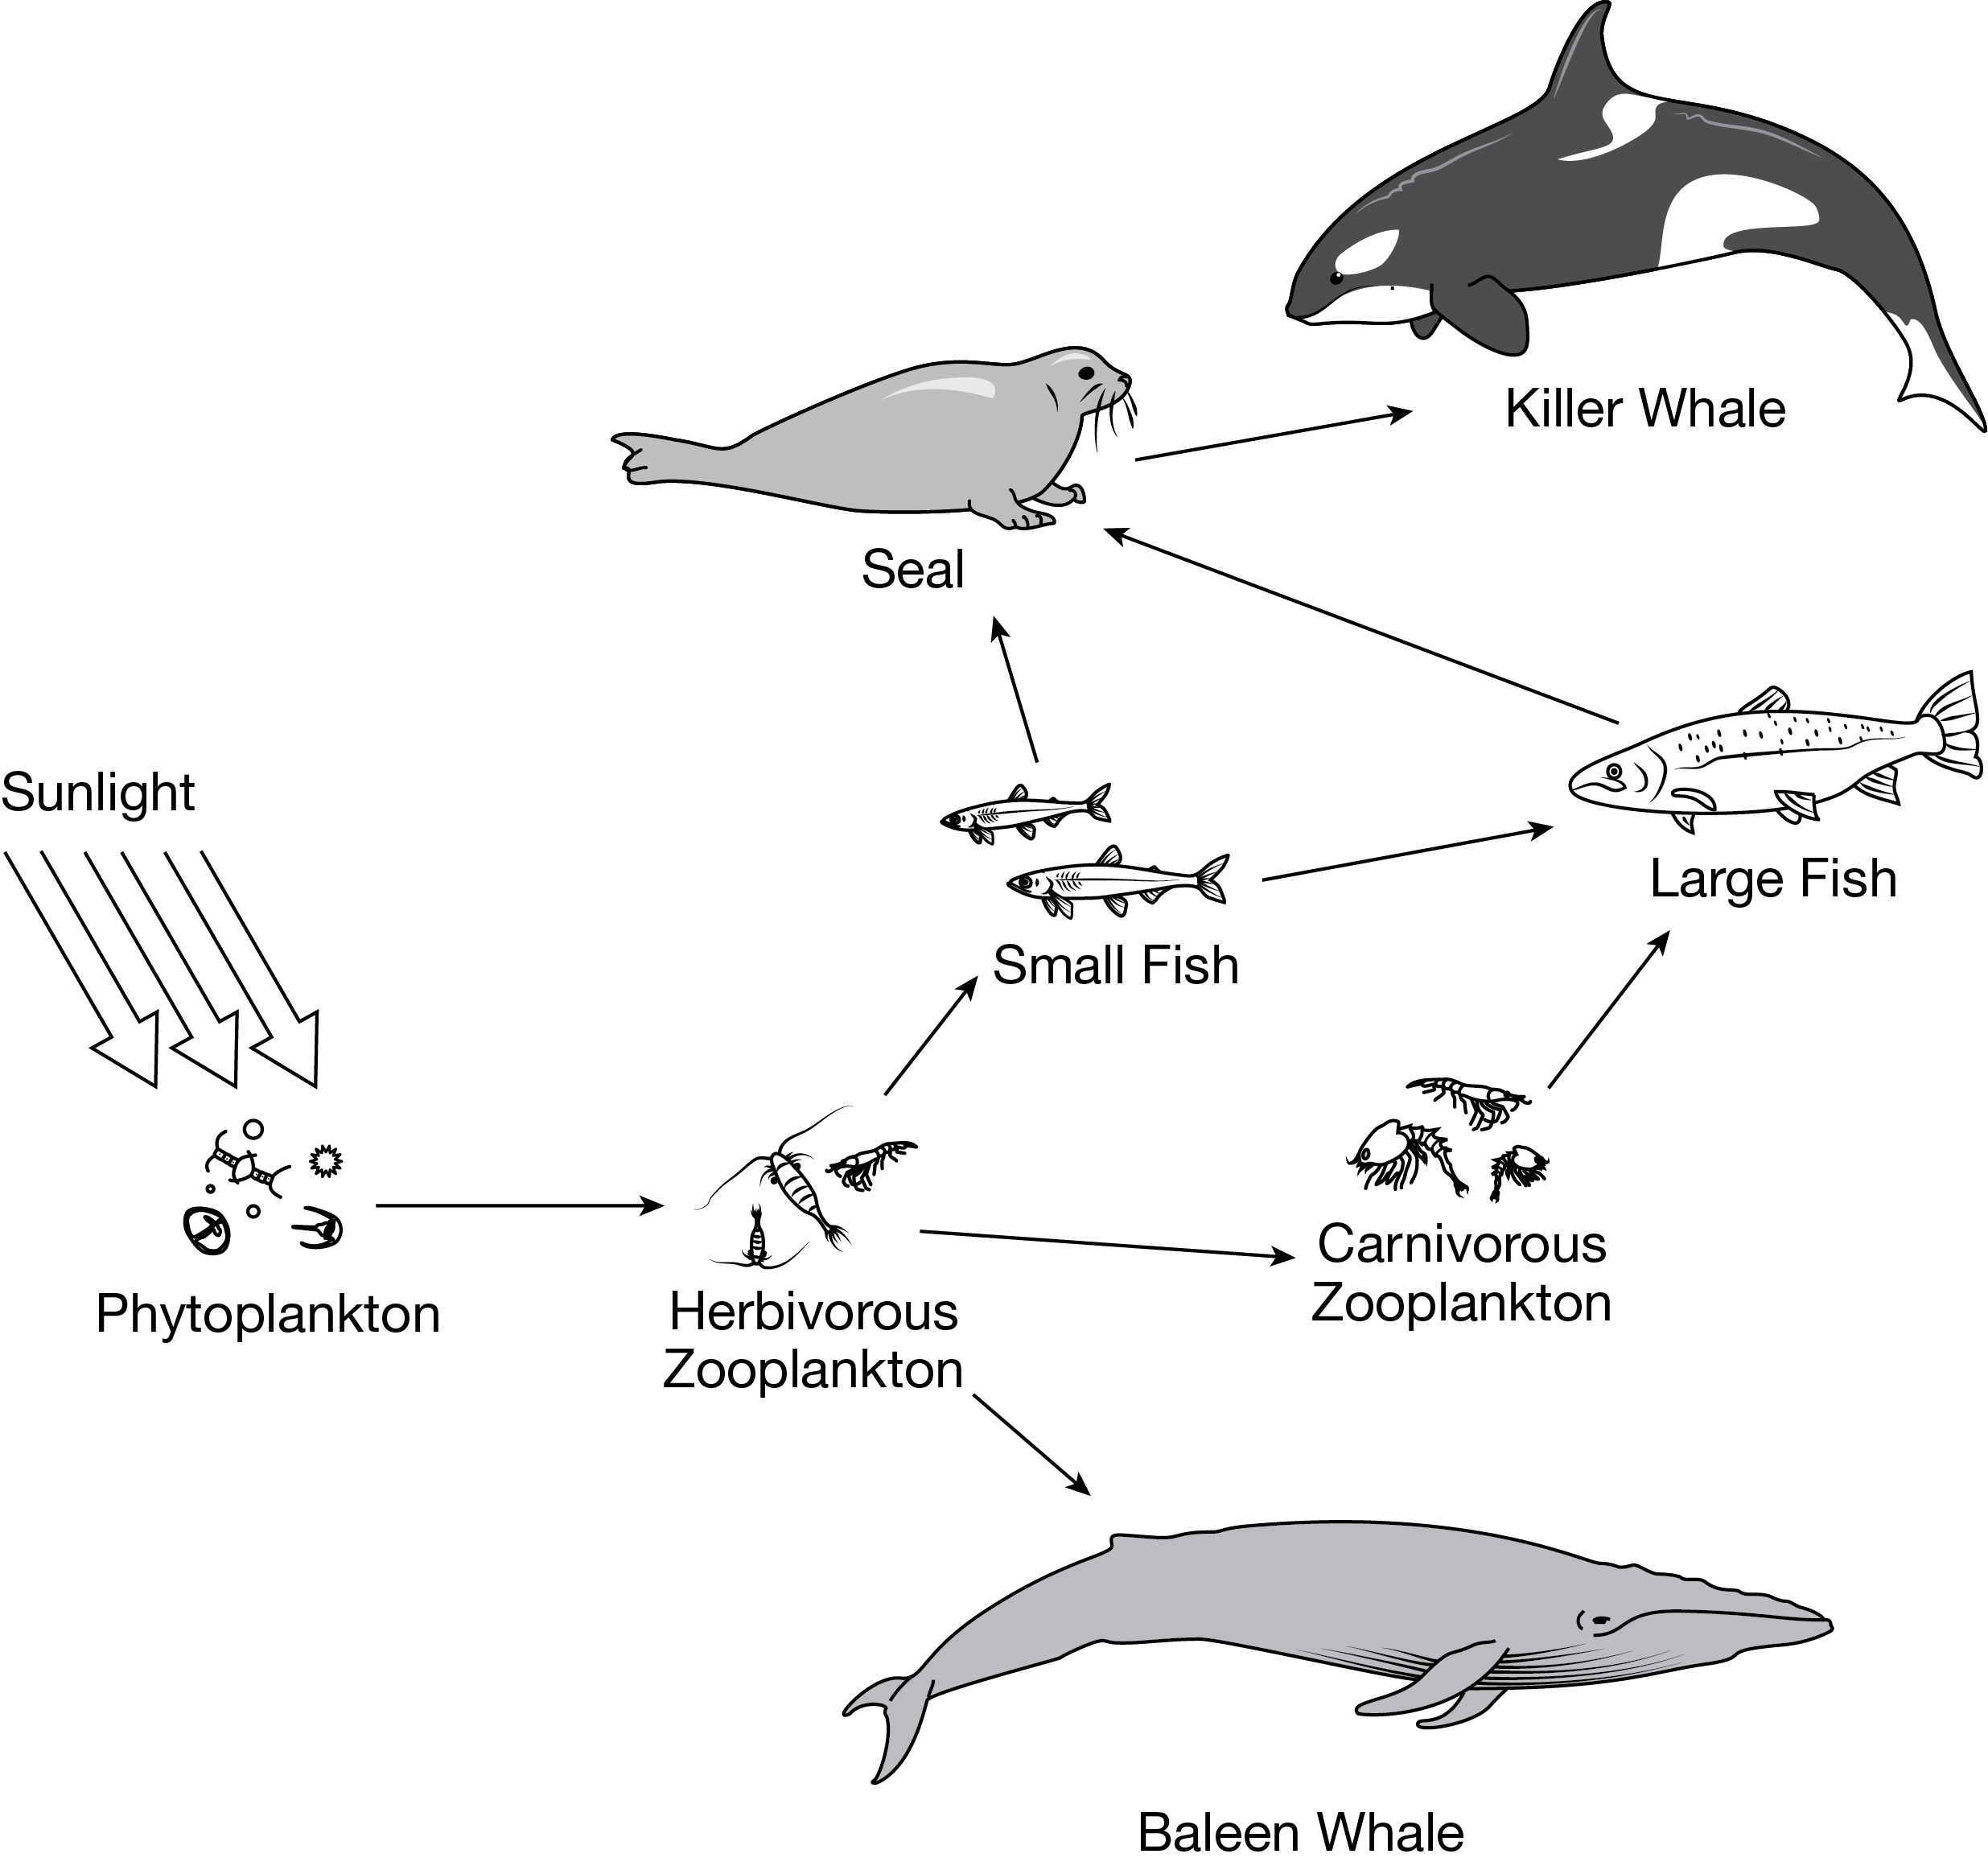
Which trophic level has the least available energy in kilojoules in this food web?
A. Phytoplankton
B. Herbivorous zooplankton
C. Baleen whale
D. Killer whale
D. Killer whale
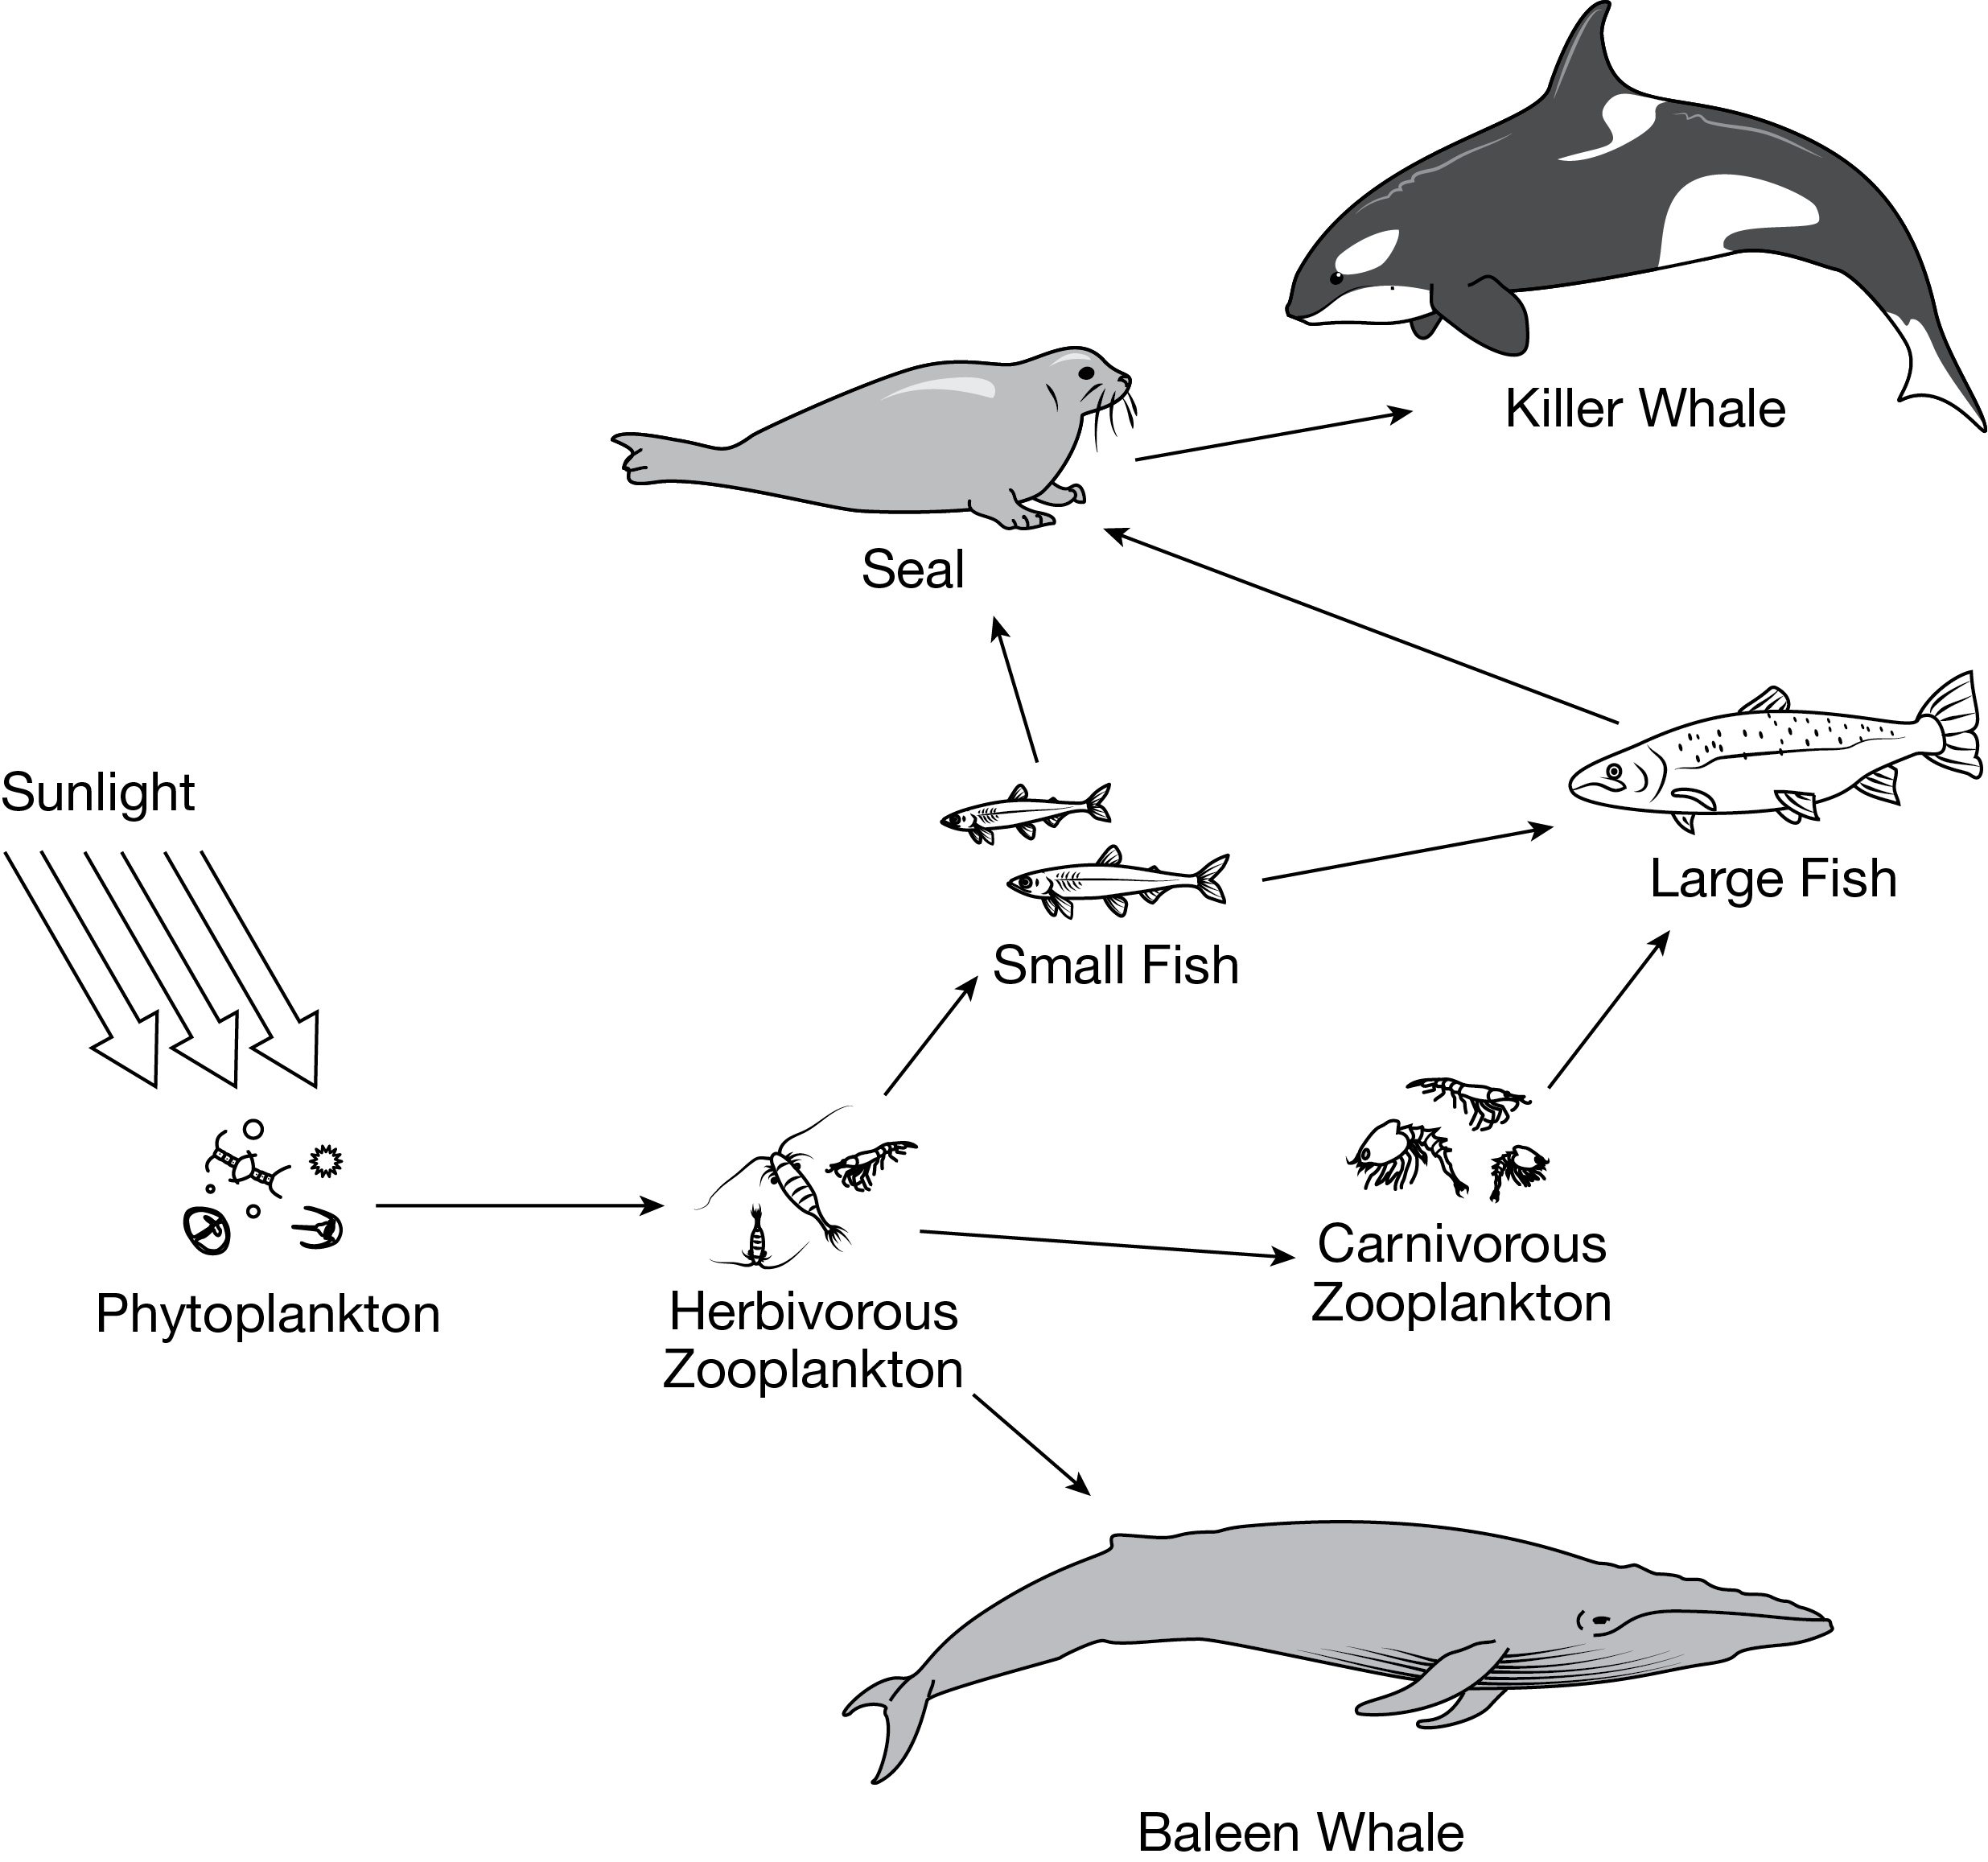
Based on the second law of thermodynamics, how much biomass of phytoplankton would be needed to produce 1 kilogram (kg) of large fish in this food web?
Responses
A. 1g
B. 10g
C. 100kg
D. 1000kg
D. 1000kg
Six white-tailed deer and six sika deer were enclosed in a pasture for observation during an eight-year study in central Texas. White-tailed deer are a native species to central Texas, while sika deer are a nonnative species to central Texas. White-tailed deer feed on flowering plants and the tips of trees and shrubs but do not eat grass. Sika deer feed on flowering plants, the tips of trees and shrubs, and grass. All other grazing animals were kept out of the pasture during the study. The number of sika deer more than doubled after the eight years, while the population of white-tailed deer decreased by 50 percent.
Which of the following statements best supports the results from the study?
A. The sika deer are generalists, while the white-tailed deer are specialists.
B. The sika deer out competed the white-tailed deer in consuming flowering plants and shrubs.
C. Parasites infected the sika deer population but did not infect the white-tailed deer population.
D. Change in the local climate reduced the availability of food resources for the white-tailed deer population.
B. The sika deer out competed the white-tailed deer in consuming flowering plants and shrubs.
In reef ecosystems, corals often have microalgae living inside them. The algae supply the corals with nutrients, and the coral give shelter to the algae. Which of the following interactions best describes the relationship between the corals and the algae?
A. Competition
B. Predation
C. Mutualism
D. Parasitism
C. Mutualism
Which of the following best describes an example of resource partitioning in an ecosystem?
A. Two different bird species feed from the same oak tree; one eats acorns, and the other eats insects in the bark.
B. A tick uses a white-tailed deer as its host, consuming the deer’s blood as food.
C. Two individuals from the same population of barn owls hunt for the same species of mouse during the night.
D. A mason bee pollinates a variety of flowers in a botanical garden.
A. Two different bird species feed from the same oak tree; one eats acorns, and the other eats insects in the bark.
Which of the following describes the most likely change to terrestrial biomes resulting from warmer average global temperatures?
A. The global distribution of midlatitude biomes, such as grasslands and temperate rain forests, would increase.
B. Deciduous trees found in temperate seasonal forests would flower later in the year.
C. The latitude range of tropical rain forests would narrow closer to the equator.
D. High-latitude biomes, such as the tundra, would experience a decrease in net primary productivity.
A. The global distribution of midlatitude biomes, such as grasslands and temperate rain forests, would increase.
Which of the following terrestrial biomes has the highest net primary productivity?
A. Desert
B. Tropical rain forest
C. Taiga
D. Savanna
B. Tropical rain forest
Which of the following terrestrial biomes has the highest primary productivity per unit area?
A. Desert
B. Tropical rain forest
C. Boreal forest
D. Savanna
B. Tropical rain forest
This biome contains a nutrient-rich environment created by falling leaves and trapped organic materials from the large trees, and it provides the ecosystem service of filtering pollutants from water.
A. Coral reefs
B. Freshwater wetlands
C. Open ocean
D. Rivers
B. Freshwater wetlands
This biome is found in shallow waters off the coastline and is Earth’s most biologically diverse marine biome.
A. Coral reefs
B. Freshwater wetlands
C. Open ocean
D. Rivers
A. Coral reefs
This freshwater biome is characterized by fast-flowing water that can originate from underground springs or runoff, which carries sediment and organic material.
A. Coral reefs
B. Freshwater wetlands
C. Open ocean
D. Rivers
D. Rivers
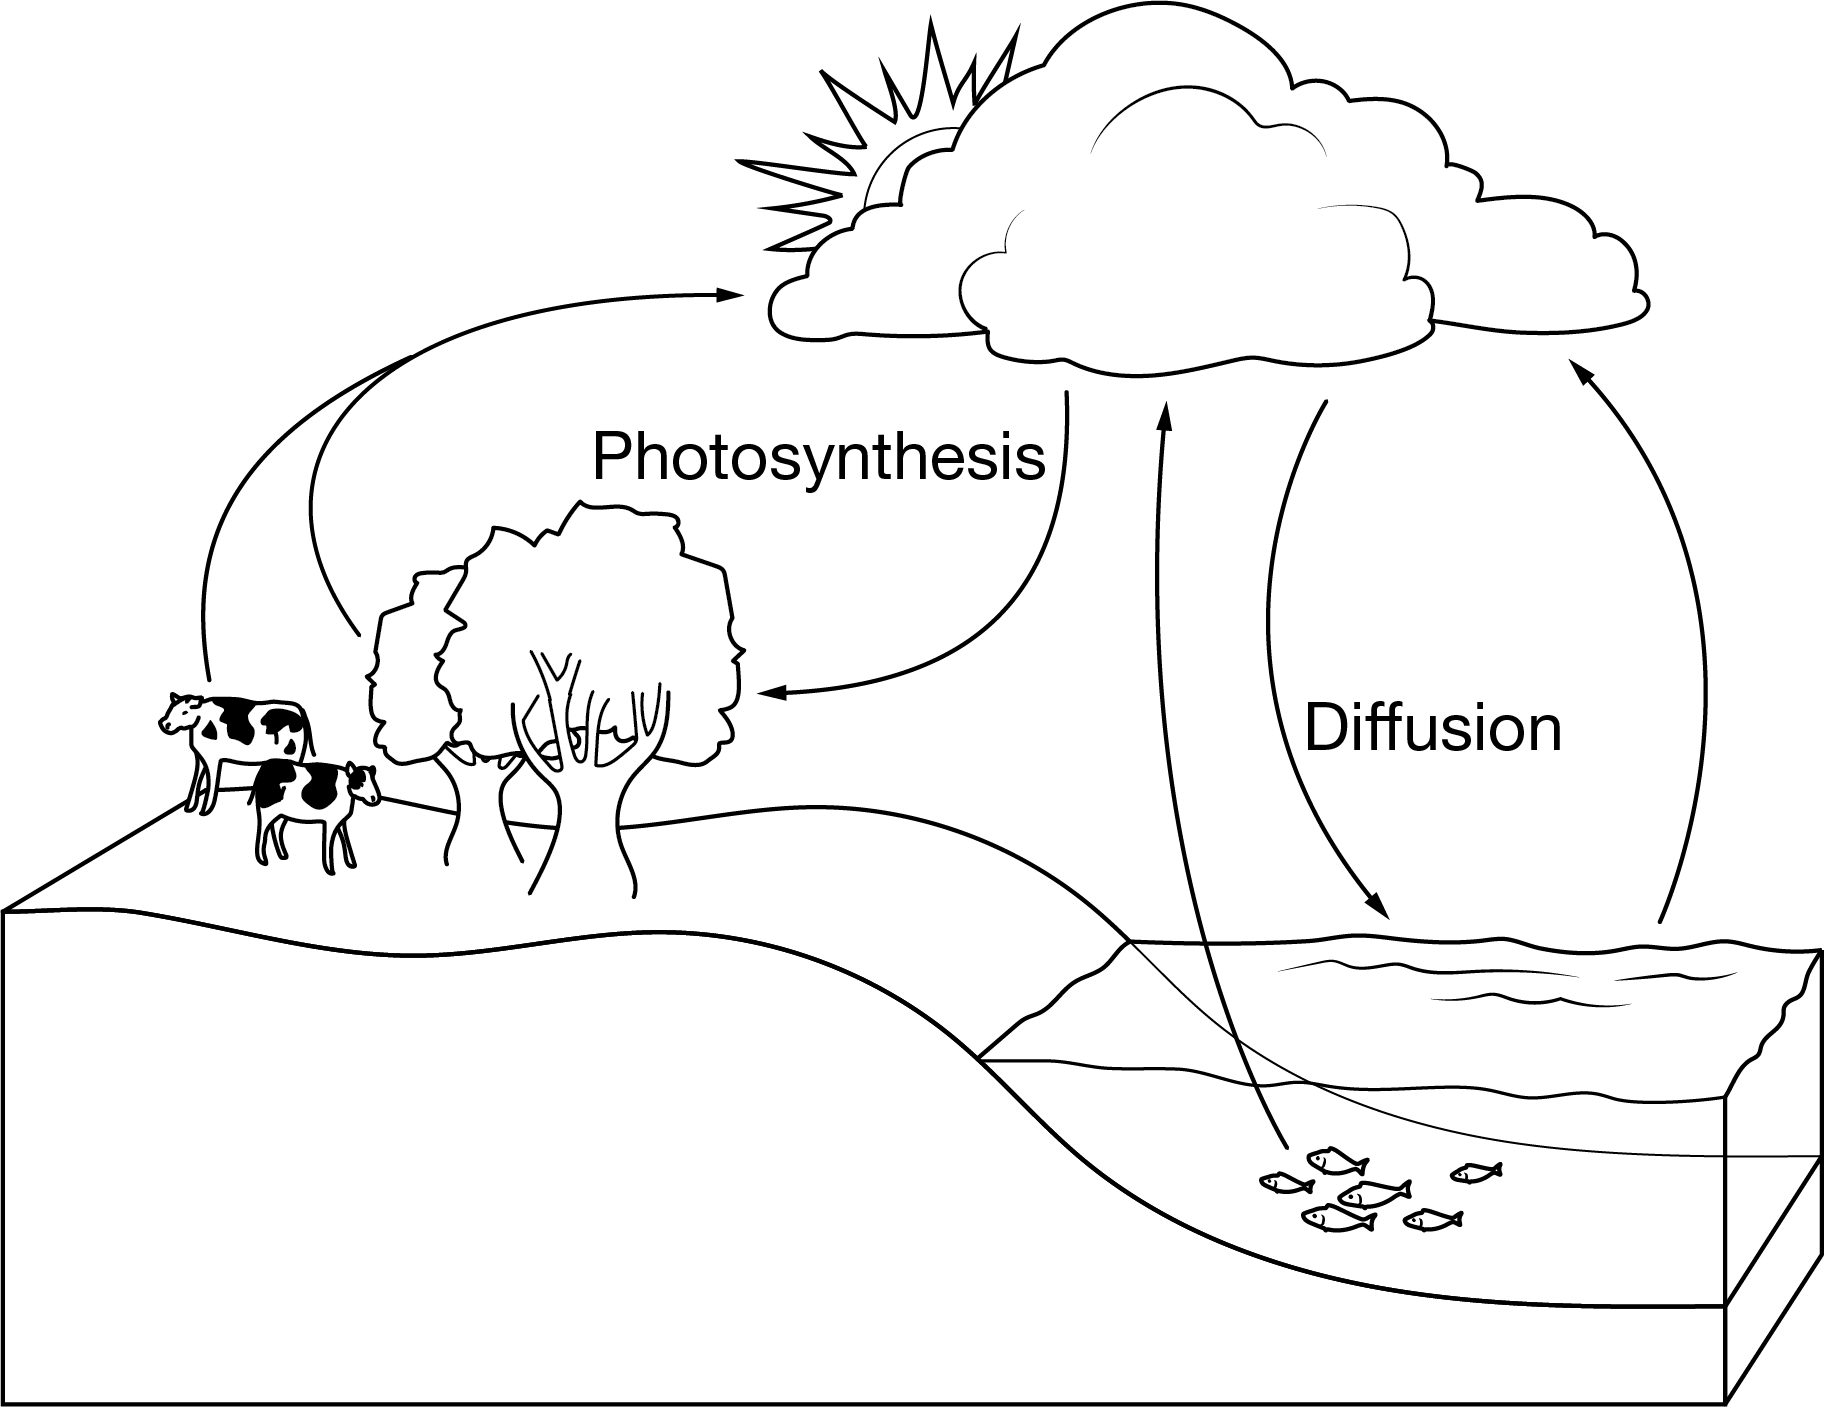
Which of the following biogeochemical cycles includes the processes of buffering ocean 𝑝𝐻 and photosynthesis, as shown in the diagram?
A. The carbon cycle
B. The nitrogen cycle
C. The phosphorus cycle
D. The potassium cycle
A. The carbon cycle
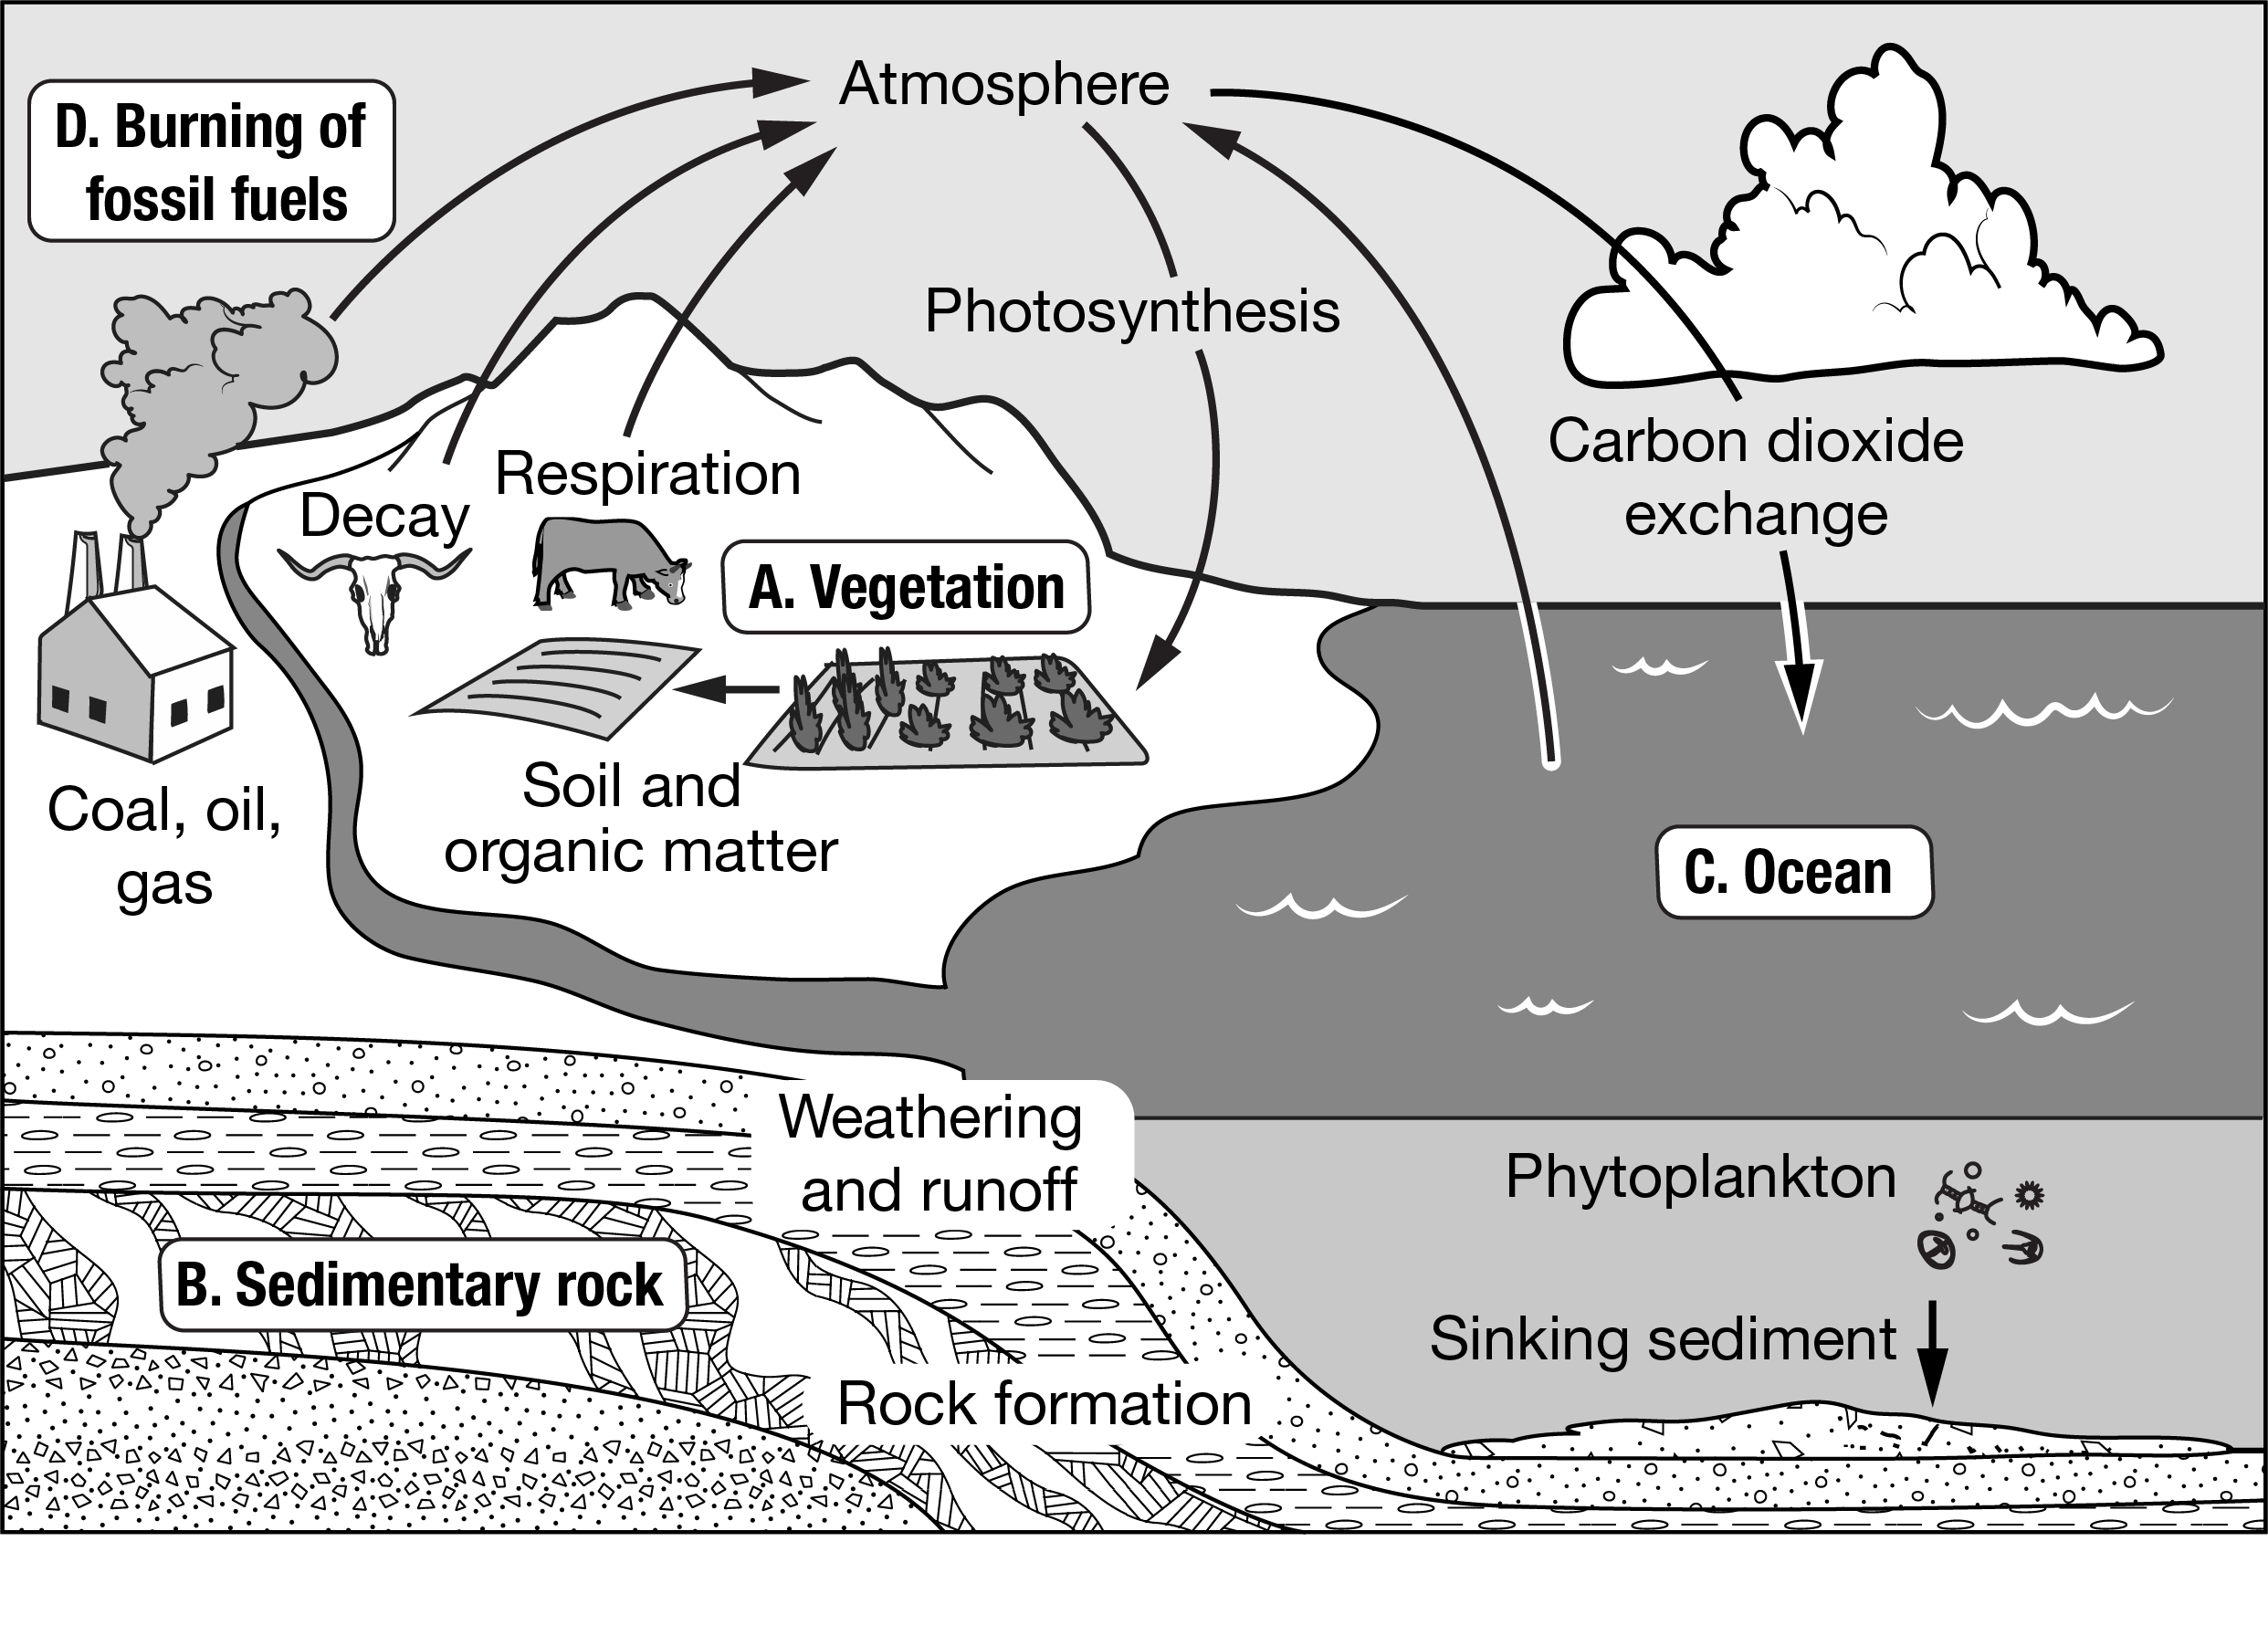
Which of the boxes represents a carbon source?
A. A
B. B
C. C
D. D
D. D
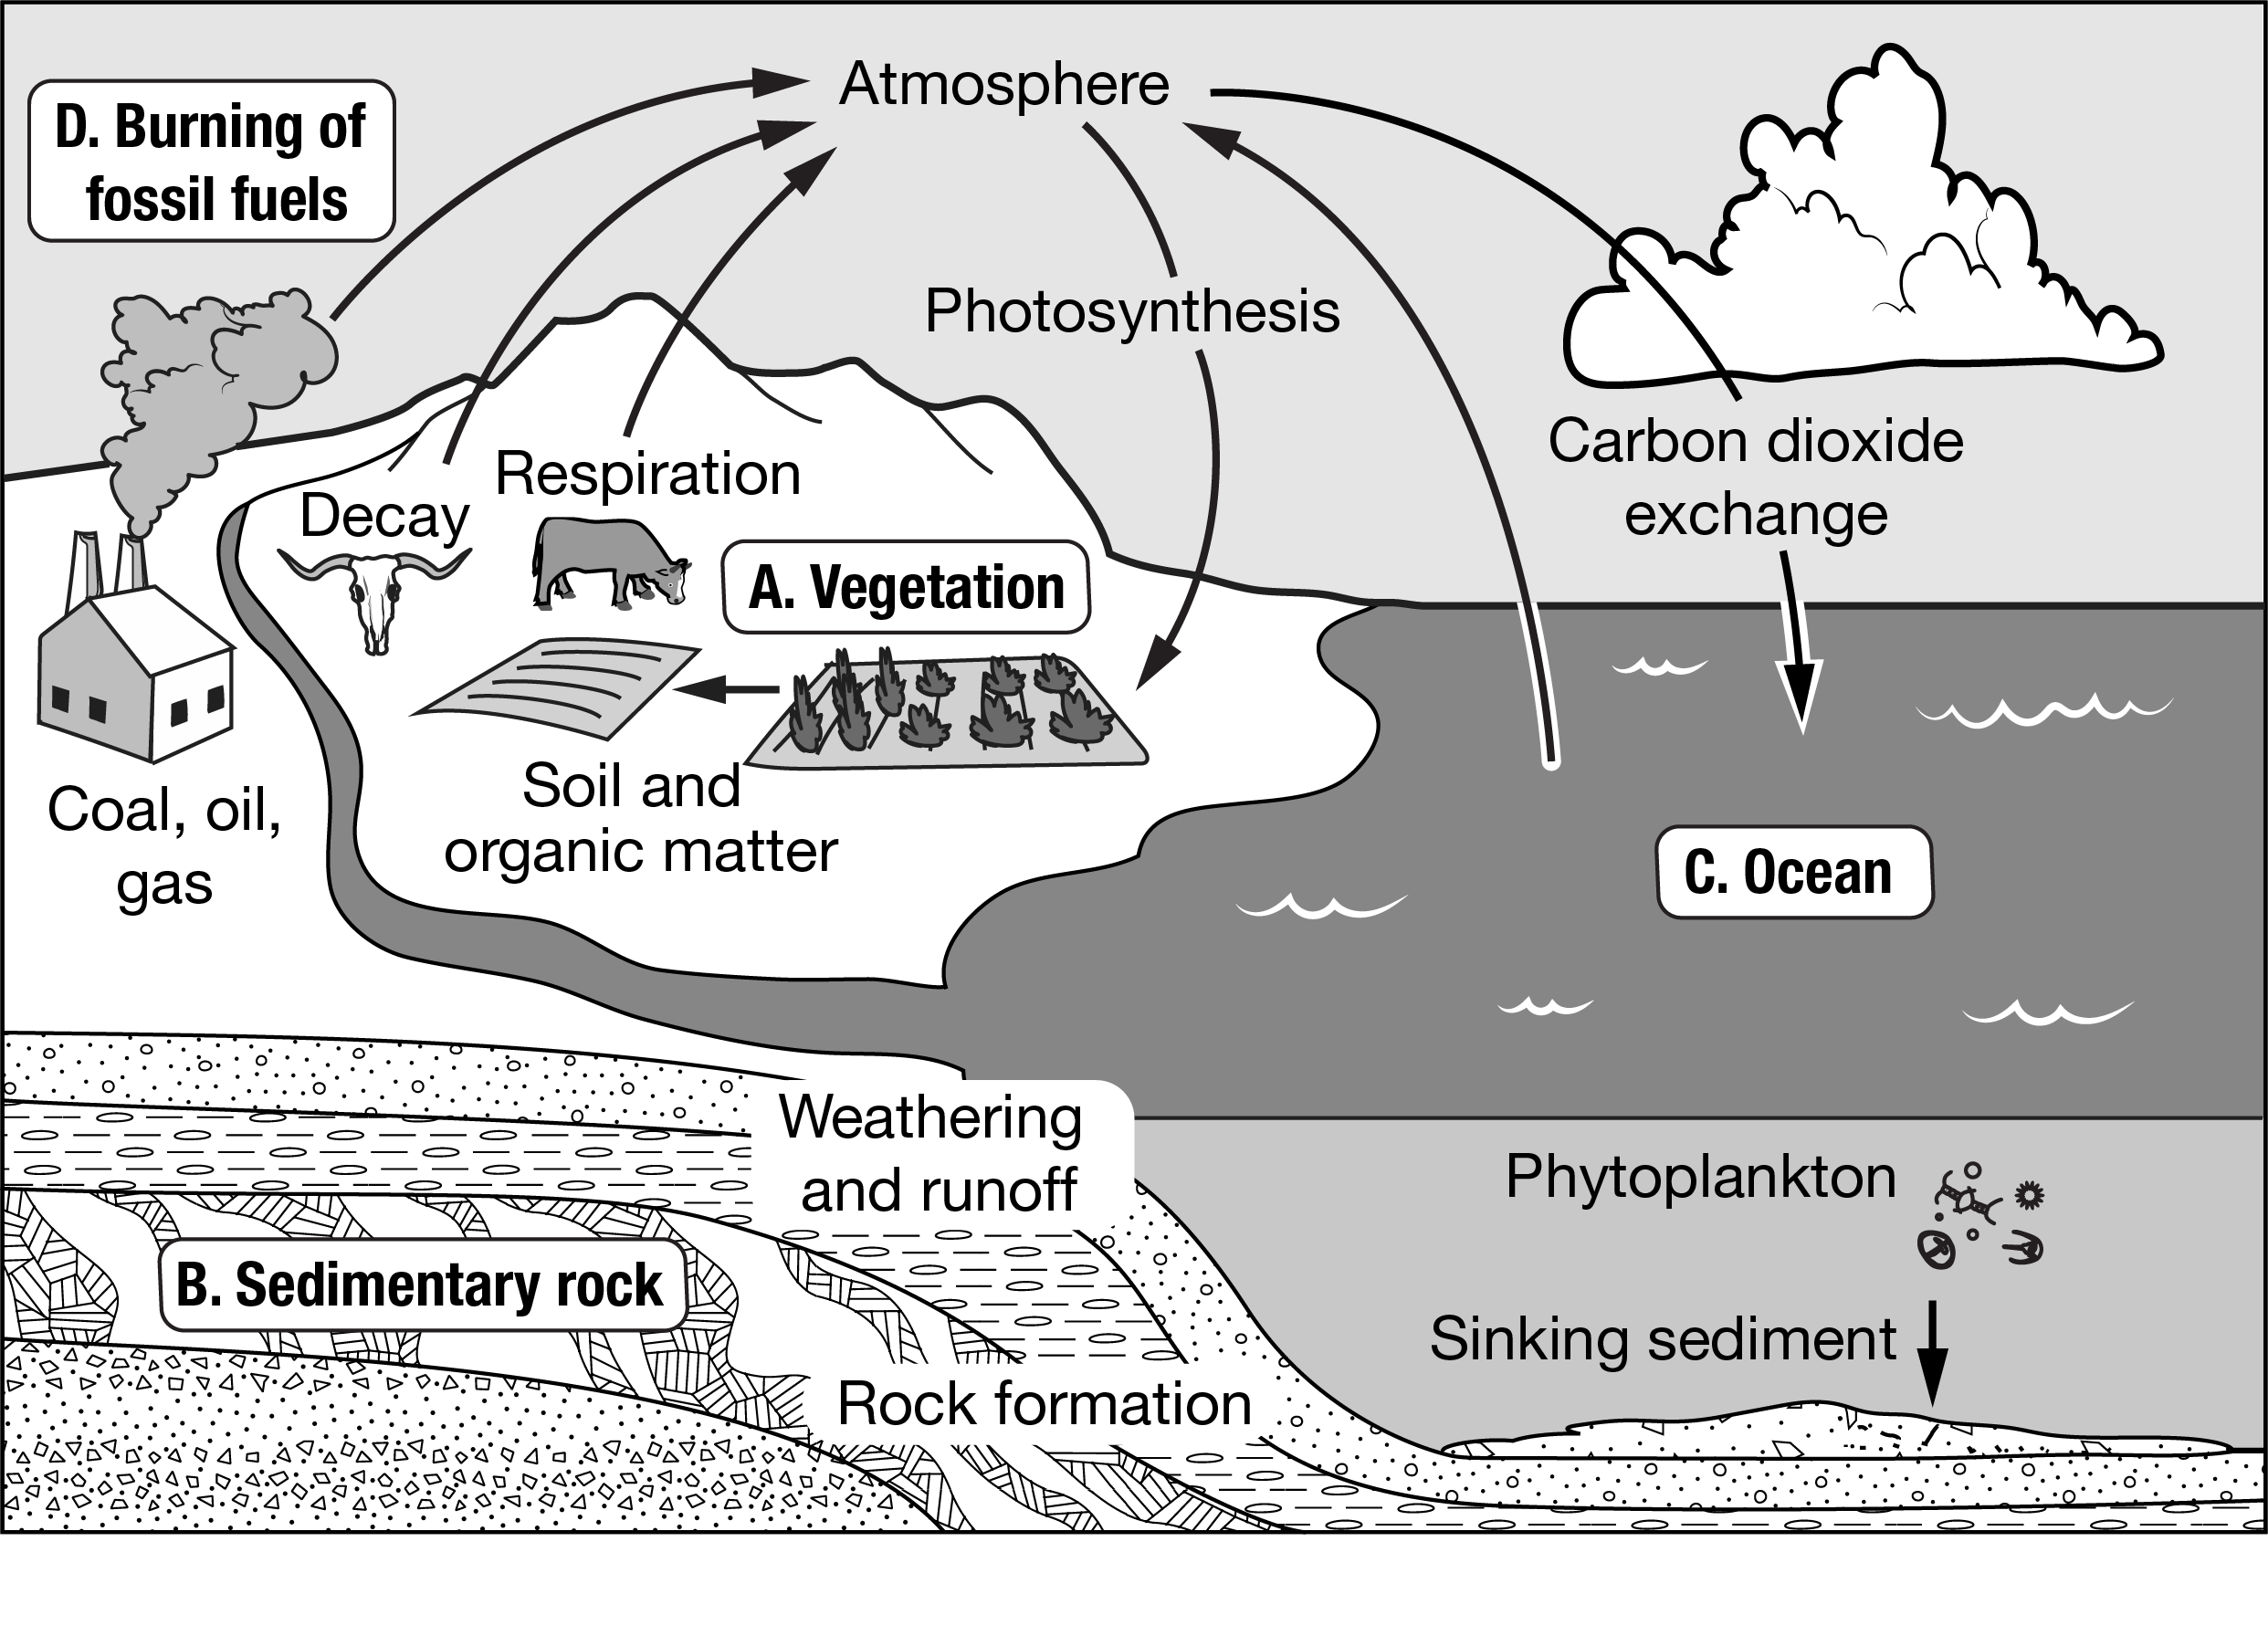
Which box represents a carbon sink that holds carbon compounds for the shortest period of time?
A. A
B. B
C. C
D. D
A. A
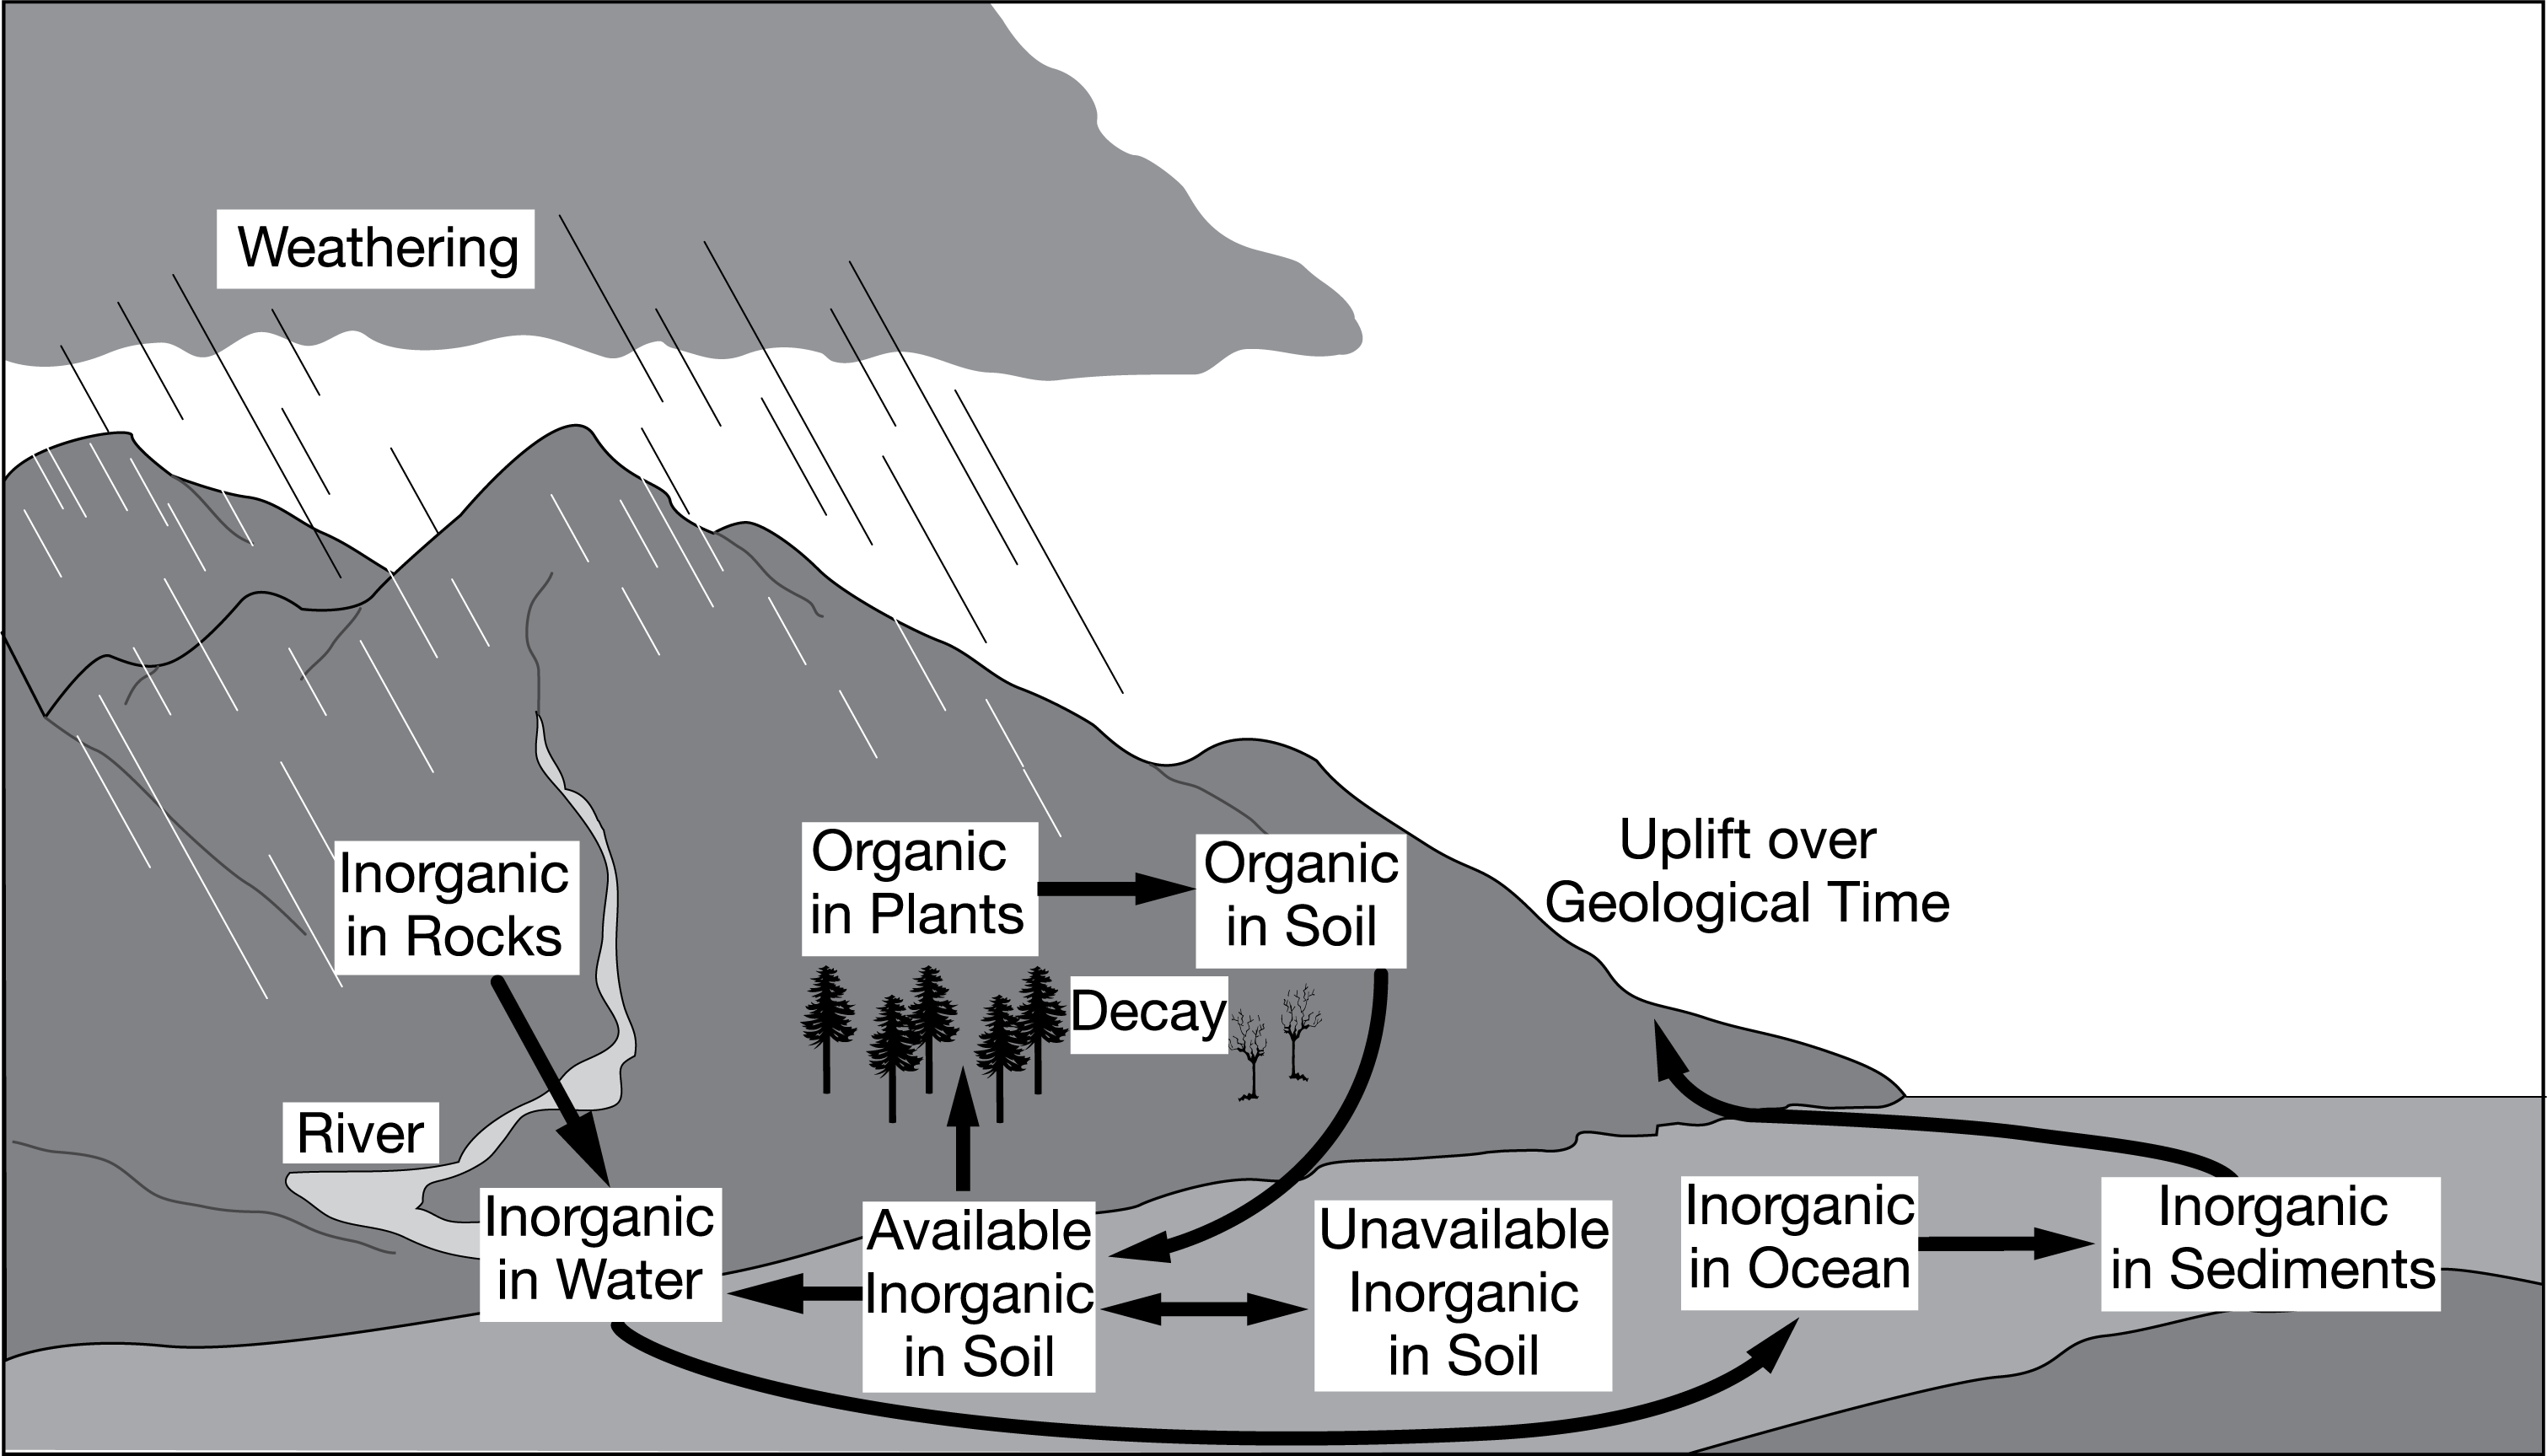
The diagram above best illustrates major processes in which of the following biogeochemical cycles?
A. The carbon cycle
B. The nitrogen cycle
C. The phosphorus cycle
D. The water cycle
C. The phosphorus cycle
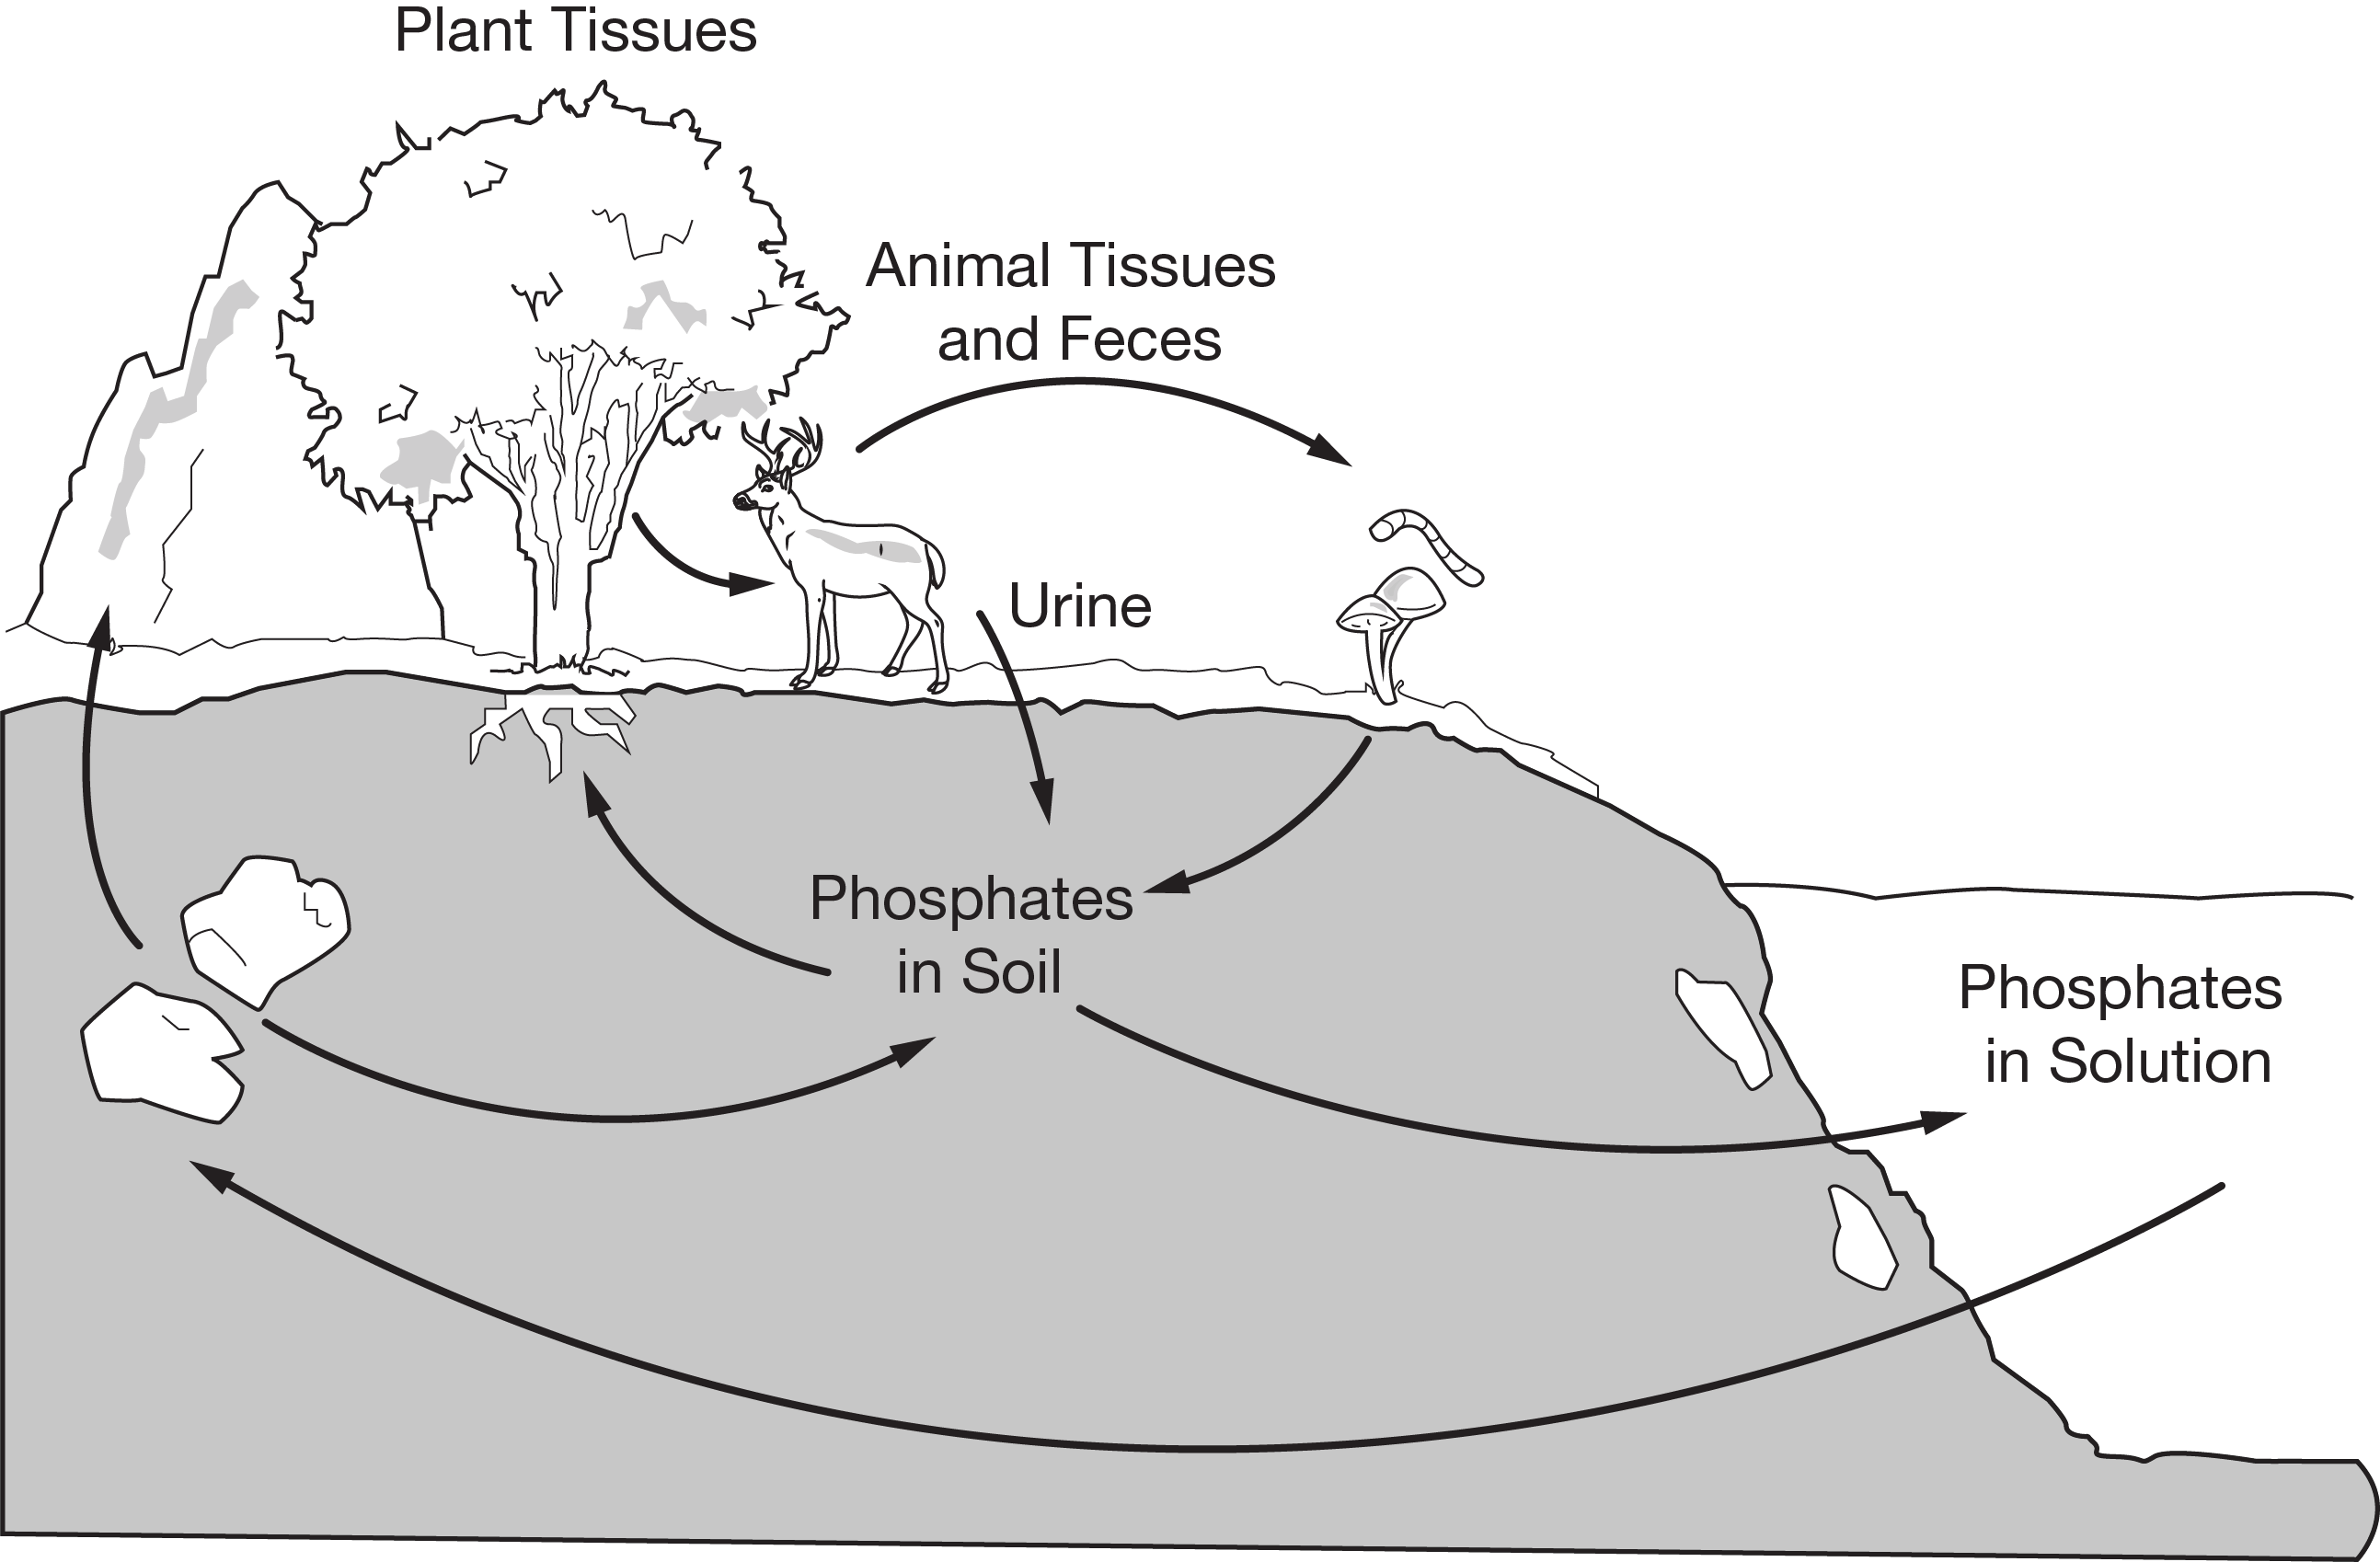
The diagram below represents steps in the phosphorus cycle.
Which of the following statements is best supported by the diagram of the phosphorus cycle?
A. The largest reservoir of phosphorus is in the atmosphere.
B. The phosphates absorbed by animal tissue through consumption eventually return to the soil.
C. Plants take up the phosphate ions primarily from the metamorphic rocks.
D. Phosphates are not soluble in water.
B. The phosphates absorbed by animal tissue through consumption eventually return to the soil.
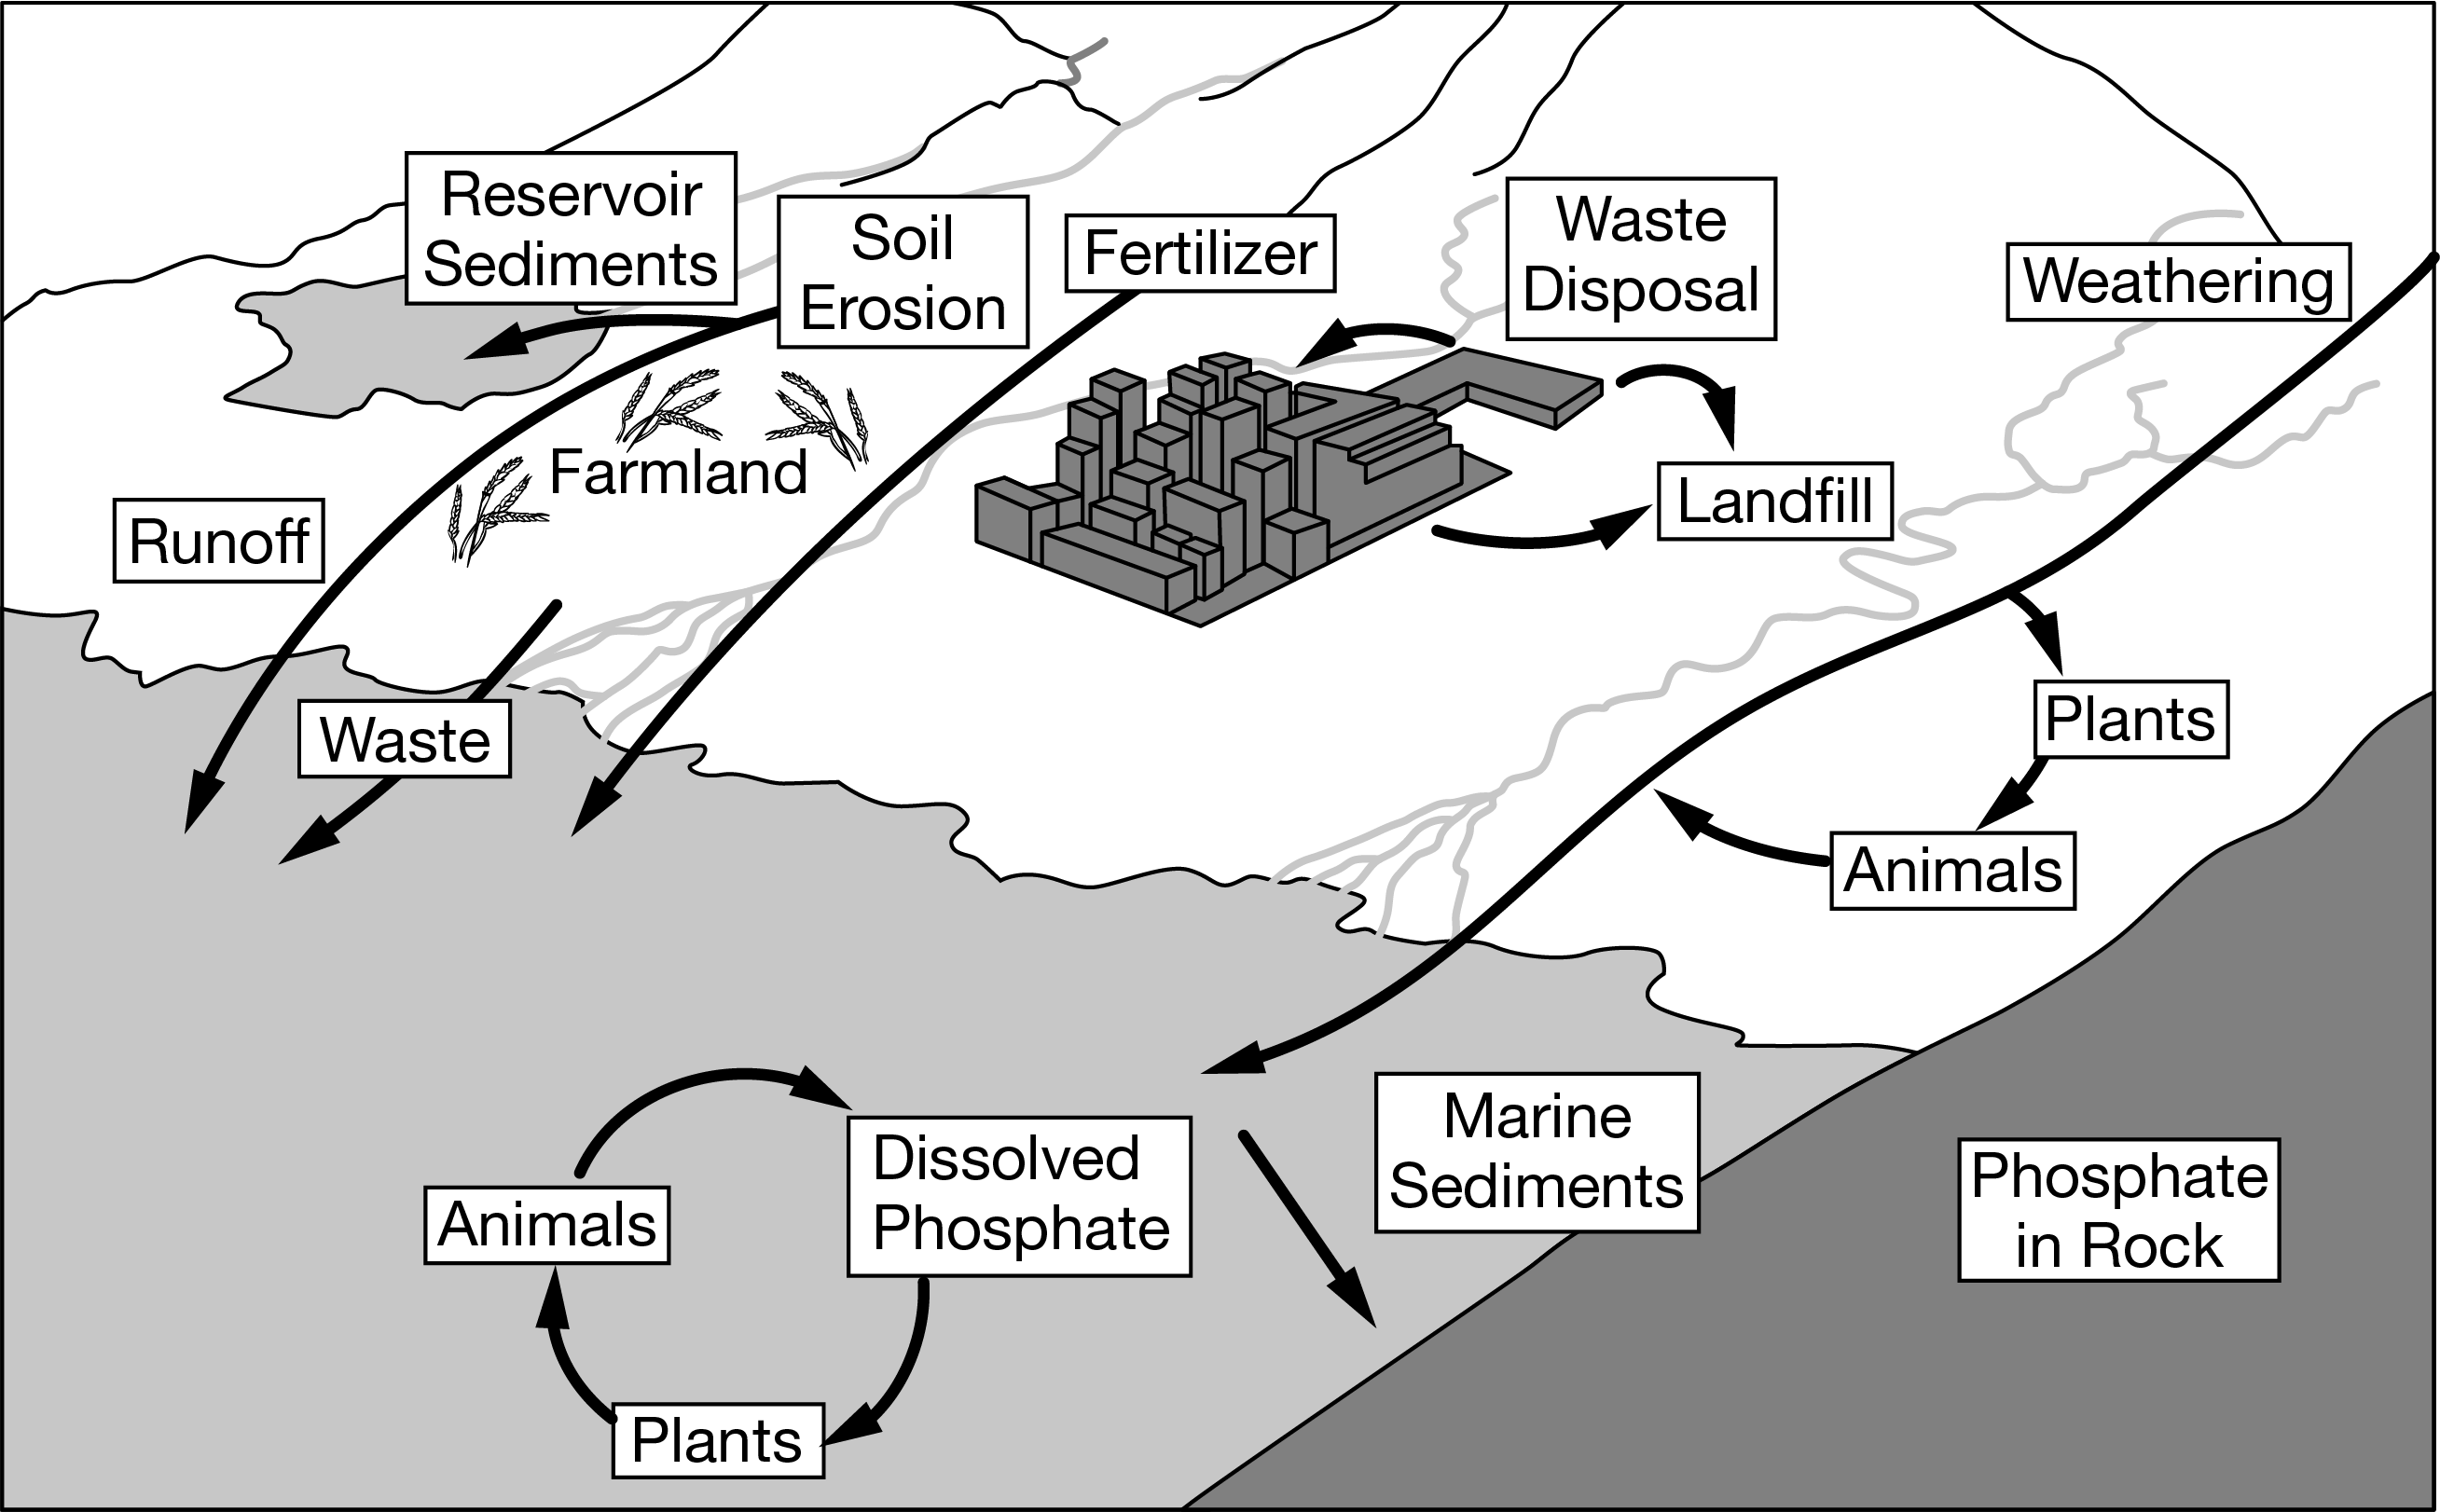
Farmers in a suburban coastal town started using no-till agriculture, a practice that reduces soil erosion from their farmland. Use the image above to determine which of the following long-term effects no-till agriculture will have on the ecosystem surrounding the farmland.
A. There will be an increased need for fertilizer on farmlands.
B. There will be less algal growth in the nearby ocean.
C. There will be less phosphorus pollution in the atmosphere.
D. There will be an increased deposition of phosphorus-rich sediments.
B. There will be less algal growth in the nearby ocean.
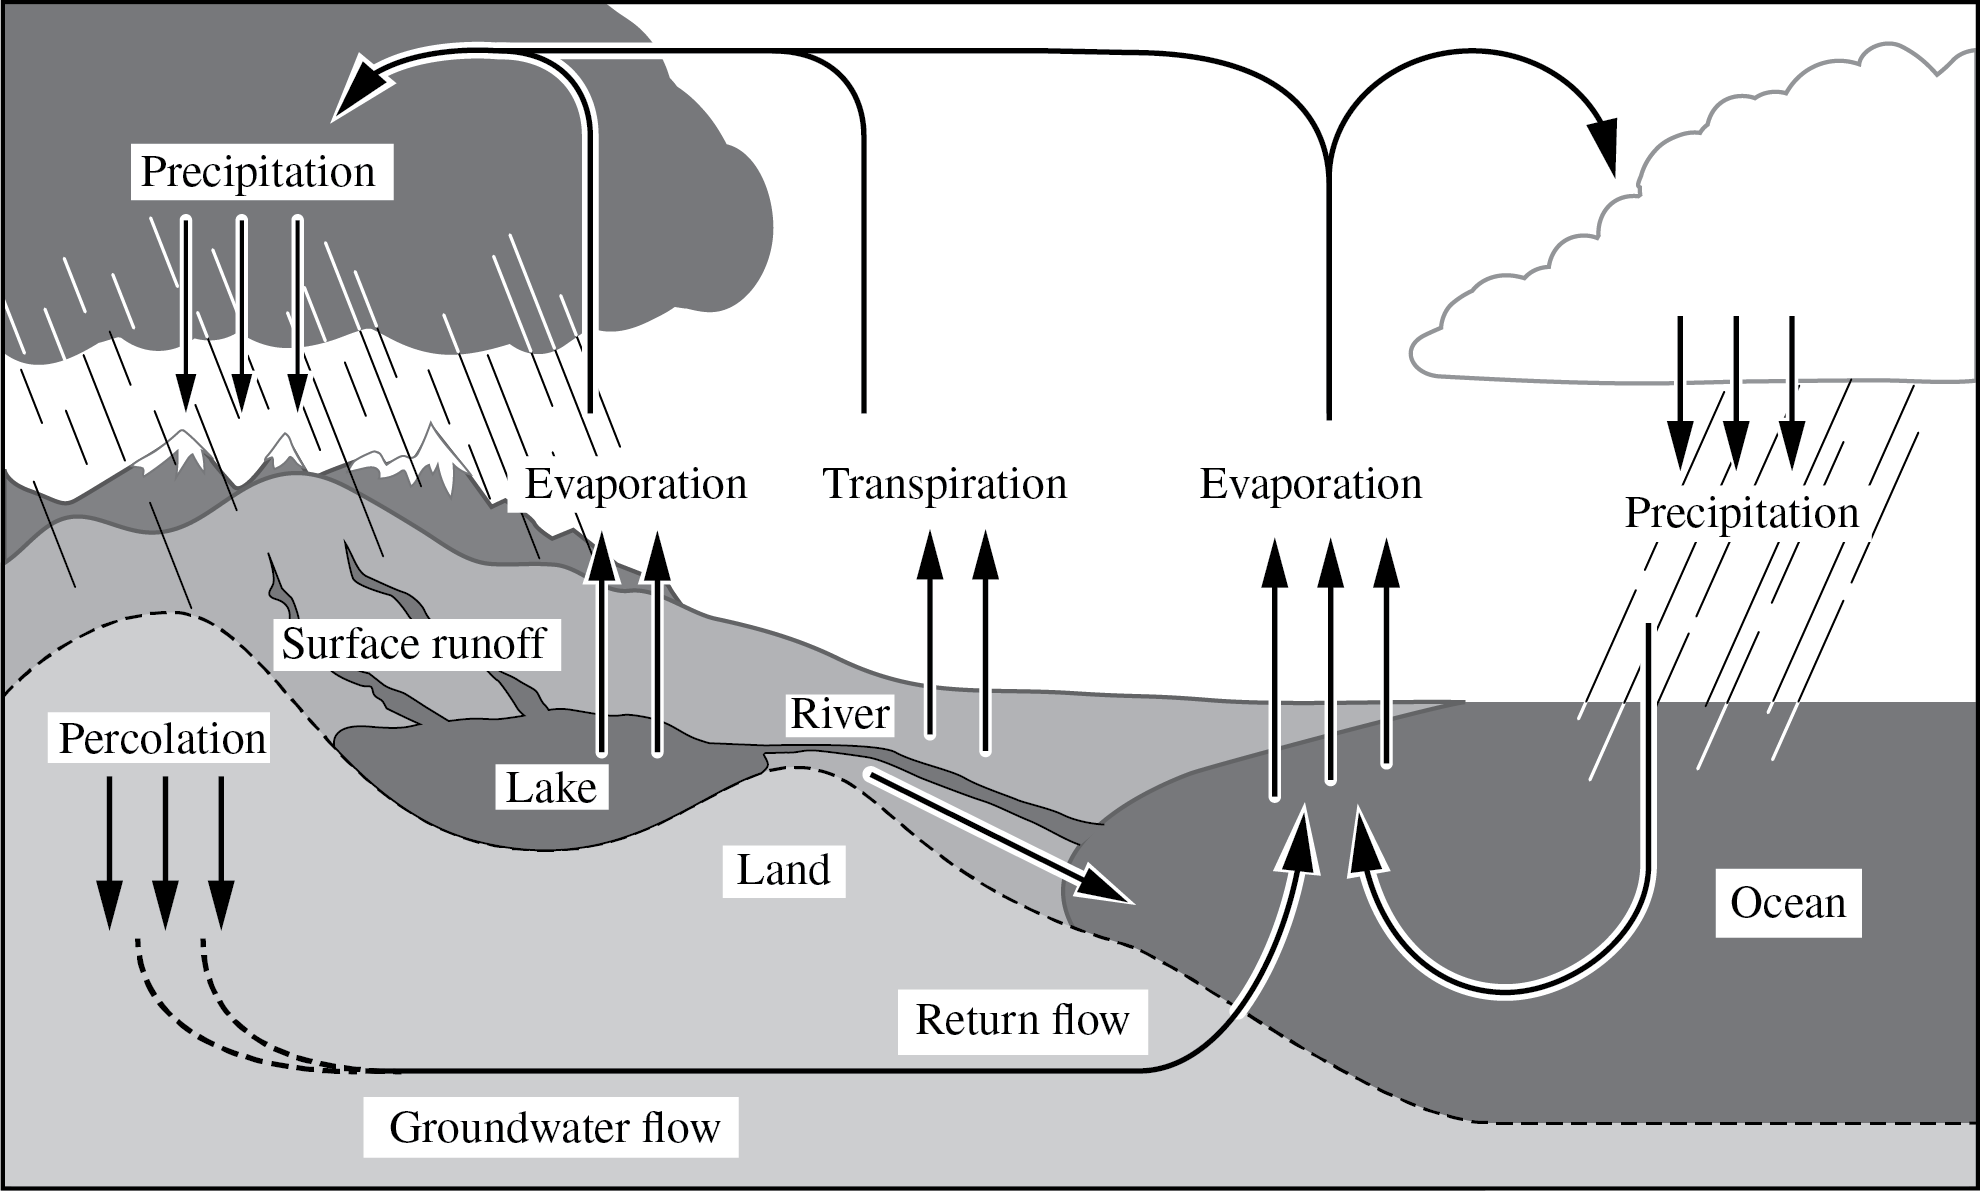
The diagram below shows a model of the global movement of water in the hydrologic cycle.
Based on the diagram, which of the following statements about the hydrologic cycle is true?
A. Water from the ocean evaporates and condenses in the atmosphere.
B. Surface runoff is the primary recharge of groundwater.
C. Infiltration of water into the ground prevents water from returning to the oceanic reservoir.
D. Evapotranspiration from plants decreases atmospheric water vapor.
A. Water from the ocean evaporates and condenses in the atmosphere.
The total rate of photosynthesis in a given area.
A. Primary productivity
B. Gross primary productivity
C. Net primary productivity
D. Cellular respiration
A. Primary productivity
This rate of reaction can be measured in the dark by determining the amount of oxygen gas consumed in a period of time.
A. Primary productivity
B. Gross primary productivity
C. Net primary productivity
D. Cellular respiration
D. Cellular respiration
The energy available to consumers determined by subtracting the energy used by plants from the total energy transformed by the process of photosynthesis.
A. Primary productivity
B. Gross primary productivity
C. Net primary productivity
D. Cellular respiration
C. Net primary productivity
Which of the following best describes the flow of energy in most terrestrial and near-surface marine ecosystems?
A. Decomposers break down dead or decaying organisms to release energy and nutrients to be used by producers.
B. Chemoautotrophs use inorganic energy sources, such as hydrogen sulfide, to create organic compounds from carbon dioxide.
C. Apex predators feed on other organisms, which releases heat that can be used by producers and primary consumers.
D. Producers use energy from the sun to make organic matter, such as sugars, from carbon dioxide and water and are then consumed by organisms higher in the food chain.
D. Producers use energy from the sun to make organic matter, such as sugars, from carbon dioxide and water and are then consumed by organisms higher in the food chain.
Which of the following best describes a terrestrial ecosystem that will have the highest net primary productivity?
A. Warm temperatures, high rainfall, and consistent sunlight
B. Hot temperatures, low rainfall, and consistent sunlight
C. Cold temperatures, high rainfall, and inconsistent sunlight
D. Warm temperatures, low rainfall, and inconsistent sunlight
A. Warm temperatures, high rainfall, and consistent sunlight
Which of the following trophic levels represents a primary producer in an aquatic food chain?
A. Phytoplankton
B. Herbivorous zooplankton
C. Carnivorous zooplankton
D. Baleen whale
A. Phytoplankton
A temperate grassland biome has a gross primary productivity of 3,480 kilocalories/meter²/year and net primary productivity of 2,000 kilocalories/meter²/year. Which of the following is the approximate number of kilocalories/meter²/year available to herbivores in that biome?
A. 200 kilocalories/meter²/year
B. 1,480 kilocalories/meter²/year
C. 2,000 kilocalories/meter²/year
D. 5,480 kilocalories/meter²/year
A. 200 kilocalories/meter²/year
Energy is transferred along food chains from one stage to the next. Which statement best explains how the energy is transferred?
A. If a primary consumer stores 100kcal of energy, then a secondary consumer that feeds on the primary consumer will also have 100kcal of energy available.
B. If a primary producer stores 10,000kcal of energy, then a tertiary consumer will have 10kcal of energy available.
C. If a primary producer stores 100,000kcal of energy, then a secondary consumer will have 10,000kcal of energy available.
D. If a secondary consumer stores 500kcal of energy, then a tertiary consumer that feeds on the secondary consumer will have 5,000kcal of energy available.
B. If a primary producer stores 10,000kcal of energy, then a tertiary consumer will have 10kcal of energy available.
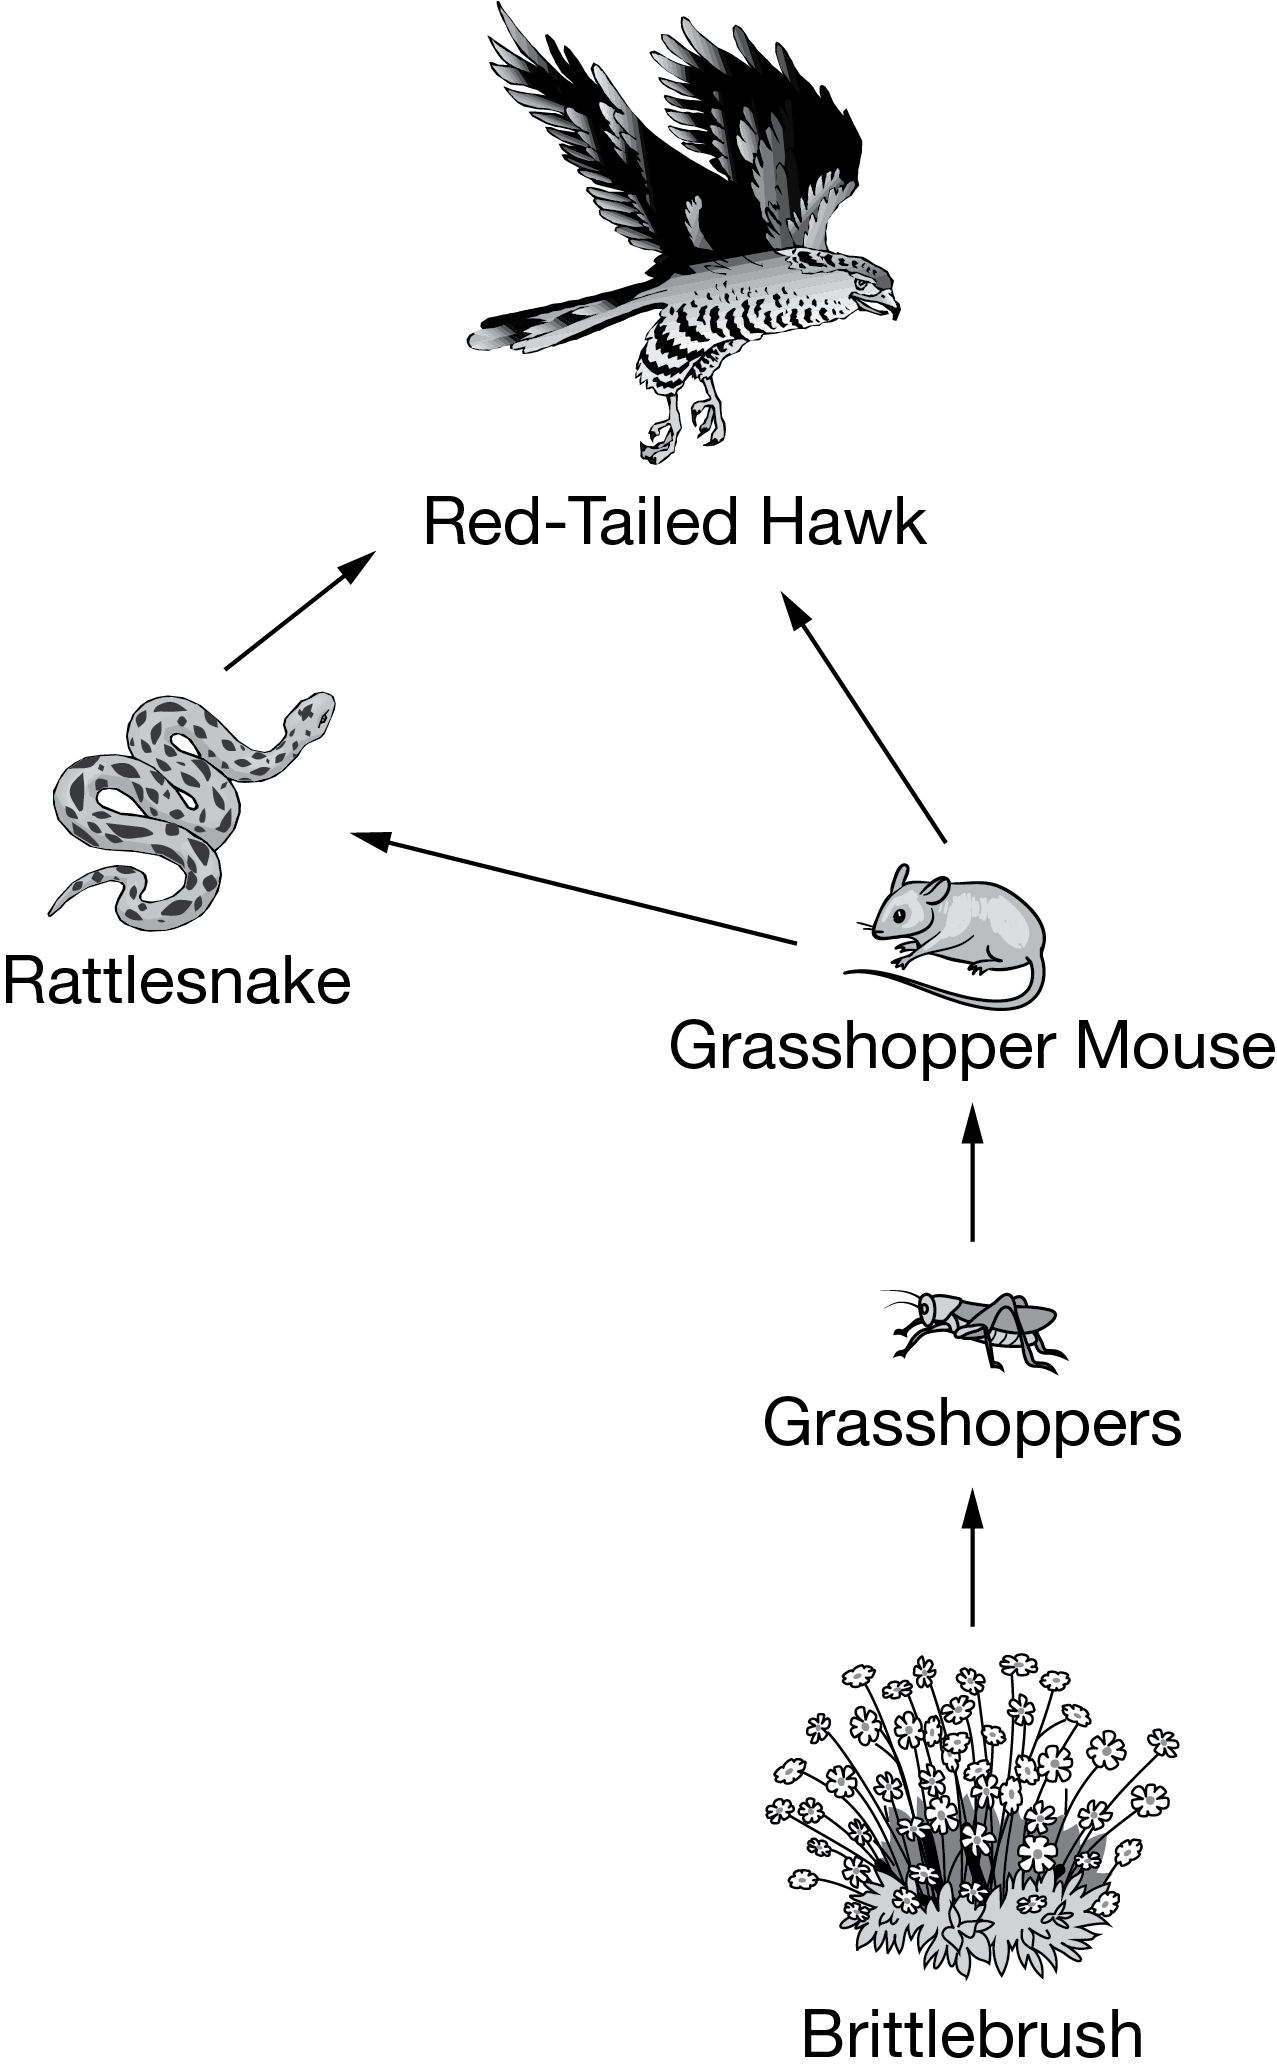
Based on the food web shown above, which of the following correctly describes the flow of energy through the trophic levels from producers to quaternary consumers?
A. Red-tailed hawk, grasshopper mouse, grasshopper, rattlesnake, brittlebrush
B. Red-tailed hawk, rattlesnake, grasshopper mouse, grasshopper, brittlebrush
C. Brittlebrush, grasshopper, grasshopper mouse, rattlesnake, red-tailed hawk
D. Brittlebrush, red-tailed hawk, rattlesnake, grasshopper mouse, grasshopper
C. Brittlebrush, grasshopper, grasshopper mouse, rattlesnake, red-tailed hawk
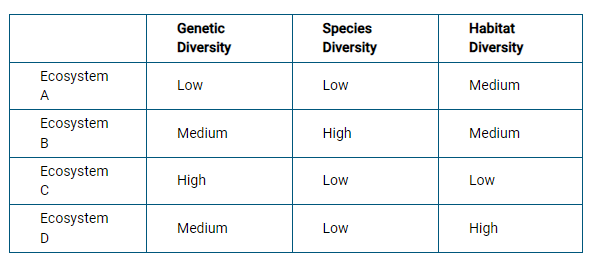
A team of ecologists are studying four different ecosystems with varying levels of biodiversity. The ecologists categorize the different levels of biodiversity for the four ecosystems as shown in the table below.
Based on the information above, which ecosystem would most likely recover the fastest from a natural disruption?
A. Ecosystem A
B. Ecosystem B
C. Ecosystem C
D. Ecosystem D
B. Ecosystem B
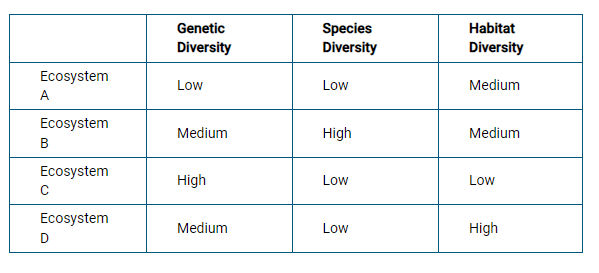
Based on the information above, which ecosystem most likely experienced a recent population bottleneck?
A. Ecosystem A, because its low genetic diversity could have resulted from an event that reduced the variation in the gene pool.
B. Ecosystem B, because its high species diversity could have resulted from increased competition among its members.
C. Ecosystem C, because its low habitat diversity indicates an increase in available niches.
D. Ecosystem D, because its low species diversity indicates that it also has low species evenness.
A. Ecosystem A, because its low genetic diversity could have resulted from an event that reduced the variation in the gene pool.
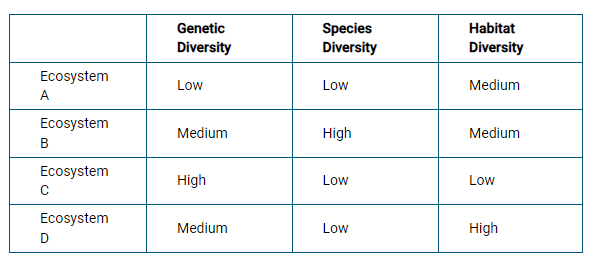
Based on the information above, which of the following best describes Ecosystem C?
A. Its low species diversity indicates that Ecosystem C most likely has species with very low population sizes.
B. Its high genetic diversity indicates that Ecosystem C most likely has species that evolve quickly.
C. Its high genetic diversity indicates that Ecosystem C is most likely the result of the founder effect and a subpopulation originating from Ecosystem A.
D. Its low habitat diversity indicates that Ecosystem C most likely has a low number of specialist species and few species that utilize large territories.
D. Its low habitat diversity indicates that Ecosystem C most likely has a low number of specialist species and few species that utilize large territories.
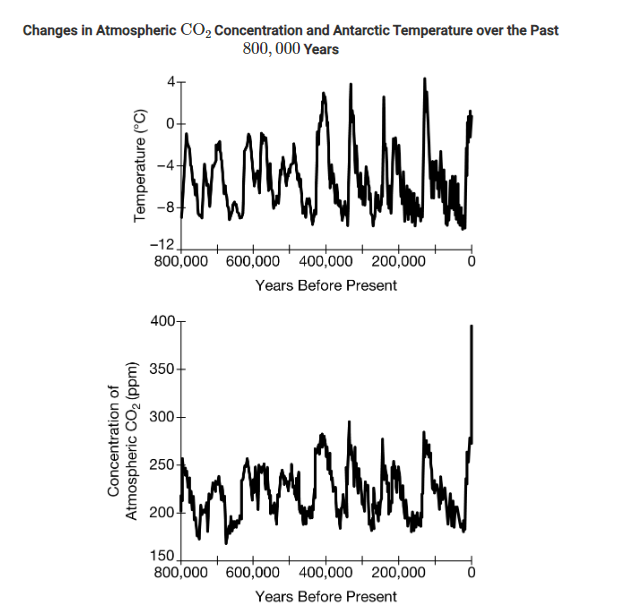
Which of the following best describes the change in Antarctic temperature from about 440,000 years ago to about 340,000 years ago?
A. The temperature increases by about 10°C.
B. The temperature decreases by about 8°C.
C. The temperature increases by about 12°C and then decreases by about 12°C.
D. The temperature decreases by about 10°C and then increases by about 12°C.
C. The temperature increases by about 12°C and then decreases by about 12°C.
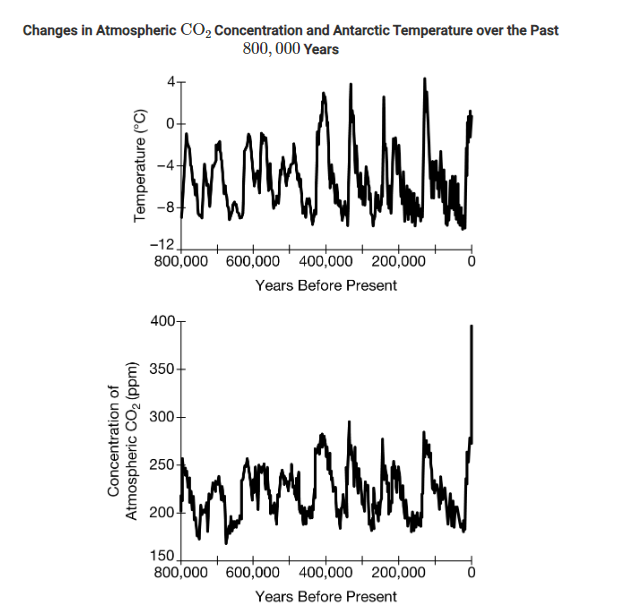
Which of the following best describes the pattern in the atmospheric CO2 concentration data over the past 200,000 years?
A. The concentration of CO2 fluctuated between 150ppm and 250ppm.
B. The concentration of CO2 fluctuated between 150ppm and 250ppm until recently, when the concentration rose exponentially.
C. The concentration of CO2 remained constant at first from 200,000 years ago until 50,000 years ago, and then began a steady decline.
D. The concentration of CO2 rose exponentially to 400ppm and leveled off at carrying capacity.
B. The concentration of CO2 fluctuated between 150ppm and 250ppm until recently, when the concentration rose exponentially.
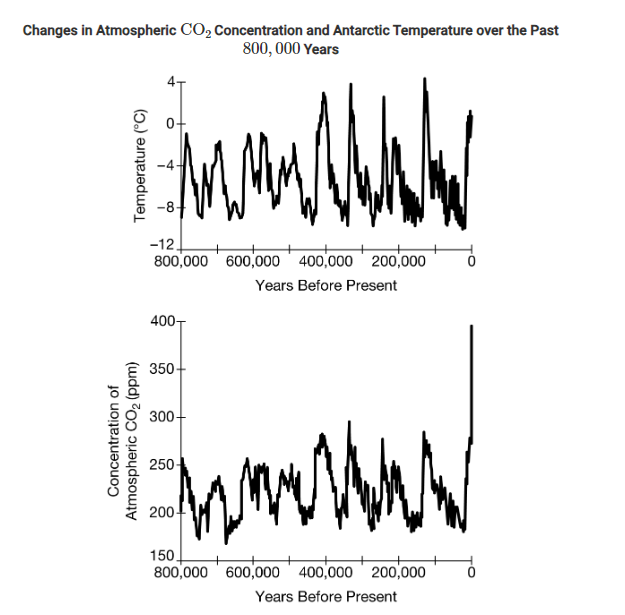
Which of the following best describes the trends in atmospheric CO2 concentration and Antarctic temperature over the past 800,000 years?
A. Atmospheric CO2 concentration has remained about the same, and Antarctic temperature has varied widely over the past 800,000 years.
B. Both atmospheric CO2 concentration and Antarctic temperature have remained about the same over the past 800,000 years.
C. Atmospheric CO2 concentration and Antarctic temperature are directly correlated over the past 800,000 years.
D. Atmospheric CO2 concentration and Antarctic temperature are inversely correlated over the past 800,000 years.
C. Atmospheric CO2 concentration and Antarctic temperature are directly correlated over the past 800,000 years.
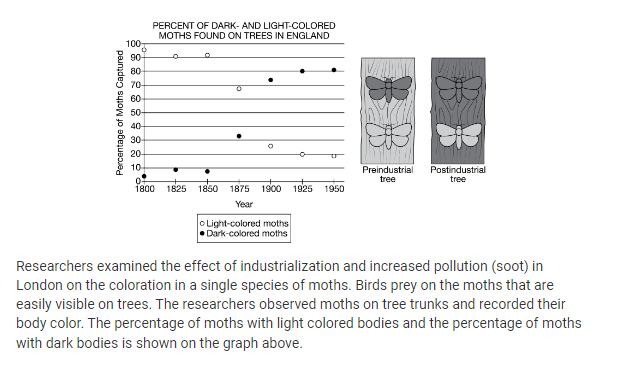
Based on the data in the graph, which of the following best describes the change in the population of moths as a result of industrialization?
A. The percentage of dark colored moths increased in the population and the percentage of light-colored moths decreased in the population.
B. The percentage of dark-colored moths decreased in the population and the percentage of light-colored moths increased in the population.
C. The percentage of dark colored moths decreased in the population after 1850 and the percentage light-colored moths remained constant throughout the time period.
D. The percentage of both the dark-colored moths and the light-colored moths remained constant throughout the time period.
A. The percentage of dark colored moths increased in the population and the percentage of light-colored moths decreased in the population.
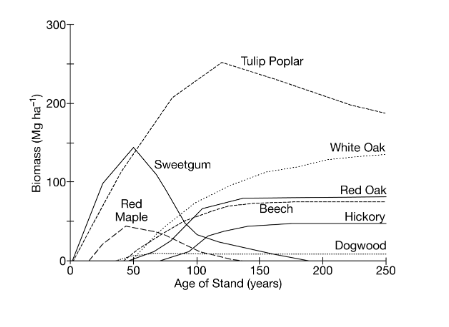
Based on the graph above, which of the following tree species would be the predominant species found during the intermediate stage of succession?
A. Red maple
B. Sweetgum
C. Tulip poplar
D. White oak
C. Tulip poplar

Based on the graph above, which of the following years postdisturbance did sweetgum experience the greatest biomass?
A. 50
B. 100
C. 150
D. 200
A. 50

Based on the graph above, which of the following years postdisturbance had the greatest species richness?
A. 25
B. 100
C. 175
D. 250
B. 100
Which of the following is an example of an ecosystem that provides ecosystem services including protection from hurricane storm surges?
A. A lock and dam system
B. An intact coastal wetland
C. An energy-producing tidal barrage system
D. An offshore, deep-water fish farm
B. An intact coastal wetland
Which of the following ecosystem services are categorized as regulating?
A. Wood fuel, medicine, and potable water
B. Pollination, decomposition, and water purification
C. Recreation, education, and aesthetics
D. Photosynthesis, nutrient cycling, and creation of soils
B. Pollination, decomposition, and water purification
Which of the following economic consequences to a provisioning ecosystem service will most likely result from increased global warming?
A. The collapse of local fisheries, because of the damage to coral reefs from ocean acidification
B. Loss of revenue from the oil industry, because of increased oil spills from offshore oil wells
C. Widespread crop failure, because of increased acid precipitation in agricultural areas
D. Increased cost for water filtration, because of loss of coastal wetlands
A. The collapse of local fisheries, because of the damage to coral reefs from ocean acidification
Based on the theory of island biogeography, which of the following islands would most likely have the highest number of species living on it?
A. An island 30 hectares in size that is 30 kilometers off the coast of the mainland
B. An island 30 hectares in size that is 10 kilometers off the coast of the mainland
C. An island 10 hectares in size that is 30 kilometers off the coast of the mainland
D. An island 10 hectares in size that is 10 kilometers off the coast of the mainland
B. An island 30 hectares in size that is 10 kilometers off the coast of the mainland

The image shows two different islands and the relative distance to the nearest mainland. Based on the theory of island biogeography, which of the following best predicts the effect of the introduction of an invasive species on Easter Island compared to Madagascar?
A. The native species on Easter Island are more likely to survive because the island is further from the mainland.
B. The native species on Easter Island are more likely to survive because the island is so small that there will be limited space for an invasive species to colonize.
C. The native species on Madagascar are more likely to survive because the island is larger and provides a greater diversity of habitats and resources.
D. The native species on Madagascar are more likely to survive because the temperature in the Indian Ocean is warmer than that of the Pacific Ocean.
C. The native species on Madagascar are more likely to survive because the island is larger and provides a greater diversity of habitats and resources.
An island off the coast of Africa contains a larger percentage of specialist species than generalist species. Which of the following describes the most immediate effect if an invasive generalist species is introduced to the island?
A. As predation increases, the population size of the invasive generalist species will decrease.
B. As competition for resources increases, the population size of the island’s specialist species will decrease.
C. As resources are partitioned, the population sizes of both the generalist species and the specialist species will increase.
D. As niches overlap, the invasive generalist species will be outcompeted by the island’s specialist species.
B. As competition for resources increases, the population size of the island’s specialist species will decrease.
Basking on the Brink: A river in India may be the last, best hope for one of the world's largest and most imperiled crocodilians.
Dead gharials began washing up on the banks of India's Chambal River in December 2007. By mid-January, the dead reptiles—some the length of two tall men, lined up end to end—numbered in the dozens. By March, more than 110 of the skinny-snouted creatures had been found dead, most along a 30-kilometer (18-mile) stretch of river.
Among the largest crocodilians in the world, gharials have long, heavy bodies and relatively small heads with bulging eyes and skinny snouts. Although their rows of pointy teeth look menacing, they are specialized for catching and holding onto fish, and pose little danger to people.
The relatively healthy breeding population on the Chambal is precisely why the massive 2008 die-off here caused such alarm. The Chambal contains nearly 80 percent of all the gharials left on Earth. It is the only population large enough to be stable. Speculation ensued among researchers and government officials about what caused the die-off.
Early theories focused on widespread pollution. Based on a variety of clues, however, [researchers suspect] illegal or accidental dumping of the non-steroidal anti-inflammatory drug diclofenac that was once commonly used on livestock but was banned in India in 2006. A few years earlier, also in South Asia, the drug was responsible for a sharp decline of vultures, which all showed signs of kidney dysfunction like the dead gharials examined in 2008.
The die-off . . . illustrates the potentially catastrophic consequences that disruptions to water bodies can have on aquatic species that are close to the brink. For a species that is struggling, the fate of this river will determine its future.
Which of the following best identifies the author's claim?
A. The 2008 die-off of the gharials was caused by extensive overfishing of the Chambal River, leaving little food for the reptiles.
B. The gharials have a wide ecological tolerance range, so it is unlikely that changes to the water chemistry of the Chambal River would have caused the 2008 die-off.
C. Anthropogenic disruptions to Earth’s resources can have sudden and severe negative consequences to the health of native species, specifically those whose populations are already threatened.
D. In light of the 2008 die-off of the gharials, Indian government officials need to enact stricter laws to prevent the illegal dumping of drugs and other pollutants into the Chambal River.
C. Anthropogenic disruptions to Earth’s resources can have sudden and severe negative consequences to the health of native species, specifically those whose populations are already threatened.
Reef fish inherit tolerance to warming oceans
In a rapidly changing climate, the decline of animal populations is a very real concern. An international team of researchers reported new evidence of reef fish adjusting to global warming conditions at the genetic level. [R]esearchers . . . have found that reef fish can inherit from their parents the genetic tools to adjust to ocean warming. “When parents are exposed to an increase in water temperature, we found that their offspring improved their performance in these otherwise stressful conditions by selectively modifying their epigenome.” Epigenetic change refers to chemical modifications in the DNA that signals genes to be switched on or off. A range of factors, including disease, famine, or in the case of this research, heat stress, can stimulate these subtle changes.
In this study, when both parent and offspring experienced the same elevated water temperatures, responsive changes . . . were observed that enhanced the next generation’s ability to cope with the new, warmer temperatures. “We reared spiny chromis damselfish . . . for two generations under three different water temperatures, up to 3 degrees Celsius warmer than current-day ocean temperatures. The next generation appeared to be advantaged by parental exposure to elevated temperatures. The offspring’s altered gene expression, also referred to as ‘acclimation,’ allowed them to maximize oxygen consumption and energy use.” “Acclimation may buffer populations against the impacts of rapid environmental change and provide time for genetic adaptation to catch up over the longer term.”
Which of the following best identifies the author’s claim?
A. Observed adjustments in the ecological tolerance of a species of reef fish is a result of epigenetic changes.
B. Climate change is damaging coral reefs as a result of warming ocean waters, which affect reef fish survival.
C. Transferring specific gene sequences of the spiny chromis damselfish to other fish species will help populations acclimate to warming ocean temperatures.
D. Continued acclimation of fish populations through epigenetics to warmer oceans will eventually replace the process of natural selection.
A. Observed adjustments in the ecological tolerance of a species of reef fish is a result of epigenetic changes.
Salmon May Lose the Ability to Smell Danger as Carbon Emissions Rise
The ability to smell is critical for salmon. They depend on scent to avoid predators, sniff out prey, and find their way home at the end of their lives …. Research from the University of Washington and NOAA (National Oceanic and Atmospheric Administration) Fisheries' Northwest Fisheries Science Center shows this … sense of smell might be in trouble as carbon emissions continue to be absorbed by our ocean.
…
The research team set up tanks of salt water with three different pH levels: today's current average Puget Sound pH, the predicted average 50 years from now, and the predicted average 100 years in the future. They exposed juvenile coho salmon to these three different pH levels for two weeks.
After two weeks, the team ran a series of … tests to see whether the fishes' sense of smell was affected. Fish were placed in a holding tank and exposed to the smell of salmon-skin extract, which indicates a predator attack and usually prompts the fish to hide or swim away. Fish that were in water with current CO2 levels responded normally to the offending odor, but the fish from tanks with higher CO2 levels didn't seem to mind or detect the smell.
…
While this study looked specifically at how an altered sense of smell could affect fishes' response to danger, it's likely that other critical behaviors that depend on smell, such as navigation, reproduction, and hunting for food, would also take a hit if fish aren't able to adequately process smells.
Which of the following best identifies the author’s claim?
A. Acidic water affects the salmon’s ability to sense danger from attacking predators by their sense of smell.
B. Salmon can only tolerate certain water temperatures before all of their senses are severely damaged.
C. Acidic water prevents salmon from maturing and therefore from being able to reproduce and replenish declining salmon populations.
D. Acidic water is causing a rise in the population of predators as a result of the salmon’s increased ability to smell predators.
A. Acidic water affects the salmon’s ability to sense danger from attacking predators by their sense of smell.
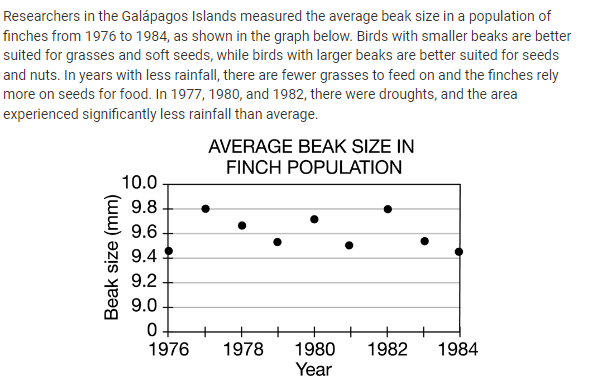
Which statement is best supported by the data in the graph?
A. Finches were better able to find mates, and the population size increased in 1977 because of the abundance of grasses.
B. Finches with larger beaks were more likely to survive in 1980 because they were able to feed primarily on seeds and nuts during the drought.
C. The average beak size in 1981 increased to 9.8mm because finches had access to unlimited resources.
D. The finch population declined from 1983 to 1984 due to a decrease in habitat.
B. Finches with larger beaks were more likely to survive in 1980 because they were able to feed primarily on seeds and nuts during the drought.
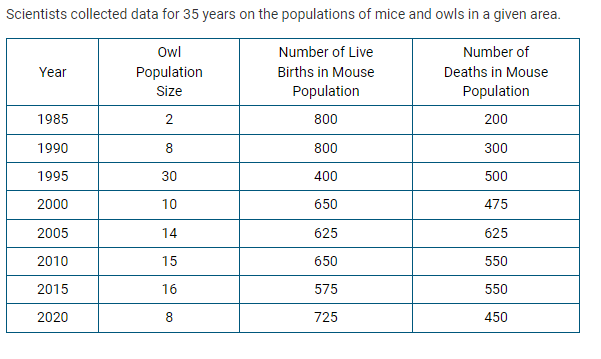
Based on the trends shown in the table, in which of the following years was the owl population at carrying capacity?
A. 1985
B. 1990
C. 2015
D. 2020
C. 2015
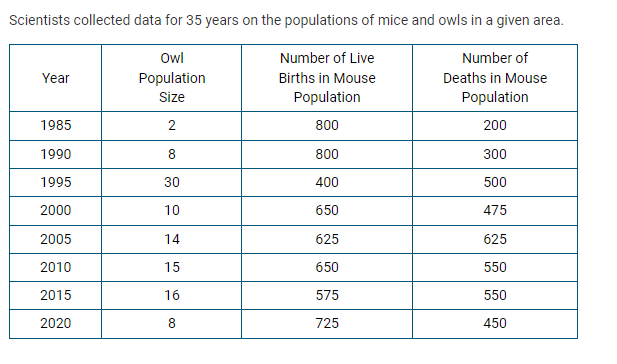
Which of the following claims is best supported by the data shown in the table above?
A. The owl population experienced increased mortality between 2010 and 2015 because of small prey populations.
B. The owl population experienced population overshoot between 1995 and 2000 because of increased competition for resources.
C. The mouse population experienced increased fecundity between 2000 and 2005 because of declining resources.
D. The mouse population experienced zero population growth between 1985 and 1990 because of the large number of predators.
B. The owl population experienced population overshoot between 1995 and 2000 because of increased competition for resources.
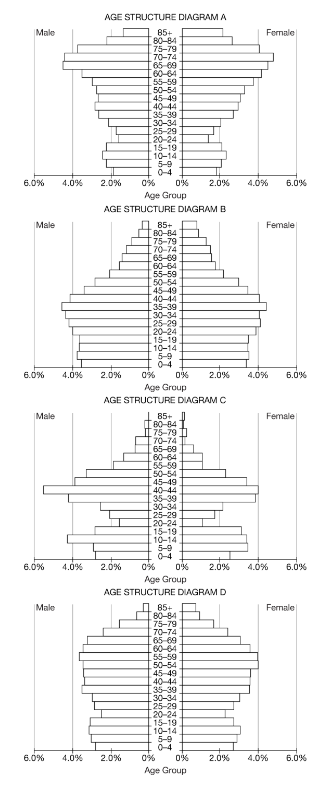
In a given county, the population size is decreasing because there are fewer prereproductive-aged individuals in the population. Which of the age structure diagrams best illustrates the population of this county?
A. A
B. B
C. C
D. D
A. A
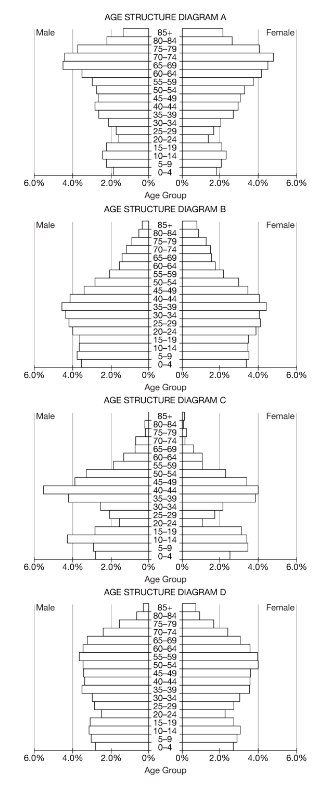
Which of the following statements best describes the pattern seen in age structure diagram C?
A. The county has very little difference between the number of individuals in younger age groups and in older age groups, indicating a declining population size.
B. There is an imbalance between males and females, with a ratio of 1.5 men to every woman in the population.
C. The county most likely has a total fertility rate of less than 2.0.
D. There are more women than men between the ages of 35–49 as a result of immigration of women into the county.
B. There is an imbalance between males and females, with a ratio of 1.5 men to every woman in the population.
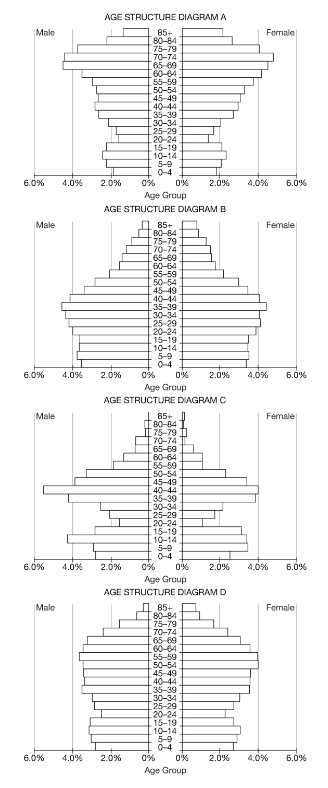
Which of the age structure diagrams best illustrates a county that has a stable population size and slow or no population growth?
A. A
B. B
C. C
D. D
D. D
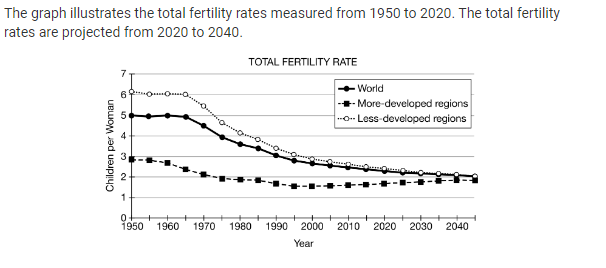
Which of the following best describes the trends seen in the total fertility rates for the world population from 1950 to the projected rates in 2040 ?
A Total fertility rates fell below carrying capacity after 1965 because of an increase in global conflicts.
B Total fertility rates remained fairly steady from 1970 to 1985 as less-developed regions shifted to more agricultural-based economies.
C Total fertility rates declined rapidly from 1960 to 2000 because women had children later in life as a result of increased educational opportunities.
D Total fertility rates are projected to increase slightly from 2000 to 2040 as a result of technological advances and access to health care.
C Total fertility rates declined rapidly from 1960 to 2000 because women had children later in life as a result of increased educational opportunities.
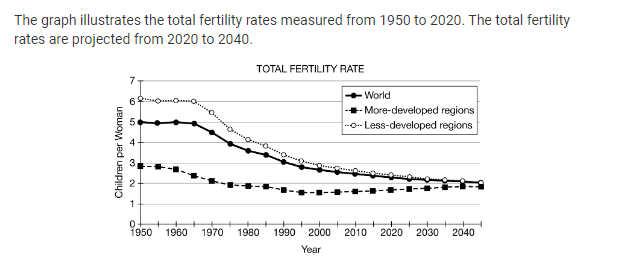
Based on the data in the graph, what was the average number of children born per woman in less-developed regions in 1975?
A 1.9
B 3.9
C 4.7
D 5.4
C 4.7
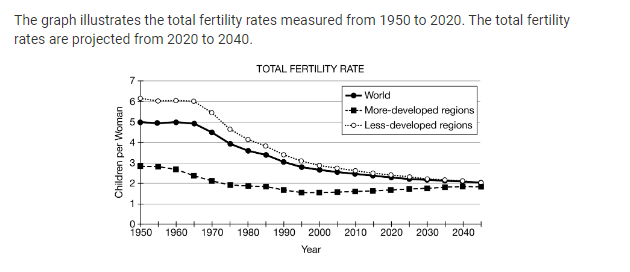
Based on the data in the graph, when did more-developed regions first reach replacement level fertility?
A 1950
B 1970
C 1990
D 2010
B 1970
A scientist is studying a biome that experiences large seasonal fluctuations in both temperature and precipitation patterns.
Which of the following would best characterize the organisms that inhabit the biome?
A Habitat specialists would be most abundant, because they have broad niches.
B Generalists would be most abundant, because the resources available would be constantly changing.
C Generalists that feed only on animals would be more abundant in the summer months, while generalists that feed only on plants would be more abundant in the winter months.
D Specialists that live in trees would be more abundant in the summer months, whereas specialists that live in caves would be more abundant in the winter months.
B Generalists would be most abundant, because the resources available would be constantly changing.
Which of the following best describes a difference between generalist species and specialist species?
A Generalists use a large range of resources, while specialists have a limited range of resources they use to survive.
B Generalists can thrive in a narrow range of environmental conditions, while specialists thrive in a variety of environmental conditions.
C Generalists are often herbivores, while specialists are often omnivores.
D Generalists are more prone to extinction than specialists are.
A Generalists use a large range of resources, while specialists have a limited range of resources they use to survive.
A variety of plants and animals inhabit a forest ecosystem. Which statement correctly explains why certain organisms would be more likely to survive than others if a forest fire burned the area?
A Specialist species are more likely to survive because they can thrive in a narrow range of environmental conditions and they have a limited diet.
B Specialist species are more likely to survive because they can thrive in a large range of environmental conditions and can make use of a variety of different resources.
C Generalist species are more likely to survive because they can thrive in a narrow range of environmental conditions and they have a limited diet.
D Generalist species are more likely to survive because they can thrive in a wide variety of environmental conditions and can make use of a variety of different resources.
D Generalist species are more likely to survive because they can thrive in a wide variety of environmental conditions and can make use of a variety of different resources.
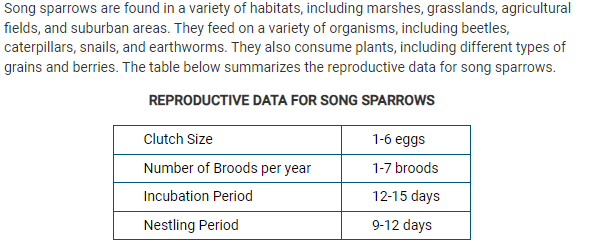
Based on the description and the data table above, which of the following combinations best classifies the song sparrow?
A K-strategist and generalist
B r-strategist and generalist
C K-strategist and specialist
D r-strategist and specialist
B r-strategist and generalist
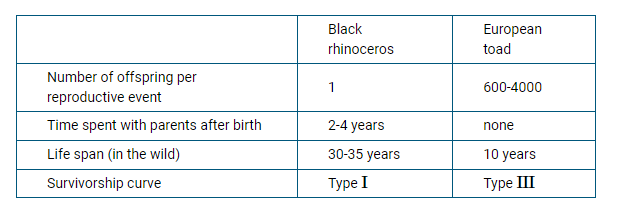
Which of the following claims is best supported by the data in the table?
A The European toad is a K-selected species because it has a Type III survivorship curve.
B The black rhino is a K-selected species because it provides no parental care.
C The European toad is a K-selected species because it can live up to 10 years.
D The black rhino is a K-selected species because it has a low number of offspring per reproductive event.
D The black rhino is a K-selected species because it has a low number of offspring per reproductive event.
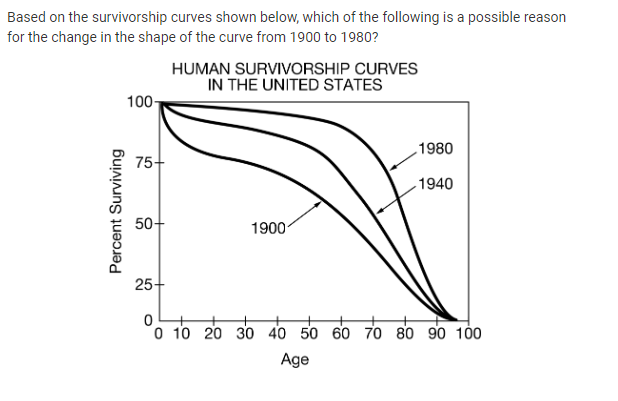
Based on the survivorship curves shown below, which of the following is a possible reason for the change in the shape of the curve from 1900 to 1980?
A Increased immigration and decreased emigration
B Increased infant mortality rate
C Improvements in health-care services and medical research
D Decreased urbanization
C Improvements in health-care services and medical research
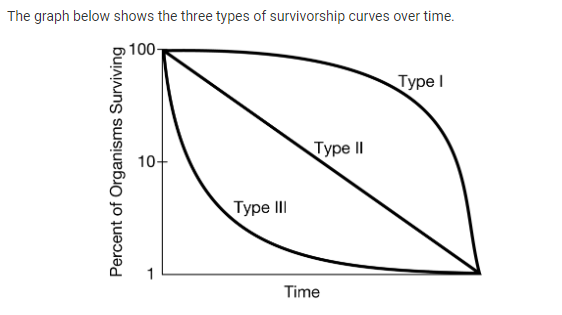
Which of the following is a characteristic of an organism that displays a Type III survivorship curve, as shown in the graph above?
A The organism has a fairly constant mortality rate over time.
B The organism reaches reproductive maturity after many years.
C The organism produces large numbers of offspring every time it reproduces.
D The organism provides constant parental care to its offspring for several years.
C The organism produces large numbers of offspring every time it reproduces.
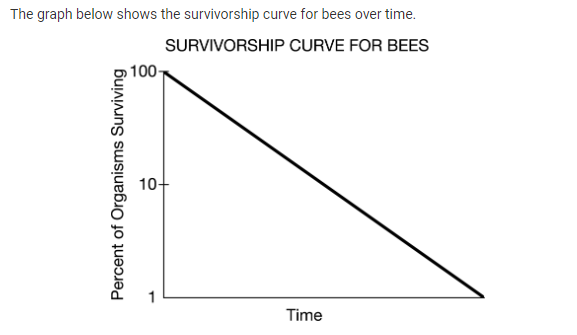
Which of the following claims best supports the classification of bees as an organism that displays a Type II survivorship curve, as shown in the graph above?
A Queen bees are capable of laying up to 2,000 eggs in one day.
B Away from the colony, bees experience a constant probability of death per unit time as a foraging species.
C Bees communicate using chemical signals and exchange information through vibration of their wings.
D Populations of bees are declining in North America due to habitat loss and pesticide use.
B Away from the colony, bees experience a constant probability of death per unit time as a foraging species.
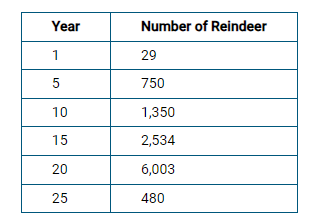
Researchers monitored the number of reindeer over time on an island off the coast of Alaska. The reindeer were introduced in year 1, and the population size was counted every 5 years. The data are shown in the table above. Which of the following claims about trends in the population size over time is best supported by the data?
A The population did not have enough males to help the herd survive, so the population declined over time.
B The population exceeded the carrying capacity of the island, which led to a decrease in the population size following extreme resource depletion.
C The population experienced significant reindeer immigration after year 20.
D The reindeer formed mutualistic relationships and thrived between year 10 and year 20.
B The population exceeded the carrying capacity of the island, which led to a decrease in the population size following extreme resource depletion.
Based on current trends and patterns, which of the following statements best predicts how the human population will change over the next 50 years?
A As the amount of available food and drinking water increases, the population size will also increase.
B As the population density increases, there will be an increase in disease transmission, leading to increased mortality.
C A decrease in the number and magnitude of earthquakes and tsunamis will decrease the amount of land available for agriculture, leading to decreased fecundity.
D As educational and economic opportunities increase for women in less developed countries, both the total fertility rate and the population size will increase.
B As the population density increases, there will be an increase in disease transmission, leading to increased mortality.
The rule of 70 can be used to determine a population’s doubling time. Doubling time is a measure of the
A population growth rate
B environmental impact of each individual in a population
C length of time an individual born in a population is expected to live
D average age of the first reproductive event per 1,000 women in a country
A population growth rate
Which of the following density-independent factors can affect the size of a human population?
A Disease
B Availability of food
C Heat waves
D Access to clean water
C Heat waves
Which of the following statements best describes why birth and death rates are changing in a country that is in Phase 2 of the demographic transition?
A Individuals have better sanitation and access to clean drinking water.
B Individuals have increased availability of birth control and have smaller family sizes.
C The population has a high infant mortality rate because of the lack of health care.
D The population size stops increasing and may decline if birth rates are lower than death rates.
A Individuals have better sanitation and access to clean drinking water.
A country is currently in the second stage of the demographic transition. Currently the country has a birth rate of 37.9 births per 1,000 individuals and a death rate of 13.4 deaths per 1,000 individuals.
Which of the following changes would indicate that the country is moving from the second stage into the third stage of the demographic transition?
A The birth rate declines to 25.3 births per 1,000 individuals.
B The birth rate declines to 13.1 births per 1,000 individuals.
C The birth rate rises to 43.1 births per 1,000 individuals.
D The death rate rises to 37.9 deaths per 1,000 individuals.
A The birth rate declines to 25.3 births per 1,000 individuals.
The demographic transition model describes population change over time as a country becomes more developed. Age-structure diagrams describe how populations are distributed across age ranges. Which of the following age-structure diagrams best displays the age ranges in a country that is in stage 2 of the demographic transition?
Responses
A A stationary age-structure diagram
B An inverted pyramid age-structure diagram
C A constrictive age-structure diagram
D An expansive pyramid age-structure diagram
D An expansive pyramid age-structure diagram
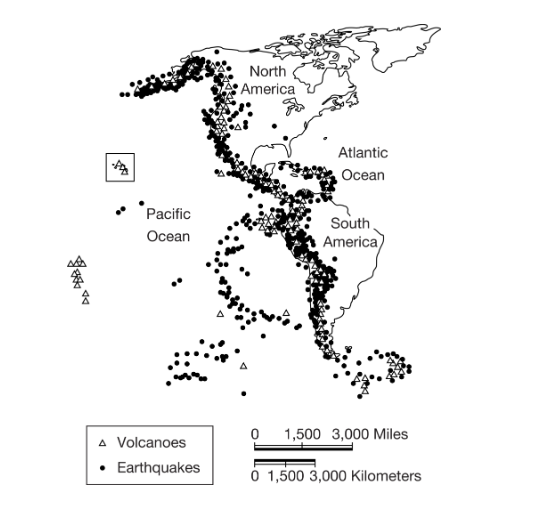
The map above shows the locations of known volcanoes and earthquakes. Which of the following explains what is being illustrated in the enclosed area in the northwest portion of the map?
A The enclosed area illustrates a convergent boundary with earthquakes and possibly volcanoes in the Hawaiian Islands.
B The enclosed area illustrates a transform boundary where two plates slide past one another, resulting in earthquakes of high magnitude in the Hawaiian Islands.
C The enclosed area illustrates a rift valley leading to seafloor expansion near the Hawaiian Islands.
D The enclosed area shows a hot spot in the middle of the Pacific Plate in the Hawaiian Islands.
D The enclosed area shows a hot spot in the middle of the Pacific Plate in the Hawaiian Islands.
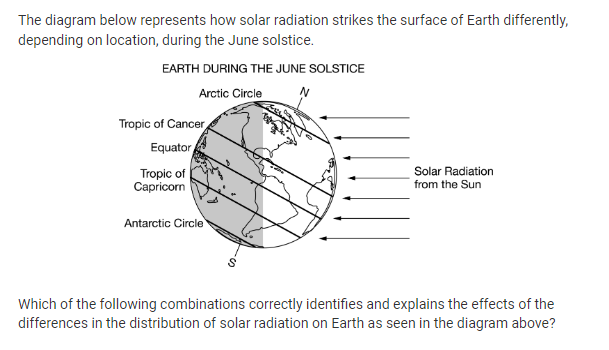
Which of the following combinations correctly identifies and explains the effects of the differences in the distribution of solar radiation on Earth as seen in the diagram above?
A Global wind patterns are created because uneven solar radiation results in warm air at low latitudes and cool air at high latitudes, resulting in density differences between the air masses.
B Global rain patterns are created because uneven solar radiation results in warm air at high latitudes and cool air at low latitudes, resulting in evaporation and condensation differences between the air masses.
C Global wind patterns are created because uneven solar radiation results in warm air at high latitudes and cool air at low latitudes, resulting in density differences between the air masses.
D Global rain patterns are created because uneven solar radiation results in warm air at low latitudes and cool air at high latitudes, resulting in air masses that do not circulate because they are of equal density.
A Global wind patterns are created because uneven solar radiation results in warm air at low latitudes and cool air at high latitudes, resulting in density differences between the air masses.
The Mississippi watershed is the largest in North America, draining all or part of thirty-two states in the United States and two Canadian provinces. A new apartment complex is being built on a steep slope near the source of the Mississippi River outside of Minneapolis, Minnesota. Which of the following measures should be taken to best reduce erosion at the construction site to protect the Mississippi watershed?
A Add a paved surface at the top of the slope.
B Remove trees and shrubs from the slope and the riverbank.
C Move all of the topsoil from the site to the riverbank.
D Plant grass and shrubs on the slope
D Plant grass and shrubs on the slope
During an El Niño event, farmers in the southwestern United Stated often benefit from which of the following climatic changes?
A Longer and cooler summers that increase crop yield
B Wetter and warmer weather that increases soil moisture
C Cooler and drier conditions that help cold-weather crops
D Warmer and drier weather that reduces soil erosion and flooding
B Wetter and warmer weather that increases soil moisture
During a La Niña event, what environmental changes would the tropical Pacific Ocean and its surrounding landmasses most likely experience?
A Increased rainfall in the eastern Pacific Ocean leading to flooding and landslides off the coast of South America
B An area of high pressure forming over landmasses and increasing the chance of typhoons
C Cooler ocean water in the western Pacific Ocean leading to an increased chance of wildfires
D Increased upwelling off the coast of South America resulting in increased productivity of fisheries
D Increased upwelling off the coast of South America resulting in increased productivity of fisheries
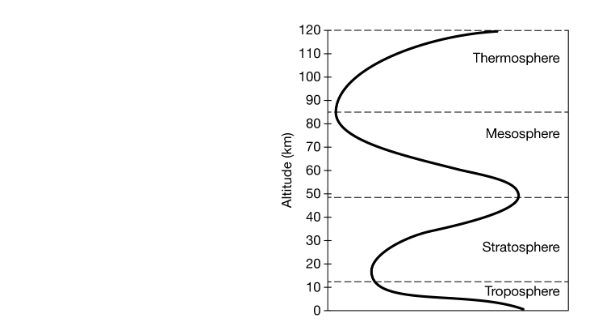
Which of the following abiotic factors, when graphed on the x-axis, leads to the curved line in the graph due to variation in the different layers of the atmosphere?
A Nitrogen (N2) concentration gradients
B Carbon dioxide (CO2) concentration gradients
C Temperature gradients
D Ultraviolet radiation gradients
C Temperature gradients
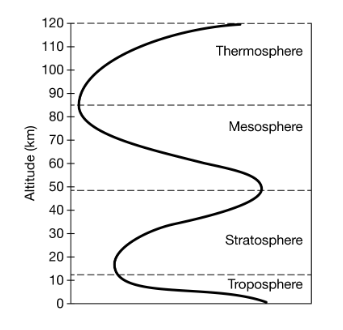
The vast majority of ozone (O3) is found in a thin layer due to a lack of circulation in which of the following atmospheric layers?
A Thermosphere
B Mesosphere
C Stratosphere
D Troposphere
C Stratosphere
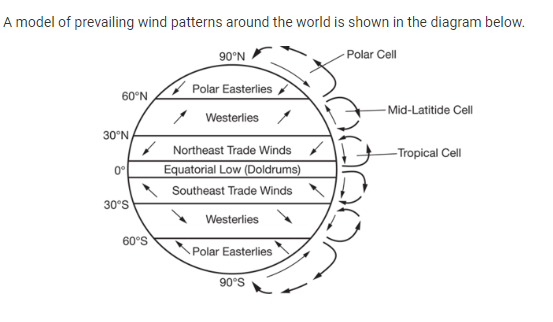
Which of the following is the best explanation for the formation of Hadley cells in the tropics, as seen in the diagram, between 30°N and 30°S latitude?
A Heat from the ocean warms the moist air at the equator and causes it to rise because of its lower density. As the air becomes cooler, it becomes less dense and sinks.
B The Sun warms the moist air at the equator and causes it to rise because of its lower density. As the warm air moves away from the equator, it cools, becomes denser, and then sinks.
C Air cools over the land at the equator and then rises as it moves north or south.
D Rising air over the equator is heated by the Sun, moves north, and then moves south to create the jet stream and trade winds.
B The Sun warms the moist air at the equator and causes it to rise because of its lower density. As the warm air moves away from the equator, it cools, becomes denser, and then sinks.
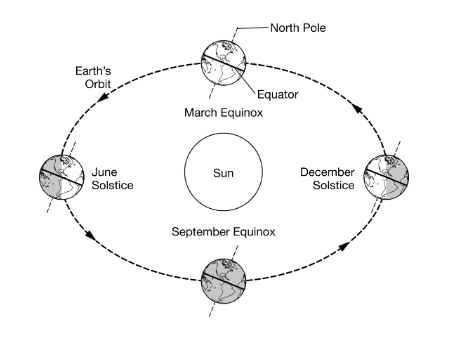
Based on the diagram, which of the following days in Earth’s yearly orbit would have the longest period of daylight in the Northern Hemisphere?
A March equinox
B December solstice
C September equinox
D June solstice
D June solstice
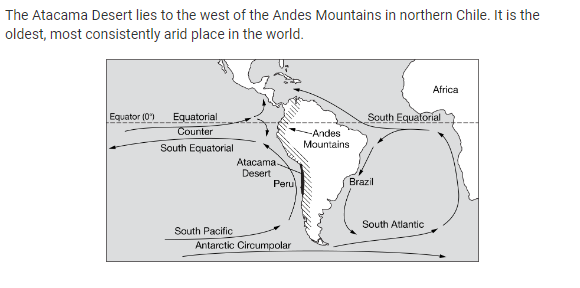
Based on the map above, which of the following best identifies and explains the region of South America that would have a more moderate climate?
A The west coast would have a more moderate climate because of the Peru Current.
B The west coast would have a more moderate climate because of the Andes Mountains.
C The east coast would have a more moderate climate because of its proximity to the equator.
D The east coast would have a more moderate climate because of the Brazil Current.
D The east coast would have a more moderate climate because of the Brazil Current.
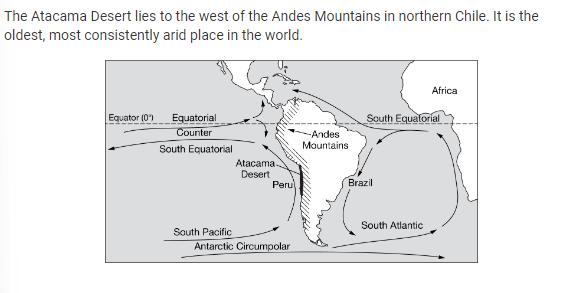
Based on the map, which of the following best explains the area of the Andes Mountains that would have the greatest number of rivers?
A Equal numbers of rivers would be found on both the east and west sides of the Andes Mountains because water flows downhill.
B More rivers would be located on the west side of the Andes Mountains because it is the leeward side.
C More rivers would be located on the east side of the Andes Mountains because the trade winds are coming from the east.
D More rivers would be located on the south side of the Andes Mountains because it is protected from the drying sunlight.
C More rivers would be located on the east side of the Andes Mountains because the trade winds are coming from the east.
Overfishing of stocks of fish species, like salmon and cod, in an effort to meet a growing global demand has become an international concern. A recent estimate indicates that the average annual consumption of fish globally in 2014 was about twice the consumption in 1960. Because of increased concerns about the impact of overfishing, fishery managers are looking for ways to protect wild populations while still satisfying global demand for food for human consumption.
Which of the following techniques could best reduce the harmful effects of overfishing if it were to be widely adopted by the fishing industry?
A Increased use of large-mesh gill nets for harvesting salmon and trout
B Greater reliance on bottom trawling in coastal waters for harvesting shrimp and sole
C Increased use of long-line fishing techniques in the open ocean for harvesting swordfish and halibut
D Widespread application of cyanide in tropical waters for harvesting tuna and cod
A Increased use of large-mesh gill nets for harvesting salmon and trout
Overfishing of stocks of fish species, like salmon and cod, in an effort to meet a growing global demand has become an international concern. A recent estimate indicates that the average annual consumption of fish globally in 2014 was about twice the consumption in 1960. Because of increased concerns about the impact of overfishing, fishery managers are looking for ways to protect wild populations while still satisfying global demand for food for human consumption.
Various nations have adopted policies designed to combat overfishing. Which of the following approaches is commonly used to combat the problem of overfishing?
A Reducing the limits on the numbers of commercial fish species that can be caught
B Banning the use of sonar as a means for capturing fish in open ocean waters
C Promoting fishing in estuaries and breeding grounds rather than in the open ocean
D Enforcing minimum-size requirements for the capture of some commercial species
D Enforcing minimum-size requirements for the capture of some commercial species
Which of the following best describes environmental damage caused by slash-and-burn farming in tropical rain forests?
A Nitrogen and phosphorus enter streams and reduce the growth of algae.
B The soil loses fertility after a short period of time and will be ineffective for farming use.
C The bare soil is exposed and becomes dried out, killing valuable soil bacteria.
D There is an increase in biodiversity as areas that were previously forested areas are converted to agricultural fields.
B The soil loses fertility after a short period of time and will be ineffective for farming use.
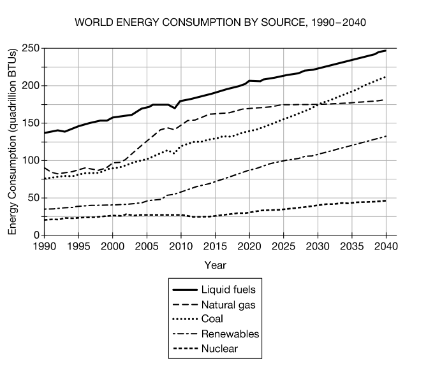
Which of the following is the approximate projected rate of change in renewable energy consumption from 2010-2040 ?
A 4.33 quadrillion BTUs per year
B 2.33 quadrillion BTUs per year
C 2.00 quadrillion BTUs per year
D 0.733 quadrillion BTUs per year
B 2.33 quadrillion BTUs per year
After the Industrial Revolution, the use of fossil fuels increased significantly. Despite the documented environmental effects of these resources and the availability of renewable resources, the use of nonrenewable sources continues.
Which of the following statements best explains why there is continued widespread use of nonrenewable fossil fuels in energy production in the United States?
A Established technology and transportation infrastructure for fossil fuels allows these resources to be converted into energy to meet consumer demand.
B Fossil fuels are significantly cheaper than renewable resources, so they do not require government subsidies, which ultimately saves the government money.
C The environmental effects of fossil fuels are easy to mitigate, while the environmental effects of renewable resources are difficult to understand and reverse.
D Fossil fuels will always be present and are plentiful in quantity, so there is little pressure to find a replacement for them as an energy source.
A Established technology and transportation infrastructure for fossil fuels allows these resources to be converted into energy to meet consumer demand.
Which of the following is an example of the process of cogeneration?
A Using timber waste products as biofuel
B Using wastewater from electricity production for heating homes
C Using the corn crops for ethanol fuel production
D Using the reservoir behind a hydroelectric dam for recreation
B Using wastewater from electricity production for heating homes
Which of the following best describes why people in less developed countries use wood as a primary energy source?
A The infrastructure required to transport wood is well established.
B Wood produces fewer carbon emissions than other energy sources, such as geothermal or natural gas.
C Wood can be converted to peat and cheaply burned for fuel.
D Wood, in the form of firewood and charcoal, is often readily available.
D Wood, in the form of firewood and charcoal, is often readily available.
Which of the following best describes an environmental problem that is often linked to the process of fracking?
A Fracking operations require large tracts of land, which degrades habitat and harms wildlife.
B Fracking can increase stream flow and water volume, disrupting fish migration pathways.
C Wastewater from fracking operations is injected into porous rock formations, which can induce seismic activity.
D Excessive nutrients, such as nitrogen and phosphorus, run off the land near fracking sites, which can lead to large algal blooms in nearby waterways.
C Wastewater from fracking operations is injected into porous rock formations, which can induce seismic activity.
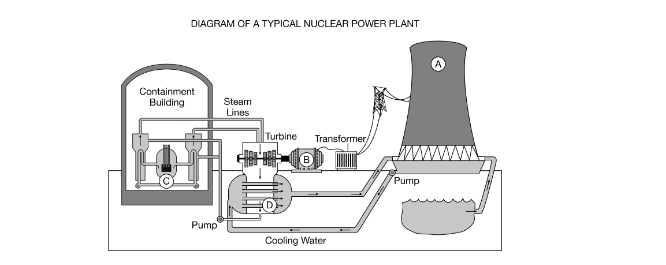
At which of the following locations in the nuclear power plant would an accident most likely result in the release of fission products?
A. A
B. B
C. C
D. D
C. C
An air pollution expert set up a monitoring program to determine the amount of particulate matter (PM) leaving a farmer’s field after crops were harvested and the soil was bare. She set up high-volume air samplers 10 meters from each edge of the square field and collected samples weekly for two months. When she looked at her data, she was surprised by how much the PM levels varied, both from site to site on a given date and over time at each site. Which of the following parameters would have been best to measure to help explain the variation in her results?
A Percent of cloudy days over the two months
B Particle size of the soils in the field
C Depth of the organic matter in the soil
D Wind direction and speed
D. Wind direction and speed
Which of the following best describes how a scientist could accurately study the effects of soil buffering on plant growth in a region that is affected by acid deposition downwind of a coal-burning power plant?
A Measure changes in plant height over a year in a two different groups of trees; one group is 5km from the power plant and one group is 10km from the power plant.
B Measure the changes in plant height over a year in two different groups of trees the same distance from the power plant; one group is in topsoil and one group is in topsoil with limestone added.
C Measure changes in plant biomass over a year in two different groups of trees the same distance from the power plant; one group is not manipulated and one group is watered daily to dilute the deposition's acidity.
D Measure changes in plant biomass over a year in two different groups of trees; one group is 5km from the power plant over limestone bedrock and one group is 10km from the power plant that has nitrogen and phosphorus added to the topsoil.
B Measure the changes in plant height over a year in two different groups of trees the same distance from the power plant; one group is in topsoil and one group is in topsoil with limestone added.
Which of the following gases has the greatest impact on global climate change as a result of having the highest global warming potential (𝐺𝑊𝑃) ?
A Carbon dioxide
B Methane
C Nitrous oxide
D Chlorofluorocarbons
D Chlorofluorocarbons
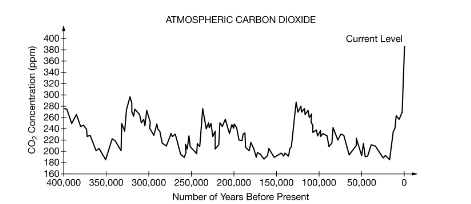
The graph above shows 𝐶𝑂2 measurements taken from Mauna Loa, Hawaii, and the Vostok ice core, which was drilled from ice sheets in Antarctica.
Based on the data shown in the graph, which of the following is the most plausible hypothesis about the number of glacial periods that occurred in the past 400,000 years?
A One glacial period occurred in the past 400,000 years.
B Two glacial periods occurred in the past 400,000 years.
C Three glacial periods occurred in the past 400,000 years.
D Four glacial periods occurred in the past 400,000 years.
D Four glacial periods occurred in the past 400,000 years.