Exam1MathML
1/86
Earn XP
Description and Tags
exam1
Name | Mastery | Learn | Test | Matching | Spaced | Call with Kai |
|---|
No analytics yet
Send a link to your students to track their progress
87 Terms
Population
The entire set of all individuals, items, or events of interest
Parameter
A numerical characteristic of the entire population
Sample
A small subset of observational units chosen from the population
Statistic
Numerical characteristics computed directly from the sample data
Random Sampling
Units are selected entirely at random from the population. Each subset is equally likely
Stratified Sampling
The population is divided into meaningful groups based on an important attribute,. Random representatives are then selected from each stratum, often in proportion to the total strata size
Cluster Sampling
The population is divided into groups based on a non-important attribute. Then, the entire content of some randomly selected clusters is sampled
Systematic Sampling
Selecting every k-th observational unit. The value k is calculated as population size / sample size
Convenience Sampling
Selecting units that are the easiest to access
Selection Bias
Bias caused by a bad selection methodology
Leading Question (Response) Bias
Questions are structured to elicit a particular response
Social Desirability Bias
Respondents answer in a way that is favorable or acceptable to others
Self-selection (Volunteer) Bias
The sample consists of a self-selected group of respondents who chose to participate
Nonresponse Bias
Occurs when certain groups prefer not to share their opinions, leading to a skewed sample
Observational Study
Data is collected by recording responses and measuring features as they naturally occur, without the researcher exerting any direct influence on the observed data
Statistical Experiment
Treatments are first assigned to the observational units, and then the responses are recorded
What is Data?
A collection of things known or assumed as facts. It is empirical, referring to something that is observed. When visualizing data, think of tables where each column is a different attribute and each row represents the measurements for a specific entity
What is an Observational Unit?
An individual, item, or event of the population for which a single data record is created
What is a Census?
A complete enumeration of every member of a population. It collects data from the entire population to get an accurate and complete picture
Define Population.
The entire set of all individuals, items, or events of interest. Examples include "all five-card poker hands" or "all car models made by Chevrolet
Define Sample.
A small subset of observational units chosen from the population. It is the subset for which the data of interest is actually collected
Define Parameter.
A numerical characteristic of the entire population. Examples include the population mean (μ). The goal of statistics is to learn these values. True population parameters typically cannot be measured directly
Define Statistic.
Numerical characteristics computed directly from the sample data. The mean of each sample (xˉ) is a statistic. Statistics are used as tools for making inferences about the population parameters
What is the goal of a good Sampling Method?
To produce a sample that is a good representative of the population, ensuring that the sample statistics align with the population parameters
What is Random Sampling?
Units are selected at random from the entire population, where each subset is equally likely
What is Stratified Sampling?
The population is first divided into meaningful groups (strata) based on an important attribute, and then random representatives are selected from each stratum (often proportional to the total size)
What is Cluster Sampling?
The population is divided into groups based on a non-important attribute, and then the entire content of some randomly selected clusters is sampled
What is Systematic Sampling?
Selecting every k-th observational unit, where k is calculated as population size divided by sample size
What is Convenience Sampling?
Selecting observational units that are the easiest to access. This method is quick but results in a sample that is often not representative of the full population
Define Sampling Bias.
A difference between the parameter inferred from a sample and the true value of the parameter in the population. The way data is collected impacts the reliability of results
What is Selection Bias?
Bias caused by a bad selection methodology. Example: surveying economic policies only in an affluent neighborhood
What is Self-selection (Volunteer) Bias?
The sample consists of a self-selected group of respondents who chose to participate. Example: conducting a poll on X (Twitter)
What is Social Desirability Bias?
Respondents answer in a way that is favorable or designed to please others. Example: inflating how much one donates to charity, or a survey about the frequency of alcohol consumption
What is Leading Question (Response) Bias?
Occurs when questions are structured to elicit a particular response. Example: asking "How enjoyable was your recent shopping experience?" which assumes enjoyment
What is Nonresponse Bias?
Occurs when certain groups prefer not to share their opinions, leading to a skewed sample
Define Observational Study.
Data is collected by recording responses and measuring features as they naturally occur, without the researcher exerting any direct influence on the observed data. Example: Recording data about birds in a backyard
Define Statistical Experiment.
Treatments are first assigned to the observational units, and then the responses are recorded. Example: An A/B test where participants are randomly assigned one of two web page layouts
What is the key benefit of a Statistical Experiment?
With random assignment of treatments, researchers can investigate whether the treatment is the cause of the observed response
What is the purpose of Measures of Centrality?
They provide a single, representative value of the entire dataset. Knowing the central tendency helps understand what is typical and facilitates comparisons across different datasets
Define Mean and provide its notation for a sample and a population.
The mean is the average value of the data. Sample Mean: xˉ=∑xi/n. Population Mean: μ=∑xi/n. The larger the sample, the closer the sample mean gets to the population mean.
Define Median.
The median is the middle value in a sorted list of data. If the number of data points (n) is odd, the median is the value in the middle position. If n is even, the median is the average of the two central points
Define Mode
The mode is the value in a dataset that occurs most frequently. Alternatively, the mode is represented by a peak (or bump) in a frequency distribution (histogram)
How do the mean, median, and mode relate in different types of data distribution (Skewness)?
Symmetrical distribution: The mean, median, and mode are equal. 2. Right-skewed (positively skewed): The mean is greater than the median, which is greater than the mode. 3. Left-skewed (negatively skewed): The mode is greater than the median, which is greater than the mean
What is the purpose of Measures of Dispersion (Variance/SD)?
They quantify the variability or spread of data around a central point. They reveal how consistent or diverse a dataset is, and help in identifying outliers
Define Variance.
Variance is an average of a squared deviation from the mean. It is computed differently for populations and samples
Contrast the formulas for Population Variance (\sigma^2) vs. Sample Variance (s^2).
Population Variance (\sigma^2): Divides the sum of squared deviations by the total population size (N). Sample Variance (s^2): Divides the sum of squared deviations by (n−1). Dividing by (n−1) gives a less biased estimator of the population variance, preventing the sample variance from underestimating the actual variance
Define Standard Deviation (SD) and its purpose.
is the square root of the variance. By taking the square root, the data returns to the original units in which the measurements were made. It is often used to summarize a sample as xˉ±s
What is the Empirical Rule?
The Empirical Rule applies to bell-shaped (normal) distributions (where mean=median=mode). It states that: 68% of all data falls within 1 standard deviation (σ) of the mean (μ); 95% falls within 2 σ; and 99.7% falls within 3 σ. Data points falling more than 3 σ from the mean are considered outliers
What is Chebyshev's Theorem and what kind of distributions does it apply to?
Chebyshev's Theorem applies to any dataset and any distribution. It states that the percentage of data within k standard deviations from the mean is at least 1−1/k², for k>1
What is the purpose of Measures of Position (e.g., Z-score, Quartiles)?
They indicate where a given value is located with respect to other data points. They divide the data into segments, revealing how the data is spread out, and help identify outliers
Define Percentile.
A percentile is a data value for which a specified proportion (n) of the distribution falls at or below that value. The median, for example, is the 50th percentile.
Define the three Quartiles (Q_1, Q_2, Q_3).
Q_1 (First Quartile): The 25th percentile; one-quarter of the data falls at or below Q1. Q_2 (Second Quartile): The median of the dataset. Q_3 (Third Quartile): The 75th percentile; three-quarters of the data fall at or below Q3.
What are the Range and the Inter-Quartile Range (IQR)?
Range: The difference between the maximum (max) and minimum (min) values (Max−Min). Inter-Quartile Range (IQR): The difference between the third quartile and the first quartile (IQR=Q3−Q1)
List the components of the Five-Number Summary.
The five values used to summarize data are: Minimum (Min), First Quartile (Q1), Median (Q2), Third Quartile (Q3), and Maximum (Max). Quartiles divide the dataset into four parts, each covering 25% of the data
How are Quartiles used to detect outliers (Outlier Thresholds)?
Outliers are values that fall outside the calculated minimum and maximum thresholds defined using the IQR: Min Threshold: Q1−1.5×IQR. Max Threshold: Q3+1.5×IQR
What is a Box Plot (Box-and-Whisker Plot)?
A box plot is a visual representation created by plotting the five-number summary along a numeric axis. It provides insights into central tendency, spread (IQR), and outliers
What is a Z-score?
A standardized score that describes how many standard deviations from the mean a given value lies, and in which direction. It is computed as z=(val−μ)/σ
Define a Random Process (or Random Experiment).
An action or process where the outcome is determined by chance. One spin of a prize wheel is an example of a random process
Define Sample Space.
The set of all possible outcomes of a random process.
Define Outcome.
One possible result of a random process.
Define a (Discrete) Event.
A subset of a sample space; it is a single outcome or a collection of outcomes. Events are typically denoted by A, B, or C.
What is the Complement of Event A (\neg A)?
The event consisting of all outcomes in the sample space that are not in event A.
What is the Union of Events A and B (A \cup B)?
The event consisting of all outcomes in A or B, including outcomes that are in both A and B.
What is the Intersection of Events A and B (A \cap B)?
The event consisting of only the outcomes in both A and B.
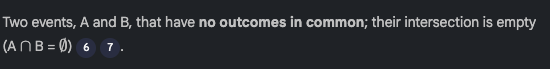
What defines Disjoint (Mutually Exclusive) Events?
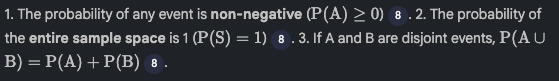
What are the three Axioms of Probability?
Define a Discrete Random Variable (X).
A variable whose possible values are numerical outcomes of a random experiment, taking on only a countable number of distinct values (typically integers). Discrete random variables are usually counts
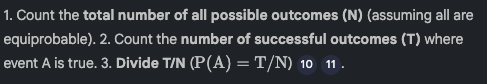
What is the general method for computing the probability P(A) of a discrete event A?
How is P(A) visualized in relation to the sample space?
P(A) is visualized as the proportion of the total sample space where A is true. The total area of the sample space equals 1.0
How does the Complement Rule relate -A to A

How is the probability of the Union of two disjoint events (A \cup B) calculated?

How is the probability of the Intersection of two independent events (A \cap B) calculated?

What is the purpose of Combinatorics in probability?
To count the total number of possible outcomes (N) and the number of successful outcomes (T) without having to enumerate them
State the Rule of Sum.
If you need to count the total number of elements in two sets (P and R), you sum up their set cardinalities ($
State the Rule of Product.
To count all possible pairs of elements from two sets (F and D), multiply the cardinality of the sets ($
Formula for Selection Type 1: Order Matters, With Repetitions?
The total number of groups of size k built from n items, allowing repetitions, is n^k
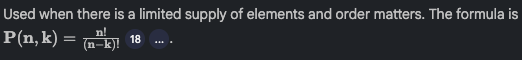
Formula for Selection Type 2: Order Matters, Without Repetitions (k-Permutations)?
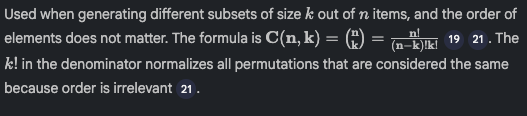
Formula for Selection Type 3: Order Doesn't Matter, Without Repetitions (Combinations)?
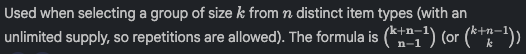
Formula for Selection Type 4: Order Doesn't Matter, With Repetitions (Stars and Bars)?