Need to Know
1/122
There's no tags or description
Looks like no tags are added yet.
Name | Mastery | Learn | Test | Matching | Spaced |
|---|
No study sessions yet.
123 Terms
population
is any group of organisms of the same species living and breeding together.
community
a group of populations of different species that interact in the same area.
ecosystem
composed of a community of different species living in an environment plus all the nonliving parts, such as soil and water, it interacts with.
landscape
made of connected ecosystems like a seaside or lakeside ecosystem.
Global ecosystem
all the ecosystems across the biosphere
Ecology
scientific study of the interactions between organisms AND the living (biotic) and non-living (abiotic) parts of their environment
Studying ecology helps us
us understand the relationships between organisms and their environment, including how ecosystems function and how they are affected by human activities.
Humans are
part of the global ecosystem and our everyday decisions can positively or negatively, directly and indirectly, impact all the other levels of life.
Species have a range of
tolerance for abiotic conditions (sunlight, water, pH, nutrient availability). This limits where they can live.
Some organisms require wet conditions, other that are adapted for the extreme heat and low precipitation levels.
History & Dispersal
Species distribution are a product of geographical history like kangaroos found only in Australia. Land bound kangaroos cannot leave (or disperse) the island (on their own).
Abiotic factors
also affect its distribution as well.
Red kangaroos are adapted to the arid areas, drink less water than most kangaroos, and their urine is more concentrated so they will lose less water.
Biotic
factors include living components of an ecosystem, such as competition, predation, and symbiosis, that influence species distribution and interactions.
Abiotic
Non-living physical and chemical elements that influence living organisms and ecosystems, such as climate, soil, and water.
Keystone Species
A species that has a disproportionately large effect on its environment relative to its abundance, often maintaining the structure of the ecological community.
Clumped
This is the most common pattern of population dispersion.
Organisms are clustered together in groups. This may reflect a patchy distribution of resources in the environment. Mating, predatory defense, hunting behavior may affect this
Uniform
Organisms are fairly evenly spaced over the area they occupy. This is typical of species with aggressive, territorial interactions (organisms try to avoid contact) and individuals compete for a scarce environmental resource, such as water in a desert. Plants may secrete toxic chemicals into the soil that inhibits germination of seeds.
Random
Organisms have an unpredictable distribution. This is typical of species in which individuals do not interact strongly. An example is random, wind-blown dandelion seeds.
Population size is not
Static
Immigration and births
increase population size
Emigration and deaths
decrease population size
Change in population size Formula
R = ΔN / Δt = B – D
Exponential population growth
is population increase under idealized conditions (Resources are unlimited)
The equation of exponential population growth is
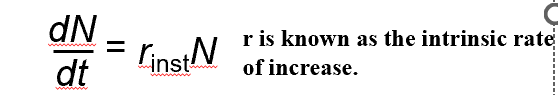
Exponential population growth results in a
J-shaped curve
Immigration
the movement of individuals into a population, increasing its size.
Emmigration
the movement of individuals out of a population, reducing its size.
Most populations do not grow exponentially
NATURALLY and these examples are due to human impact.
Exponential growth cannot be
sustained for long in any population
A more realistic population model limits growth by
incorporating carrying capacity leading to S-shaped curve (Logistic Growth)
Logistic Growth
describes a population growth model that is limited by environmental factors, leading to a stabilization of population size at carrying capacity.
Carrying capacity (K)
the maximum population size the environment can support (K can change)
Carrying capacity varies with
abundance of limiting resources
K is similar to
the set point in homeostasis
In the logistic population growth model
the growth rate declines as carrying capacity is reached
Logistic Growth Formula
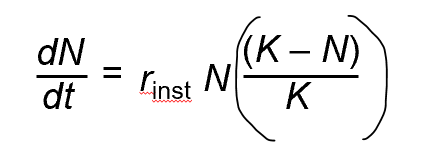
The last part of the equation [K–N)/K] is the
fraction of K that is available for population growth.
When N << K
similar to exponential growth, (K–N)/K = close to 1
When N ~K
(K–N)/K = close to 0 meaning that population growth slows significantly as it approaches the carrying capacity.
When N = K
the population stops growing (K–N)/K = 0
Some populations overshoot K before settling down to a relatively stable density. Why?
negative feedback; there are time lags for death rates to kick in & reproduction to slow down
Following past the K
there is a steep death rate until stabilization.
Density-dependent factors
influenced by the relative size of a population.
Includes biotic parts of the ecosystem.
Competition for limited resources (e.g., breeding space)
Predator numbers
Availability of resources (e.g. shelter, water)
Nutrient supply (i.e. food source)
Disease/pathogenic spread
Accumulation of wastes (sometimes toxic)
In density-dependent regulation
birth rates fall and
death rates rise with population density
Density-independent factors
not influenced by the relative size of a population.
Mostly abiotic parts of the ecosystem.
Abiotic factors (e.g. temperature, CO2 levels, etc.)
Phenomena (e.g. natural disasters)
Weather conditions (e.g. floods, storms, etc.)
In density-independent regulation
birth rate and death rate do not change with population density
Since the 1960’s
people are having less children/lower fertility (world-wide demographic transition). (Some nations are growing exponentially, some are stable, and some are even declining)
trophic structure of a community can be organized by
“who feeds on whom” (feeding relationships)
Producers
obtain atoms and energy and convert them into essential carbon-based molecules of life
Make their own food.
Consumers
feed on producers and other consumers to survive. (They can’t make their own food.)
Must Consume their food
Decomposers
feed on dead organisms or waste to renew the raw materials for life.
Break down decomposing organic matter
+/+ means the interaction is
beneficial for both species
+/- means the interaction is
beneficial for one species, but negative for the other.
-/- means the interaction is
negative for both species
+/0 means the interaction is
beneficial for one species and doesn’t affect the other species at all.
Intraspecific
interactions between organisms within the same species.
Competition for resources, mates, shelter, etc.
Interspecific
interactions between organisms of different species.
Competition
Predation
Herbivory
Parasitism
Mutualism
Commensalism
Competition
(-/-)
When individuals of different species compete for a LIMITED resource that limits the survival and reproduction of each species.
Ex: weeds growing in the garden compete with garden plants
Ex: different animals trying to eat the same food source
Competition can lead to competitive exclusion
When two species compete for the SAME limiting resource and use it in the SAME way, they cannot coexist in the same place.
Ecological niche
the specific set of biotic and abiotic resources that an organism uses in its environment.
An organism’s niche includes:
Habitat in which an organism lives
Activity patterns of the organism (time of day its active)
Resources it obtains from the environment
Interactions that occur with other species
Food, range of tolerance for abiotic factors, etc.
Niche is one evolutionary result of
competitive exclusion
Resource Partitioning
the differentiation of niches that enables similar species to coexist in a community
Fundamental Niche
the niche which could potentially be occupied
Realized Niche
the niche that is actually occupied, primarily due to competition
Animals have adapted ways to defend themselves
Mechanical: Thorns, shells, quills
Ex: Porcupine, crabs
Chemical: Toxins or bad odors
Ex: Skunk
Cryptic coloration
camouflage
Ex: Canyon tree frog
Aposemetic coloration
bright warning coloration
Ex: Poison dart frogs
Batesian mimicry
a palatable or harmless species mimics an unpalatable or harmful species to which it is not closely related (deception).
Ex: Hawkmoth larva
Müllerian mimicry
two or more unpalatable species resemble each other (not deceptive, true signals)
Food Chain
simplistic linear sequence of organisms through which nutrients and energy move from one species to another.
Apex predator
Top-level carnivore has no natural predators (ex: us, hawk, killer whale)
Food Web
a complex web of interdependent feeding relationships within a community.
More representative of complexity of nature.
Organisms can have more than one food source.
Organisms can have more than one predator.
Species may play a role at more than one trophic level depending on the food chain.
Species diversity increases in two parts
species richness and species abundance
Species Richness
number of different species in the community.
Relative Abundance
the proportion each species represents of all individuals in the community.
Diversity is indicative of a healthy ecosystem
Diverse communities have higher levels of primary production-energy.
Diverse communities are better able to withstand or recover from disturbances.
Diverse communities are more stable year to year.
Diverse communities are more resistant to invasive species
Invasive Species
organisms that become established outside their native range. They can become dominant because they lack natural enemies and can negatively impact the native biodiversity.
Foundation Species
dominant species that are the most abundant or that collectively have the highest biomass
Strong effects on communities as a result of their number or size
Loss can allow other species to take over, but this impacts species that rely on this dominant species. They can control the population of other species.
Ex: Trees, desert shrubs, kelp
These foundational species can change the
Ecosystem Engineers
species that dramatically alter their physical environment.
Some foundation species can be ecosystem engineers (trees)
Ex: Beavers create dams and transform landscapes on a large scale. They create new habitats and new niches. They create pools and more complex habitats.
Two models of community organization
Bottom-up Model and Top-down Model
Bottom-up Model
a unidirectional influence from lower to higher trophic levels.
Altering biomass at lower levels will cause changes through the food web.
Top-down Model
a unidirectional influence from higher to lower trophic levels.
Altering biomass at higher levels will cause changes through the food web.
Move in alternating +/- effects
Disturbance
an event, such as a storm, fire, flood, drought, or human activity, that changes a community by removing organisms from it or altering resource availability
Scientists think that most communities are constantly changing after disturbance.
After a disturbance that maintains soil, fast growing small pioneer plants come back first. Over time slower growing species establish and can outcompete the fast-growing pioneer species (shade them out). This is ecological succession
Intermediate Disturbance Hypothesis
moderate levels of disturbance foster greater species diversity than do high or low levels of disturbance.
Too much disturbance wipes everything out.
With too little disturbance, the dominant species take over and outcompetes other species.
Ecological Succession
a disturbed area may be colonized by a variety of species, which are replaced by other species, which are replaced by still other species.
Primary Succession
recovery/colonization in an area that is virtually lifeless (bare rock).
Soil has not yet formed
Prokaryotes, protists, lichens and mosses (pioneers) colonize first and create organic matter and soil for species. to grow.
The pioneer species change the environment, making it more suitable for other species to grow and outcompete them.
Ex: Glacier Bay, Alaska
Secondary Succession
occurs when an existing community has been cleared by a disturbance that leaves the soil intact.
Ex: Yellowstone Fires
Energy
flows through ecosystems
Sunlight --> chemical energy, heat
For now, forget deep sea-vents
Most ecosystems would vanish without the sun. Why?
Energy cannot be recycled
A continuous influx of energy from an external source-the Sun!
Energy Does What
ENTERS and EXITS an ecosystem
First Law of Thermodynamics
Energy cannot be created or destroyed, only transformed.
Total amount of energy does not change (but it changes form)
Consumers: Chemical energy in food = ATP + kinetic energy + heat…etc.
Energy is not made
it is converted from one form to another
Second Law of Thermodynamics
Every exchange of energy increases the entropy of the universe
With every energy conversion, part of the energy becomes unusable for work (heat)
Energy conversions are inefficient
Each unit of energy that enters an ecosystem eventually exits as heat
Energy does not cycle, it flows!
Chemicals
cycle within ecosystems
Elements/water are passed between the biotic and abiotic parts
Inorganic --> organic --> inorganic
Chemicals are recycled
Chemicals Do What
cycling, because chemicals are transferred back and forth between biotic and abiotic forms
Detritus =
dead organisms, feces, fallen leaves, anything nonliving.
Law of Conservation of Mass
Matter cannot be created or destroyed.
This law helps us understand why nutrients cycle (unlike energy).
Chemical elements are continually recycled within an ecosystem (next time)
Some elements can be gained or lost
Carried in/out by water or wind or atmospheric gases
Primary Production
The amount of light energy converted to chemical energy/unit time.
In some ecosystems, chemoautotrophs are the primary producers (e.g. deep sea vents)
Only about 1% of the visible light that hits earth, is
converted to chemical energy by photosynthetic organisms
Much is reflected or radiated back.
Gross Primary Production (GPP)
The amount of energy from light (or chemicals) converted to the chemical energy of organic molecules per unit time.
Less than 100% of the production is stored as organic material
Some organic molecules used in cellular respiration
Net Primary Production (NPP)
The storage of chemical energy that will be available to consumers in the ecosystem.
Only NPP is available for the next trophic level (usually half) Expressed as energy per unit area per unit time [J/(m2yr)] or (new) biomass added per unit area per unit time [g/(m2yr)]
NPP is the amount of
new biomass added in a given period of time.