topic 4
0.0(0)
Studied by 0 people Note
Note Call Kai
 Learn
Learn Practice Test
 Spaced Repetition
 Match
Match Flashcards
 Knowt Play
Card Sorting
1/46

Earn XP
Description and Tags
Last updated 8:34 AM on 10/3/22
Name | Mastery | Learn | Test | Matching | Spaced | Call with Kai | Chat |
|---|
No analytics yet
Send a link to your students to track their progress
47 Terms
1
New cards
demand
the amount of some good or service consumers are willing and able to purchase at each price.
2
New cards
quantity demanded
total number of units that consumers would purchase at that price
3
New cards
law of demand
inverse relationship between price and quantity demanded
4
New cards
demand curve
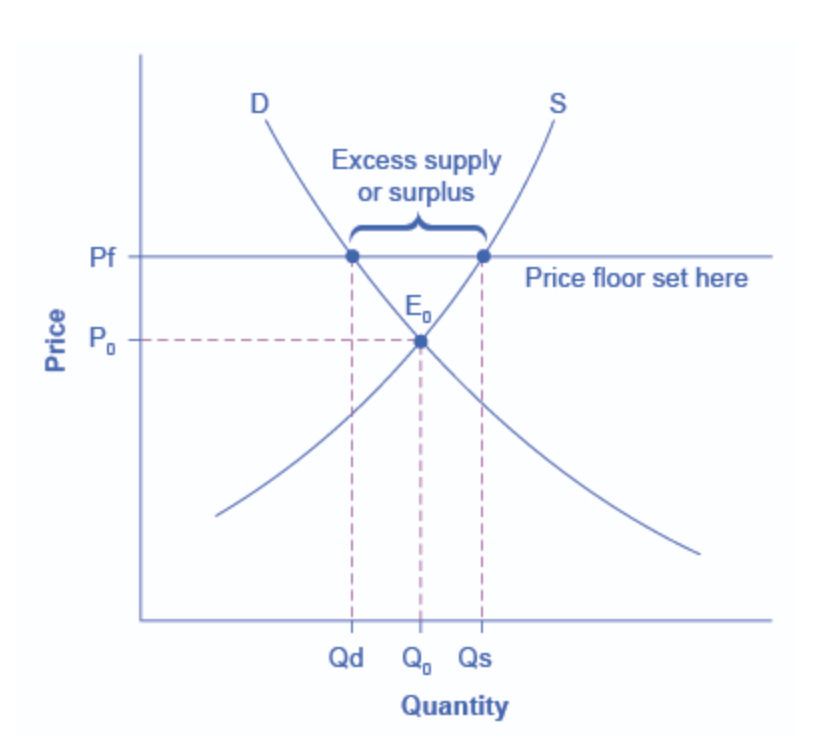
relationship between price and quantity demanded with quantity on the horizontal axis and the price on the vertical axis.
5
New cards
demand is not the same as quantity demanded. When economists talk about demand, they mean the relationship between a range of prices and the quantities demanded at those prices, as illustrated by a demand curve or a demand schedule. When economists talk about quantity demanded, they mean only a certain point on the demand curve, or one quantity on the demand schedule. In short, demand refers to the curve and quantity demanded refers to the (specific) point on the curve.
Is demand the same as quantity demanded?
6
New cards
supply
the amount of some good or service a producer is willing to supply at each price.
7
New cards
quantity supplied
affected by the rise or fall in price
8
New cards
law of supply.
assumes that all other variables that affect supply (to be explained in the next module) are held constant.
9
New cards
supply is not the same as quantity supplied. When economists refer to supply, they mean the relationship between a range of prices and the quantities supplied at those prices, a relationship that we can illustrate with a supply curve or a supply schedule. When economists refer to quantity supplied, they mean only a certain point on the supply curve, or one quantity on the supply schedule. In short, supply refers to the curve and quantity supplied refers to the (specific) point on the curve.
Is supply the same as quantity supplied?
10
New cards
supply curve
graphic illustration of the relationship between price, shown on the vertical axis, and quantity, shown on the horizontal axis.
11
New cards
Equilibrium
-Because the graphs for demand and supply curves both have price on the vertical axis and quantity on the horizontal axis, the demand curve and supply curve for a particular good or service can appear on the same graph. Together, demand and supply determine the price and the quantity that will be bought and sold in a market.
-Because the graphs for demand and supply curves both have price on the vertical axis and quantity on the horizontal axis, the demand curve and supply curve for a particular good or service can appear on the same graph. Together, demand and supply determine the price and the quantity that will be bought and sold in a market.
Where Demand and Supply Intersect and what does that mean
12
New cards
equilibrium price
the only price where the plans of consumers and the plans of producers agree—that is, where the amount of the product consumers want to buy (quantity demanded) is equal to the amount producers want to sell (quantity supplied).
13
New cards
excess supply or a surplus.
the quantity supplied exceeds the quantity demanded.
14
New cards
excess demand, or a shortage
When the price is below equilibrium, at the given price the quantity demanded, which has been stimulated by the lower price, now exceeds the quantity supplied, which had been depressed by the lower price.
15
New cards
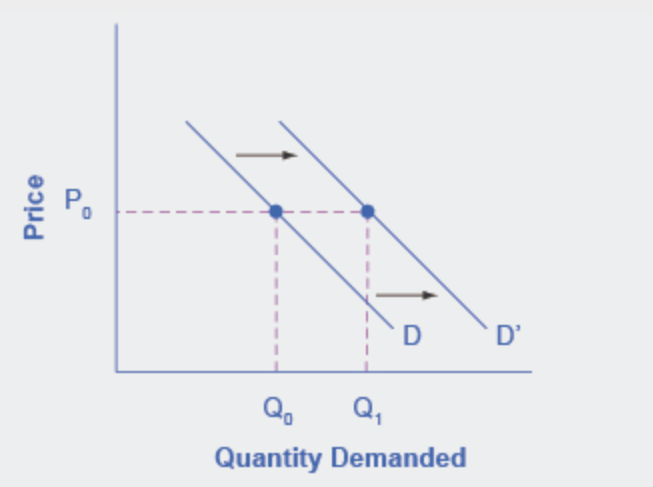
Shift in Demand
at any price (and at every price), the quantity demanded will be different than it was before. Following is an example of a shift in demand due to an income increase.
16
New cards
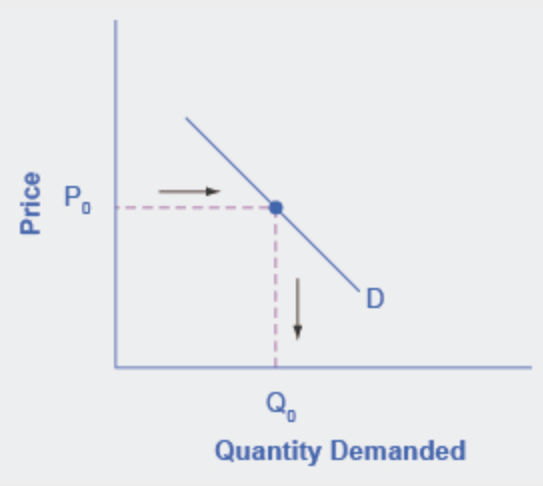
Demand Curve
- We can use the demand curve to identify how much consumers would buy at any given price
-
- We can use the demand curve to identify how much consumers would buy at any given price
-
what does this show you?
describe the possible change?
describe the possible change?
17
New cards
Demand curve
- income increases
- consumers buy more
- caused an upward right shift in the demand curve, so that at any price the quantities demanded will be higher
- With an increase in income, consumers will purchase larger quantities, pushing demand to the right and demand curve to the right.
- income increases
- consumers buy more
- caused an upward right shift in the demand curve, so that at any price the quantities demanded will be higher
- With an increase in income, consumers will purchase larger quantities, pushing demand to the right and demand curve to the right.
what does this show you?
describe the possible change?
describe the possible change?
18
New cards
factors that increase demand and therefore shift the demand curve upward/ rightward
- population likely to buy rises
- income rises (for a normal good)
- price of substitutes rises
- price of complement falls
- future expectations encourage buying
- income rises (for a normal good)
- price of substitutes rises
- price of complement falls
- future expectations encourage buying
19
New cards
factors that decrease demand and shift the demand curve downward / leftward
- population likely to buy drops
- income drops
price of substitutes falls
price of complements rises
future expectations discourage buying
- income drops
price of substitutes falls
price of complements rises
future expectations discourage buying
20
New cards
shift in supply
change in the quantity supplied at every price.
21
New cards
inputs or factors of production
A firm produces goods and services using combinations of labor, materials, and machinery
22
New cards
supply curve
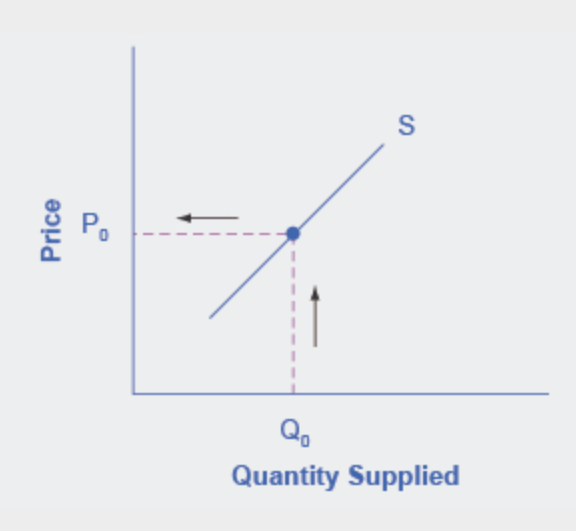
- shift in supply due to a production cost increase
- minimum price a firm will accept to produce a given quantity of output
- shift in supply due to a production cost increase
- minimum price a firm will accept to produce a given quantity of output
what does this show you?
describe the possible change?
describe the possible change?
23
New cards
supply curve
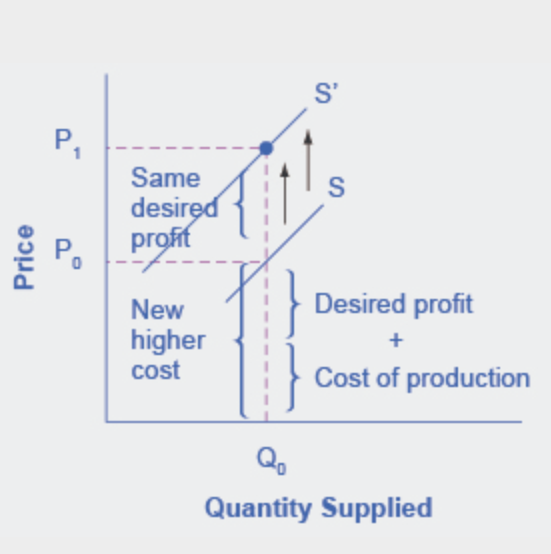
- when the cost of production and the desired profit equal the price a firm will set for a product
- when the cost of production increases, the price for the product will also need to increase
- the supply curve will shift that was caused by the increase in cost that caused an upward (leftward) shift in supply curve, so that at any price, the quantities supplied will be smaller
- when the cost of production and the desired profit equal the price a firm will set for a product
- when the cost of production increases, the price for the product will also need to increase
- the supply curve will shift that was caused by the increase in cost that caused an upward (leftward) shift in supply curve, so that at any price, the quantities supplied will be smaller
what does this show you?
describe the possible change?
describe the possible change?
24
New cards
factors that increase supply or shift the supply curve rightward
- favorable natural conditions for production
- fall in input prices
- improved technology
- lower product taxes / less costly regulations
- fall in input prices
- improved technology
- lower product taxes / less costly regulations
25
New cards
factors that decrease supply or shift the supply curve leftward
- poor natural conditions for production
- rise in input prices
- a decline in technology (not common)
- higher product taxes
- more costly regulations
- rise in input prices
- a decline in technology (not common)
- higher product taxes
- more costly regulations
26
New cards
deadweight
The loss in social surplus that occurs when the economy produces at an inefficient quantity
27
New cards
producer surplus
The extra benefit producers receive from selling a good or service, measured by the price the producer actually received minus the price the producer would have been willing to accept
28
New cards
consumer surplus
The amount that individuals would have been willing to pay, minus the amount that they actually paid
29
New cards
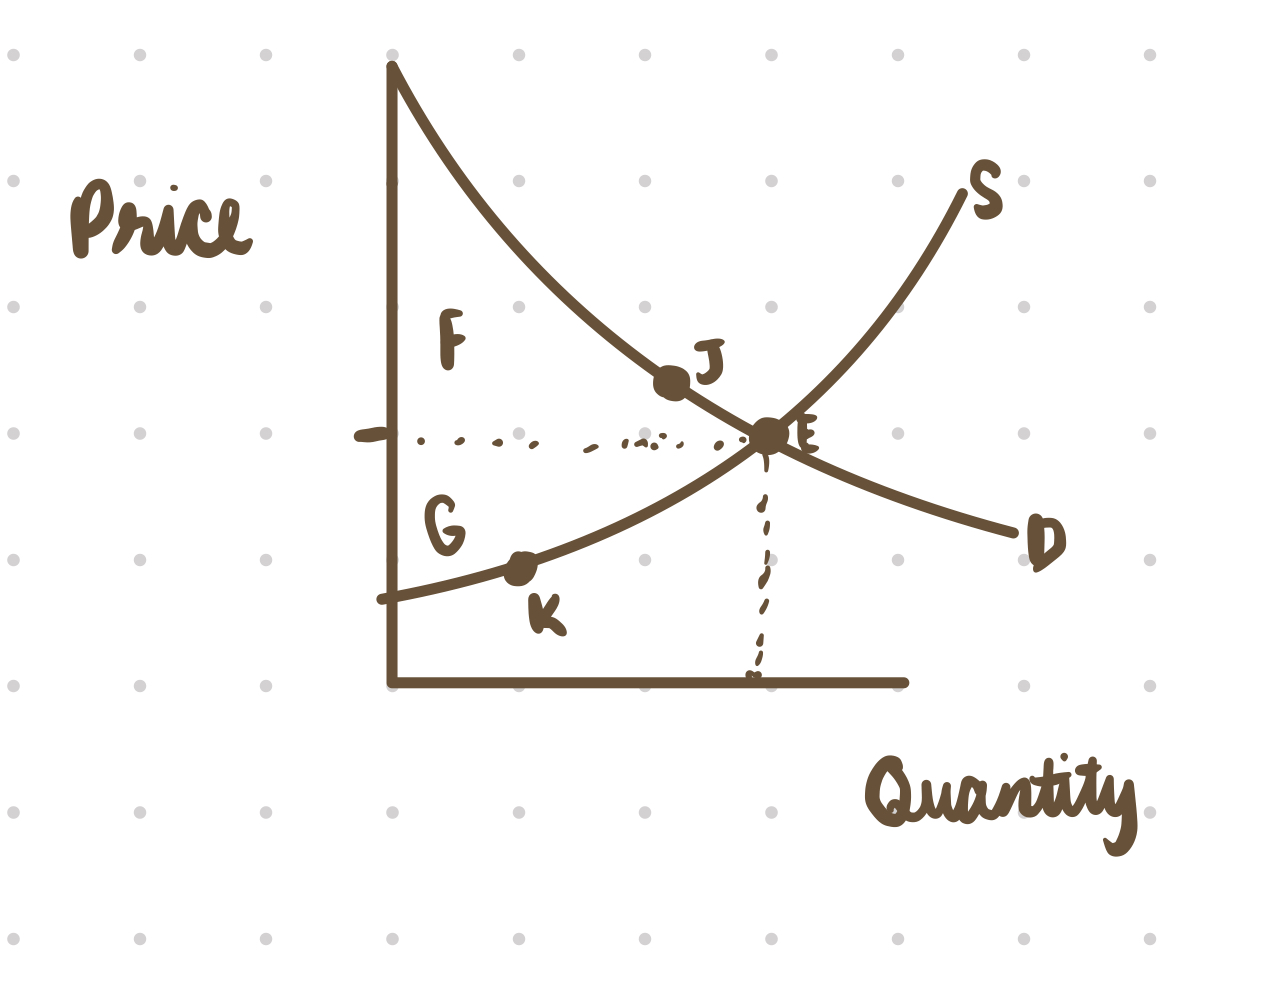
F because the equilibrium price in the market was way less than that many of the consumers were willing to pay
where is consumer surplus on a graph and what does it mean
30
New cards
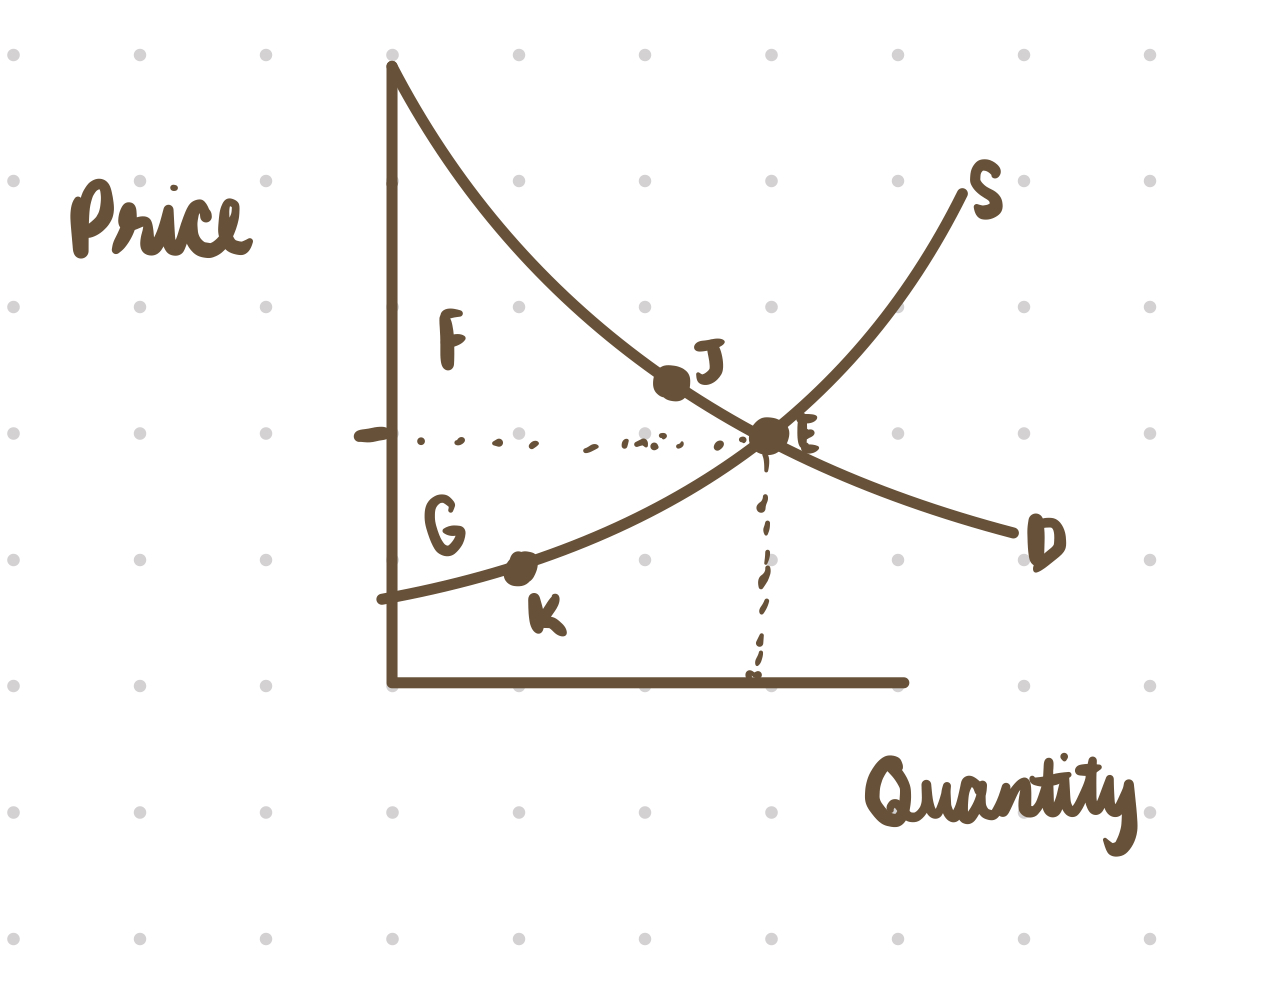
G because the equilibrium price received in the market was more than what many of the producers were willing to accept for their products
where is producer surplus on a graph and what does it mean
31
New cards
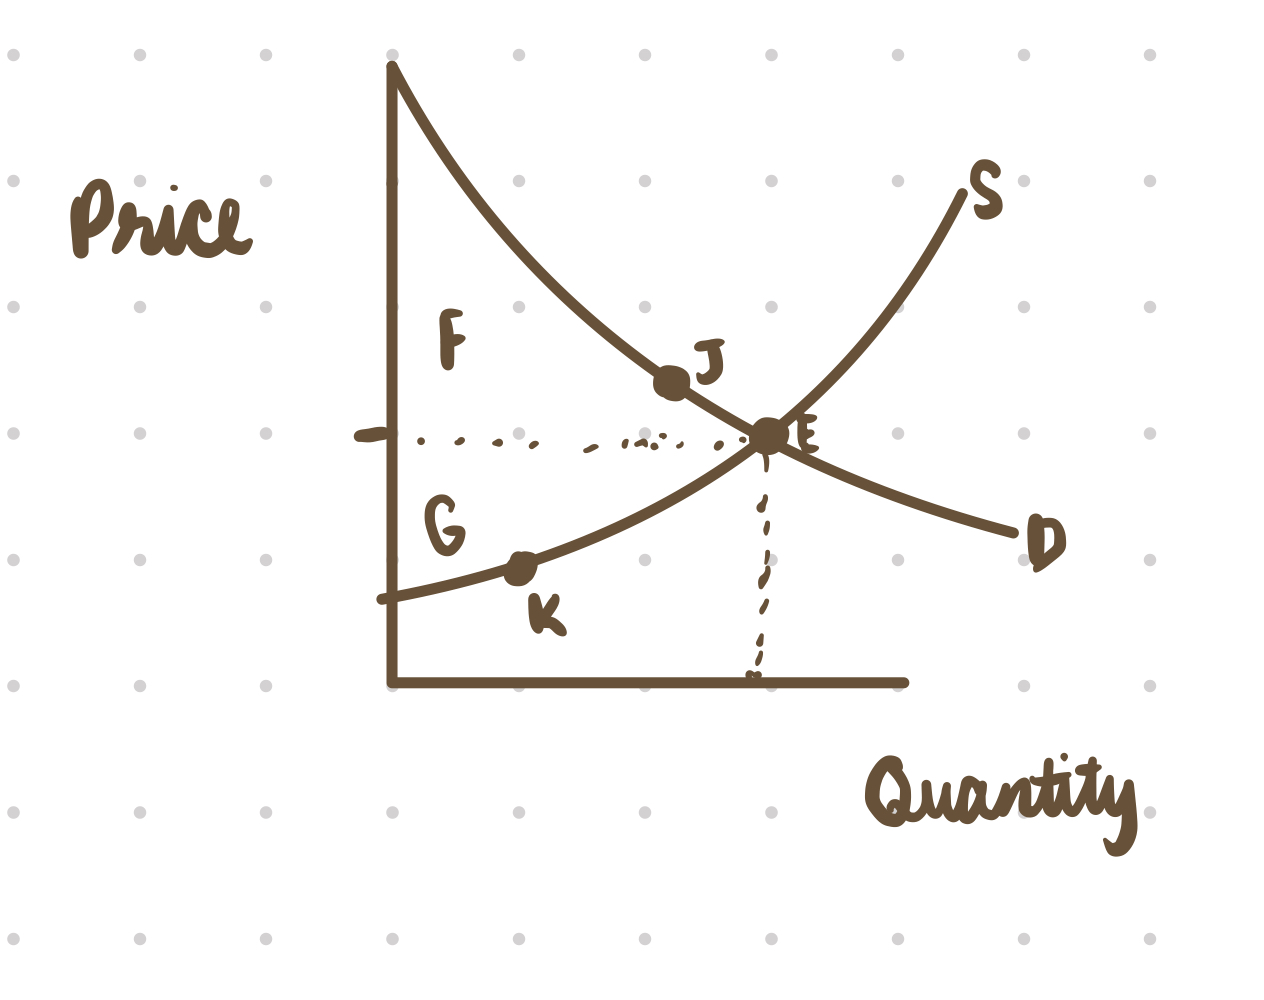
S= ssupply curve
D= demand curve
E= equillibrum
F= consumer surplus
G= producer surplus
J= a point on the demand curve that shows
D= demand curve
E= equillibrum
F= consumer surplus
G= producer surplus
J= a point on the demand curve that shows
name each part of this graph
32
New cards
mutually beneficial trade
trade benefitting both sides because gains from trade come from specializing in one's comparative advantage
33
New cards
shocks
what can shift the aggregate supply curve that is affected by its effects to input good or labor
34
New cards
price ceiling
keeps a price from rising above a certain level
- a legal maximum price that one pays for some good or service.
- a legal maximum price that one pays for some good or service.
35
New cards
price floor
keeps a price from falling below a given level
- lowest price that one can legally pay for some good or service.
- lowest price that one can legally pay for some good or service.
36
New cards
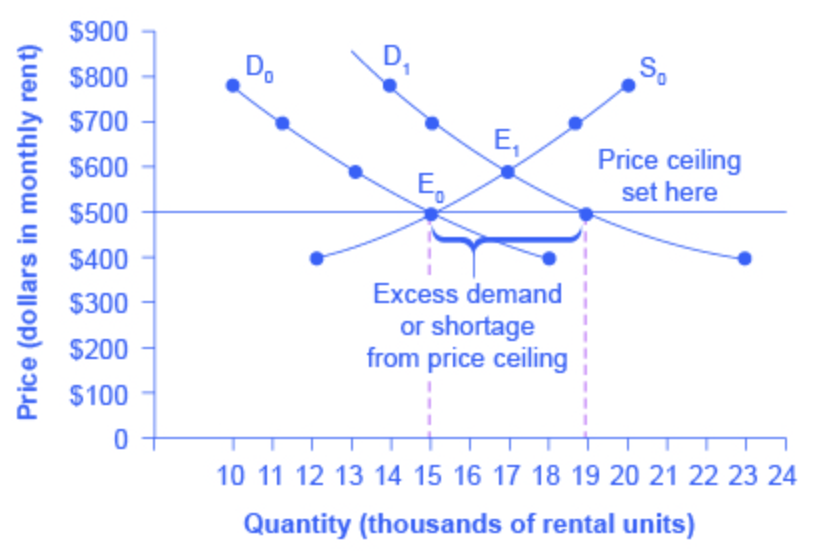
example of price ceiling
- price ceiling is set but there is excess demand or shortage from the price not being permitted to rise, the quantity supplied remains at 15,000
- price ceiling is set but there is excess demand or shortage from the price not being permitted to rise, the quantity supplied remains at 15,000
what is happening here
37
New cards
price floor example where the a price floor set at PF holds the price above the equillibrium and prevents it from falling. the quanitity supplied Qs exceeds the quanitity demanded Qd, there is excess supply
what is happening here
38
New cards
elasticity
an economics concept that measures responsiveness of one variable to changes in another variable
39
New cards
elastic demand
when the elasticity of demand is greater than one, indicating a high responsiveness of quantity demanded or supplied to changes in price
- smaller decrease in price
- smaller decrease in price
40
New cards
elastic supply
when the elasticity of either supply is greater than one, indicating a high responsiveness of quantity demanded or supplied to changes in price
41
New cards
inelastic demand
when the elasticity of demand is less than one, indicating that a 1 percent increase in price paid by the consumer leads to less than a 1 percent change in purchases (and vice versa); this indicates a low responsiveness by consumers to price changes
- bigger decrease in price
- bigger decrease in price
42
New cards
inelastic supply
when the elasticity of supply is less than one, indicating that a 1 percent increase in price paid to the firm will result in a less than 1 percent increase in production by the firm; this indicates a low responsiveness of the firm to price increases (and vice versa if prices drop)
43
New cards
price elasticity of supply
percentage change in the quantity supplied divided by the percentage change in price
44
New cards
price elasticity of demand
percentage change in the quantity demanded of a good or service divided the percentage change in price
45
New cards
Quantity demanded (QD)=Quantity Supplied (QS)
what is the formula for equilibrium price
46
New cards
deadweight loss would occur if there were units that could have been traded for mutual benefit of buyer and seller (surpluses)
what must happen for there to be deadweight loss?
47
New cards
area of triangle: 1/2 b*h
how do you calculate consumer surplus/ producers surplus using a graph