Chapter 10: Two Quantitative Variables (Correlation and Regression)
1/27
There's no tags or description
Looks like no tags are added yet.
Name | Mastery | Learn | Test | Matching | Spaced |
|---|
No study sessions yet.
28 Terms
What is a scatterplot and what does it represent?
A scatterplot shows the relationship between two quantitative variables measured on the same individuals, using dots to represent individual pairs. X-axis: explanatory; Y-axis: response.
What are the three main aspects of a scatterplot?
1. Form (linear, curved)
2. Direction (positive, negative, or none)
3. Strength (tightness of the points to a form)
What does a positive, negative, or no linear relationship mean?
• Positive: As x increases, y increases
• Negative: As x increases, y decreases
• No linear relationship: x and y don’t follow a linear trend
What’s the difference between “no linear” and “no relationship”?
No linear relationship doesn’t mean no relationship at all—it might be nonlinear.
What is the correlation coefficient (r)?
A numerical summary of the strength and direction of a linear relationship between two quantitative variables.
Range: -1 ≤ r ≤ 1
What are key properties of the correlation coefficient r?
• Same sign as slope
• Unitless
• Affected by outliers
• Only for quantitative variables
• r =1: perfect linear relationship
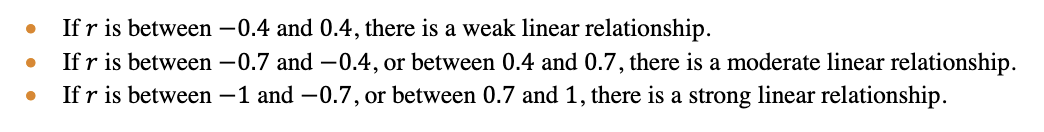
Rule of Thumb for interpreting r?
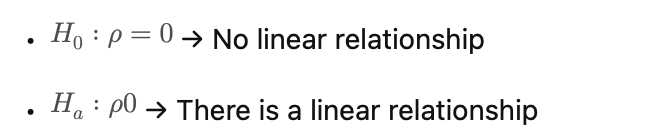
What are the hypotheses for testing correlation \rho?
𝐻0: There is no linear relationship between 𝑥 and 𝑦
𝐻𝑎: There is a linear relationship between 𝑥 and 𝑦
How is the simulation approach used to test correlation?
Shuffle the y-values to simulate the null hypothesis and generate a distribution of r-values under H_0.
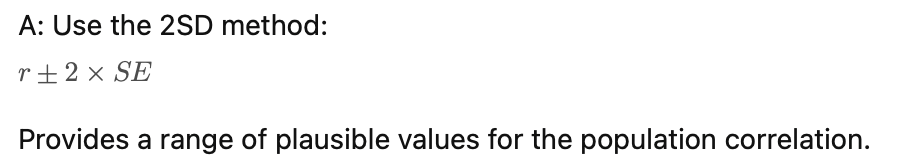
How is a confidence interval for p estimated via simulation?

What is a deterministic model?
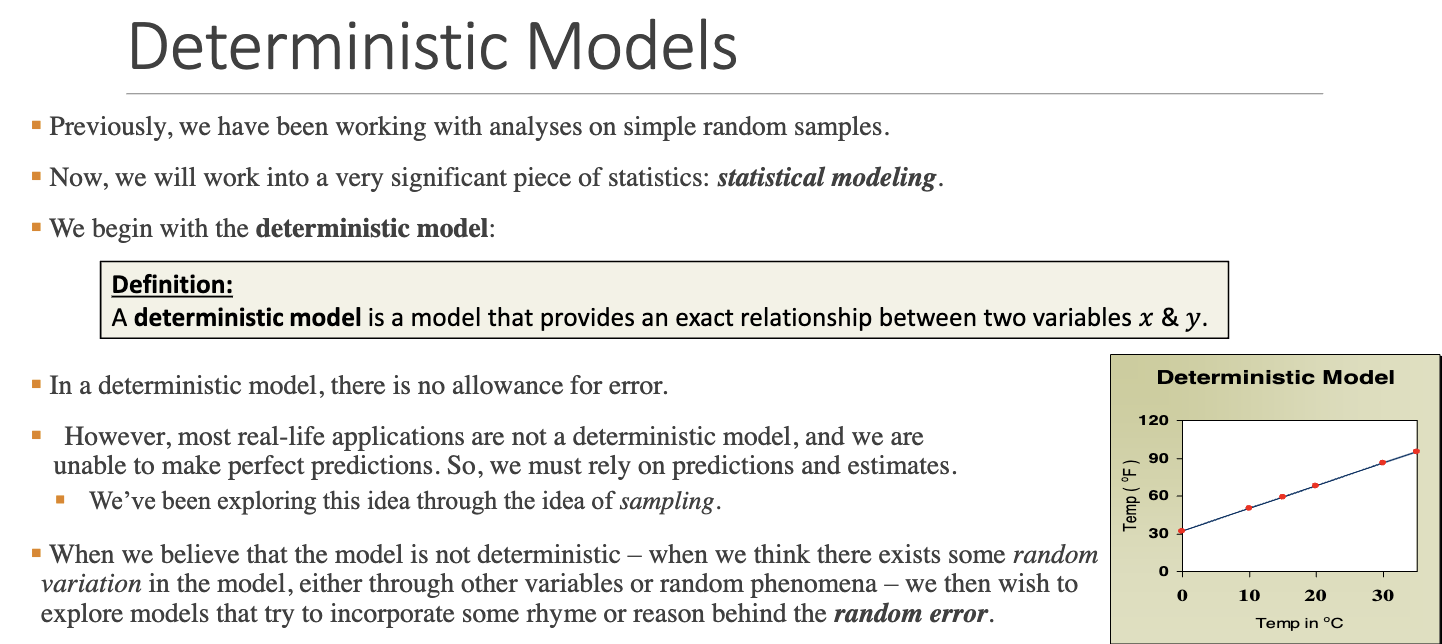
Why is a deterministic model unrealistic in most real-world data?
Because in practice, random variation (due to uncontrolled factors or measurement error) always exists, so we move to probabilistic models.
What is the least squares regression line?
A line that best fits the data by minimizing the sum of squared residuals
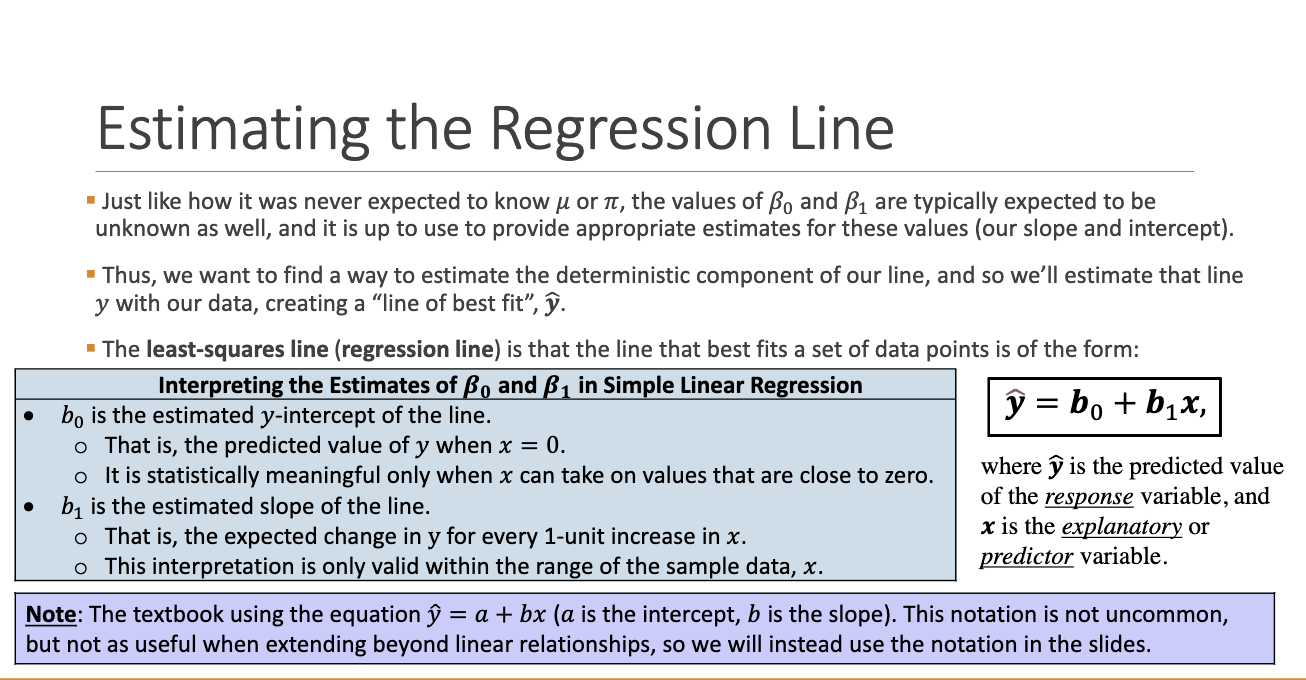
What do b0 and b1 represent?
• b0: y-intercept (when x = 0)
• b1: slope (change in y per unit x)
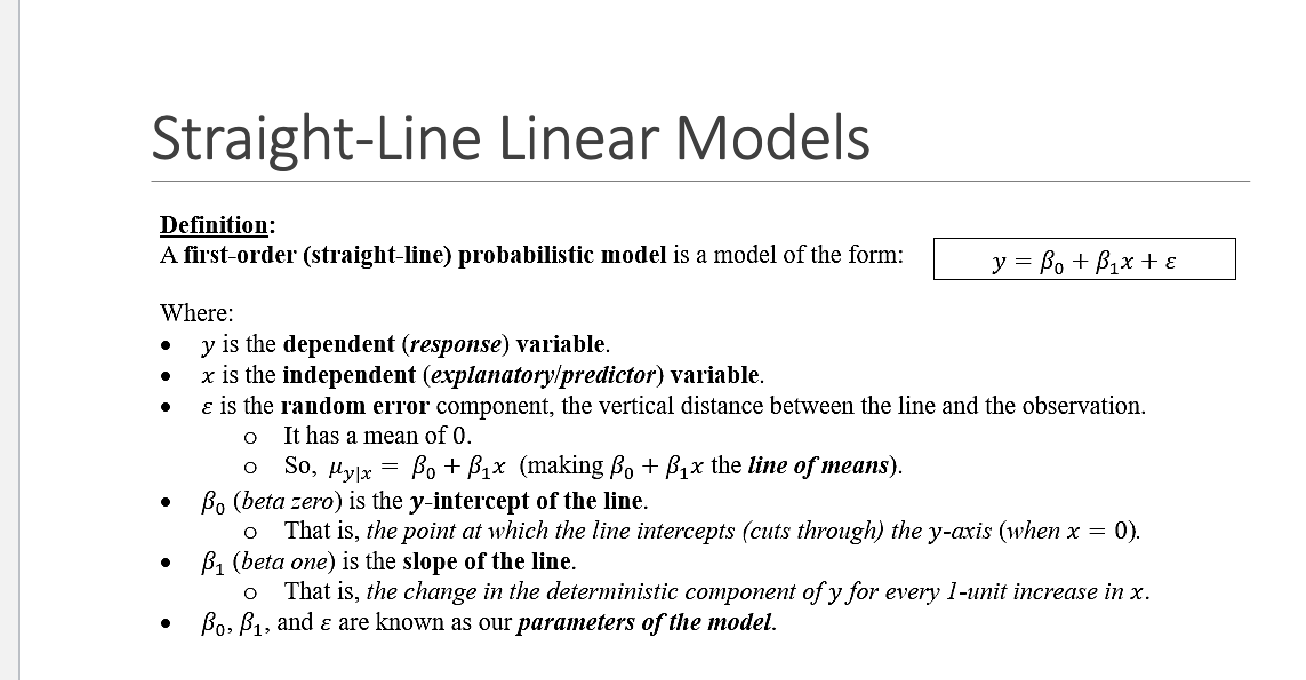
Straight-Line Linear Models
Methods of least square
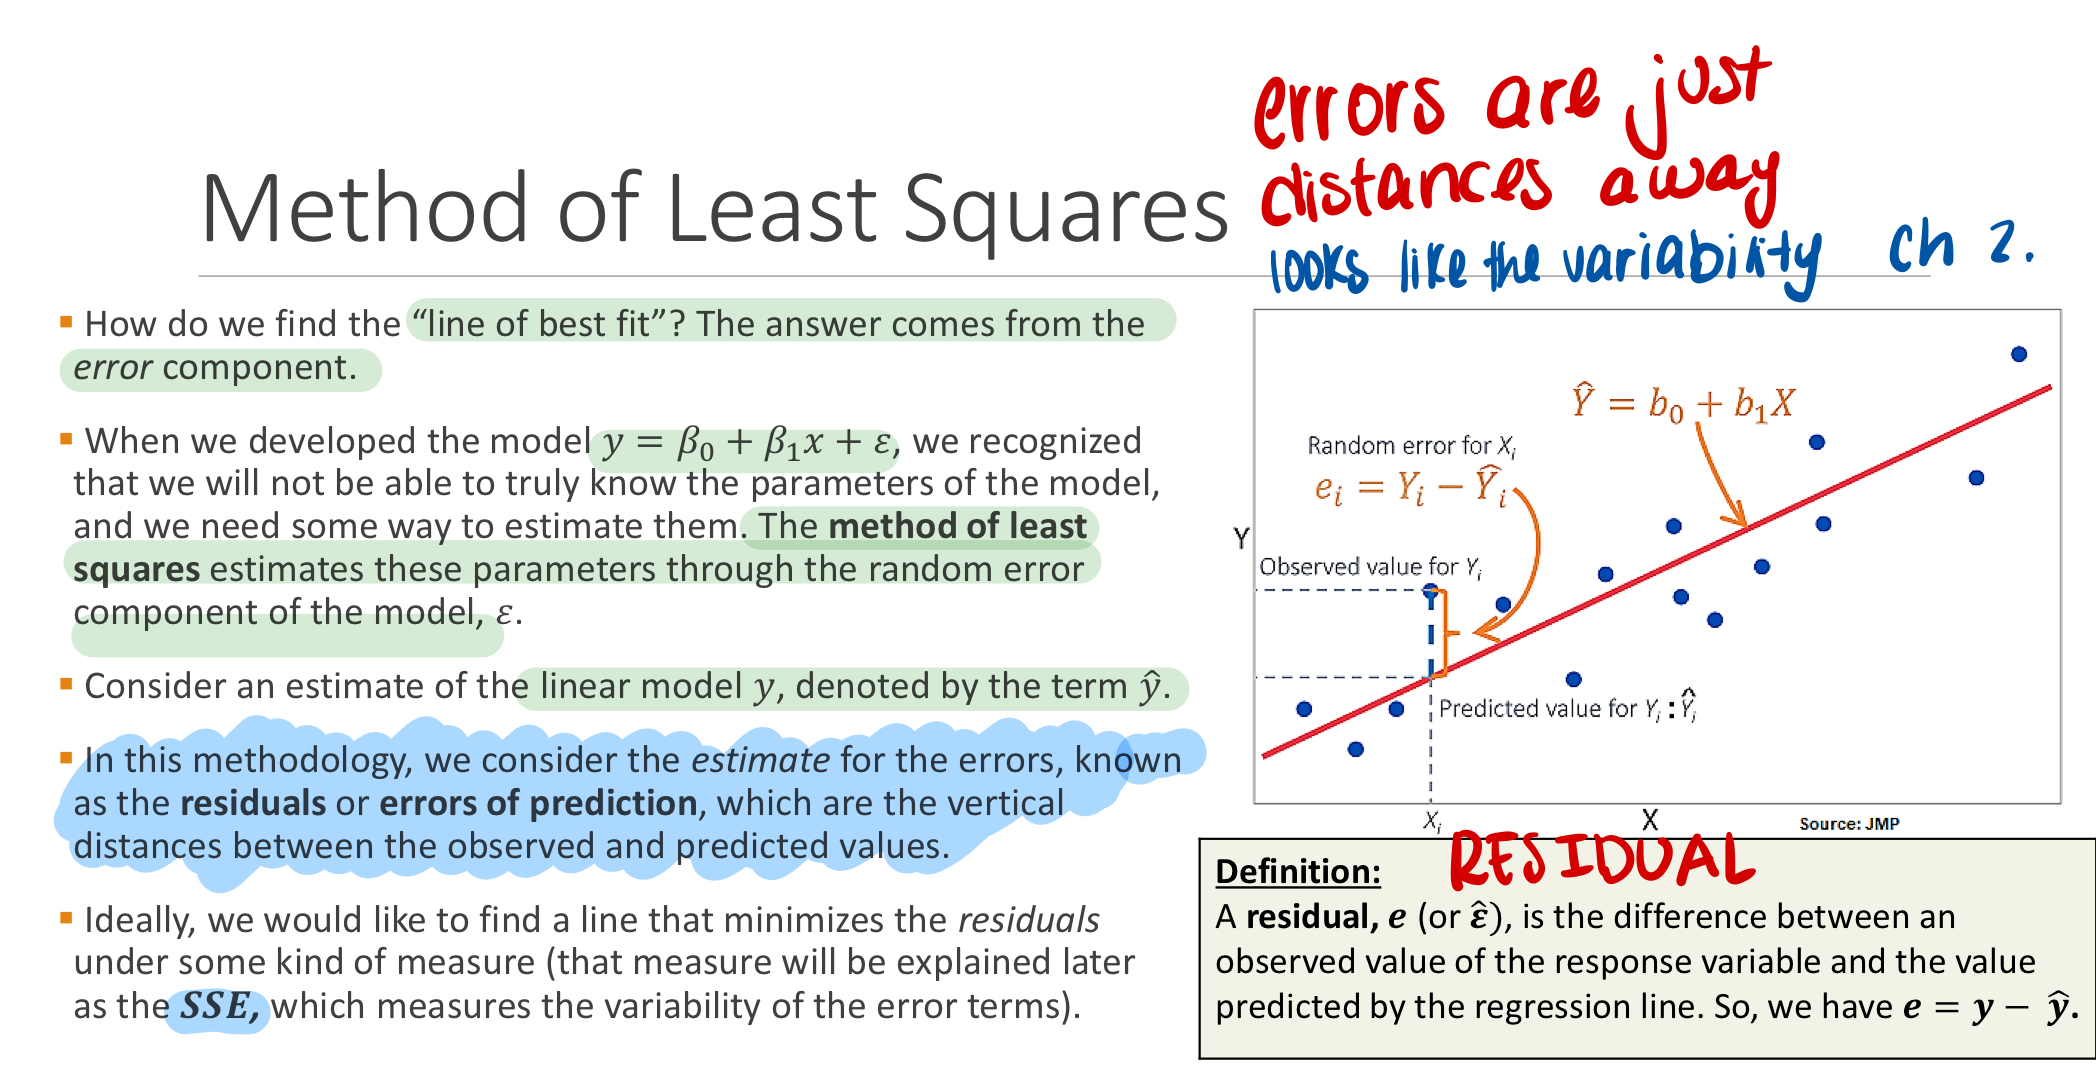
What is a residual?
e = y - y(hat)
It’s the vertical distance between an actual data point and the predicted point.
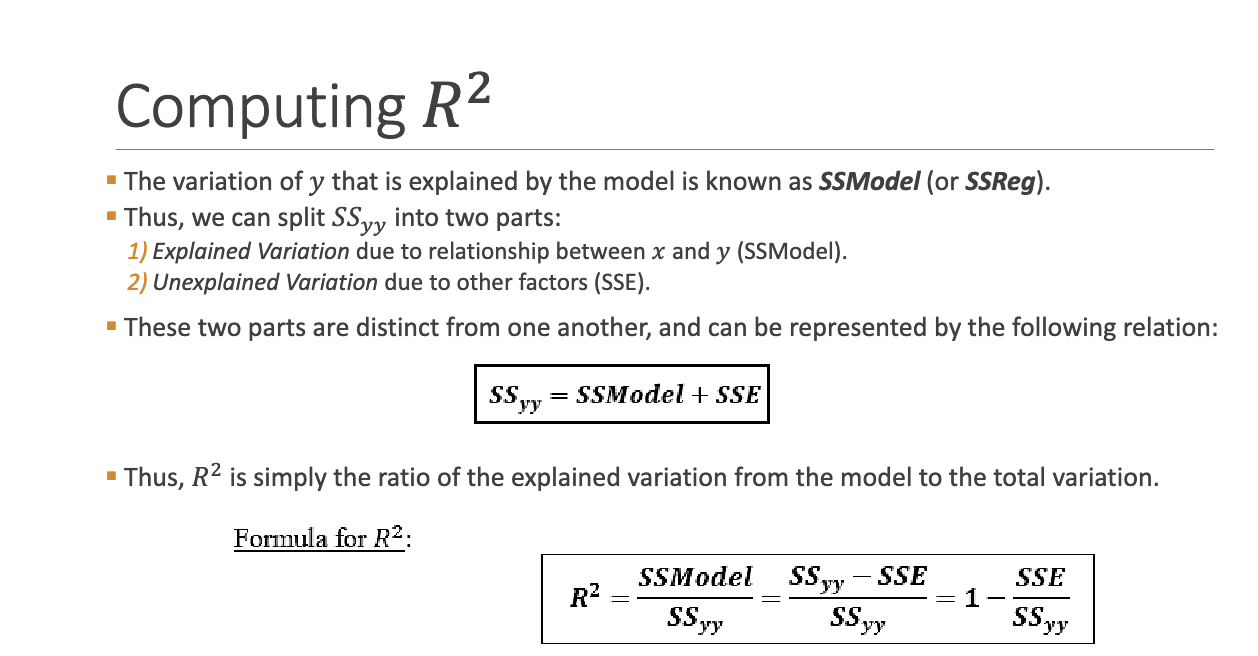
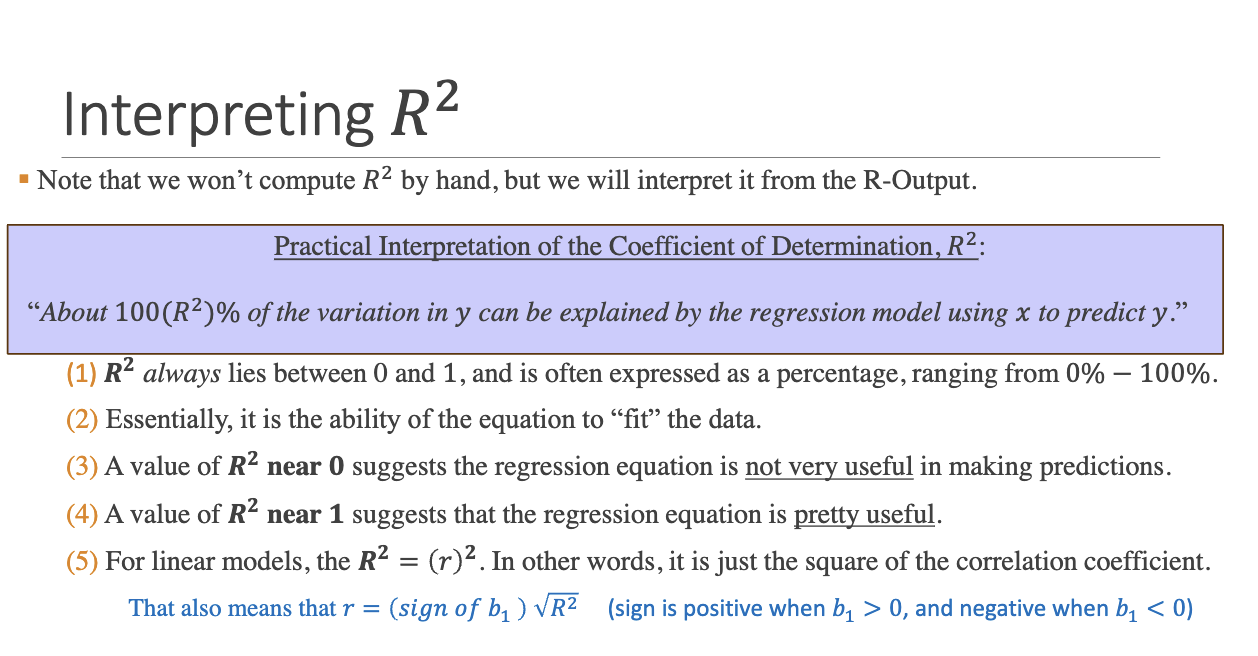
What is R^2 and how is it interpreted?
Coefficient of determination. It represents the proportion of variance in y explained by x.
Interpreting R²
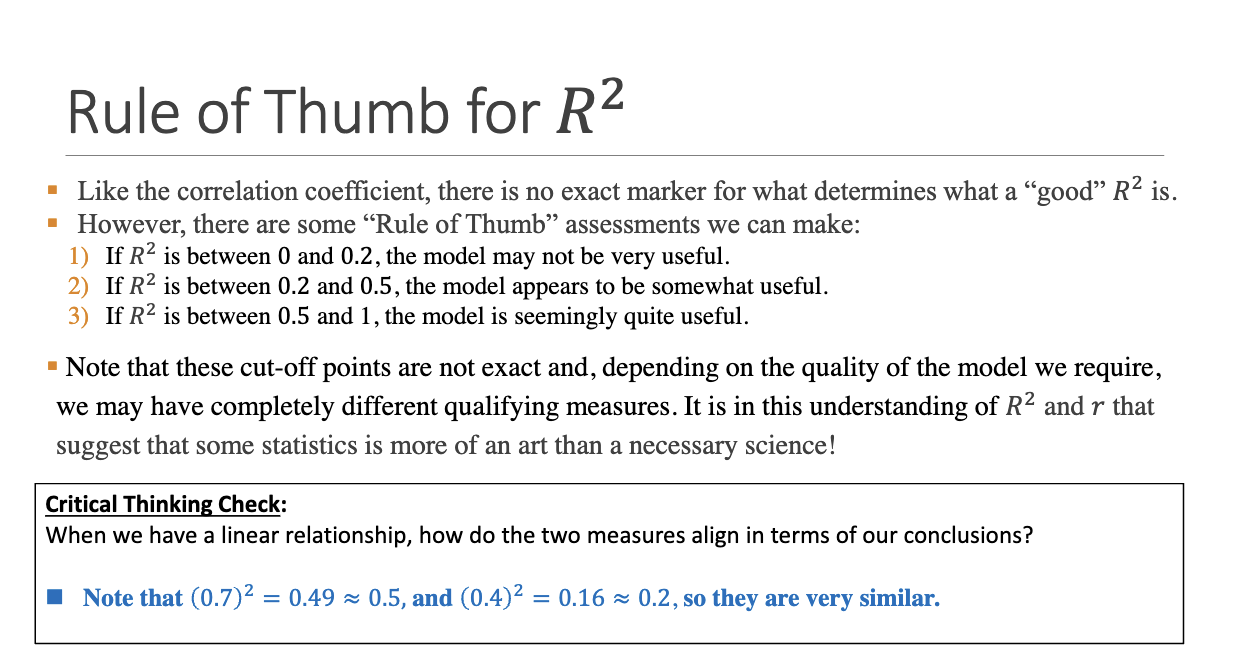
Rule of thumb for R²?
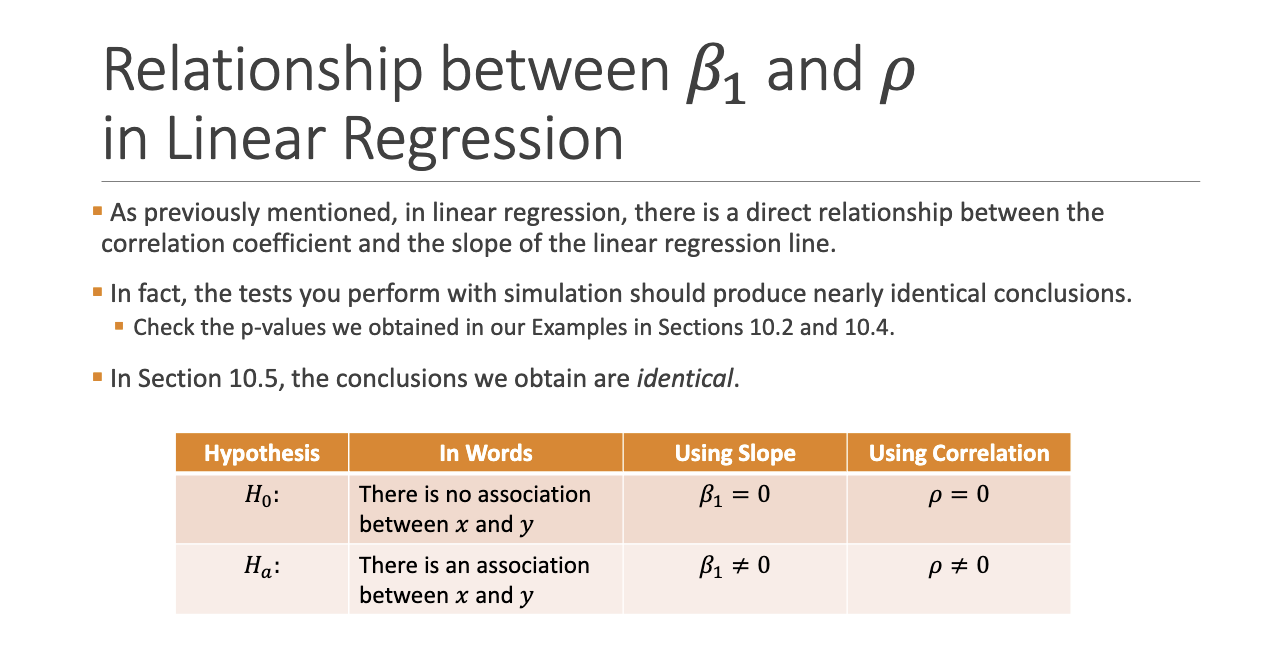
What are the hypotheses for testing slope \beta_1?
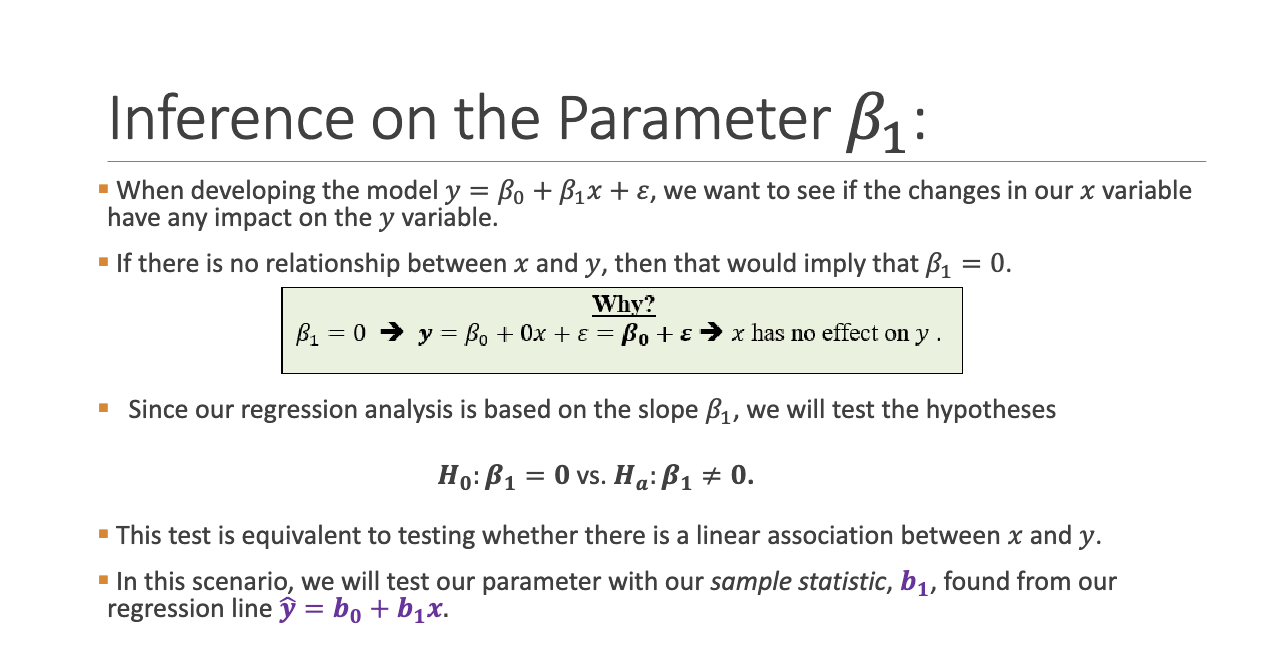
What is the link between slope and correlation in regression?
Testing B1 = 0 is equivalent to testing P = 0 for linear models.
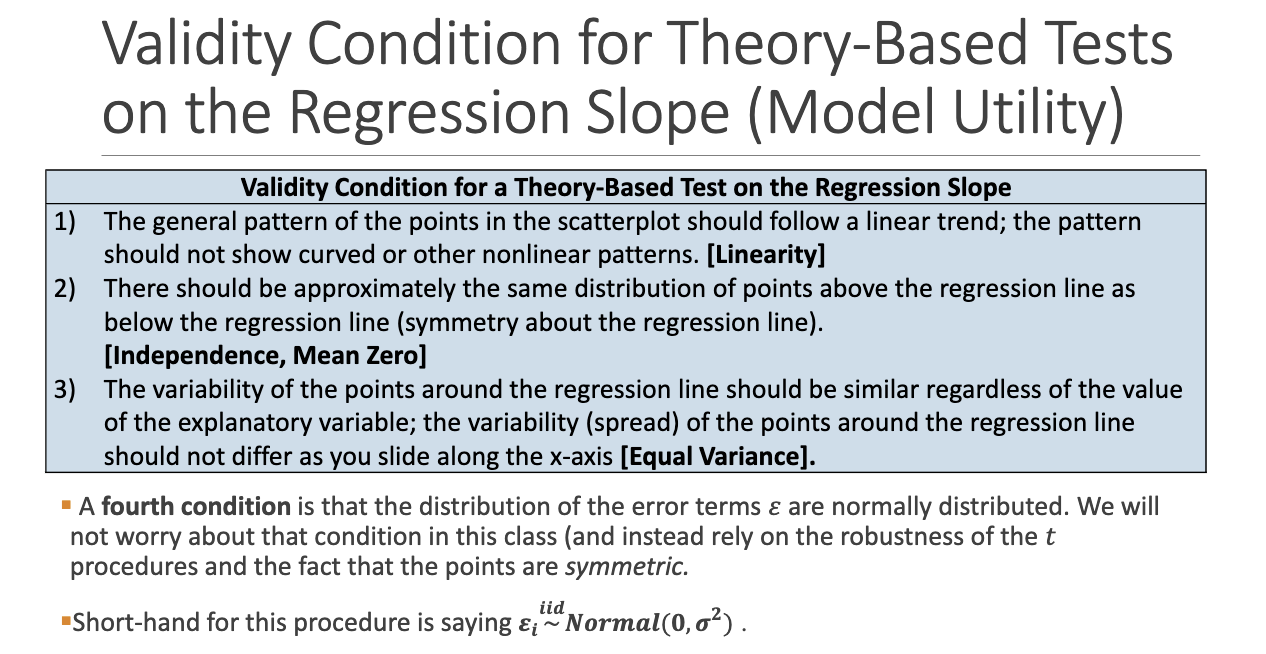
What are the validity conditions for theory-based slope inference?
1. Linearity
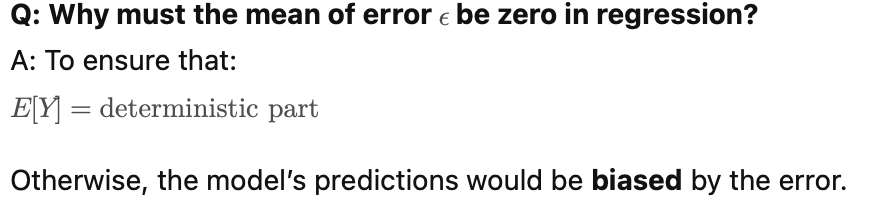
2. Symmetric residuals (mean zero)
3. Equal variance along x
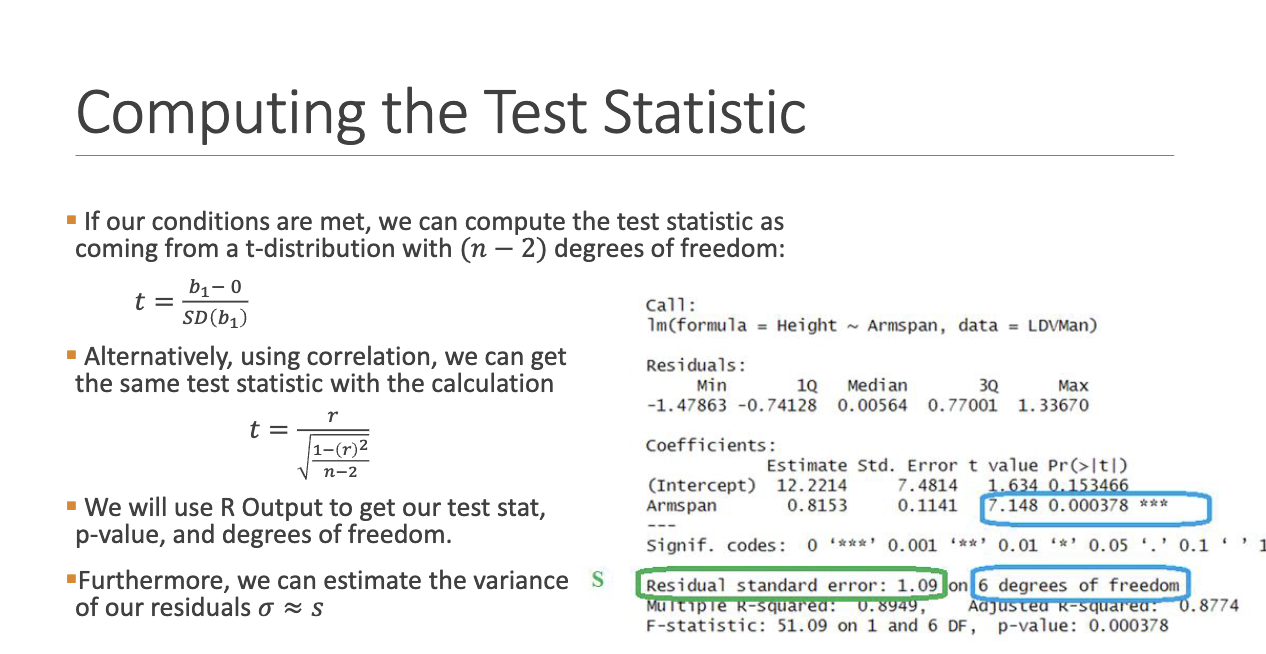
What is the test statistic for slope in regression?
How do we interpret the confidence interval for B1?
If 0 is not in the CI → significant slope → strong evidence for a linear relationship.
What should we be cautious of in regression?
• Extrapolation beyond data range
• Outliers that affect line
• Influential points far in x-direction that pull the regression line
What is a probabilistic model in regression?
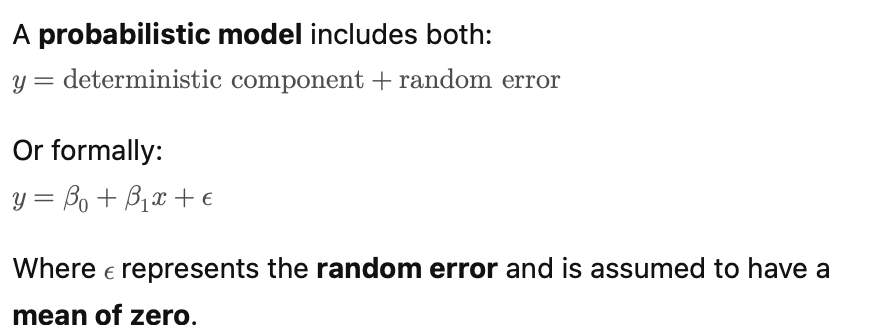
Why must the mean of error \epsilon be zero in regression?